Facebook
 X
X
 Pinterest
 Copy Link

SF East Bay Real Estate Market Update
June 30, 2020
By Glen Bell (510) 333-4460
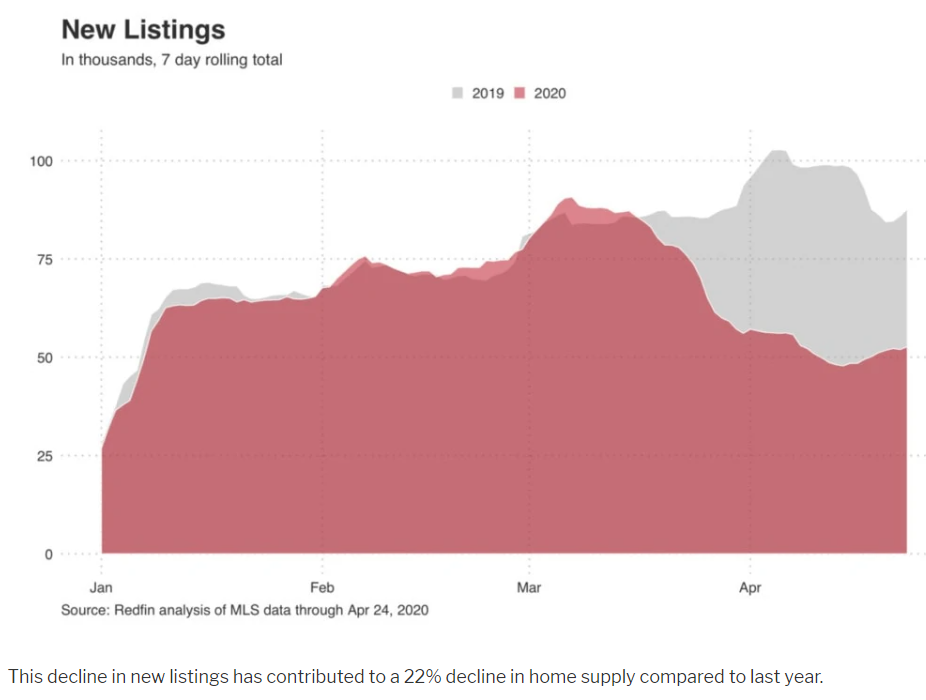
No doubt that the COVID-19 has had its effects on our local real estate market. We haven’t seen dramatic changes just yet. What we have seen is a “mixed” bag. Low inventory levels and low interest rates continue to be the story of this market.
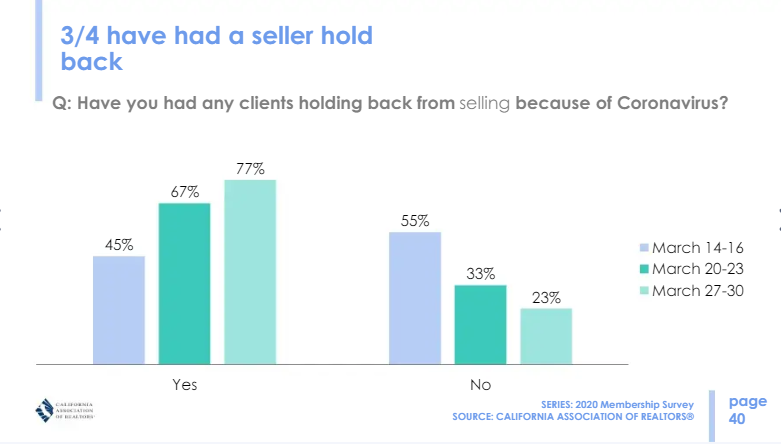
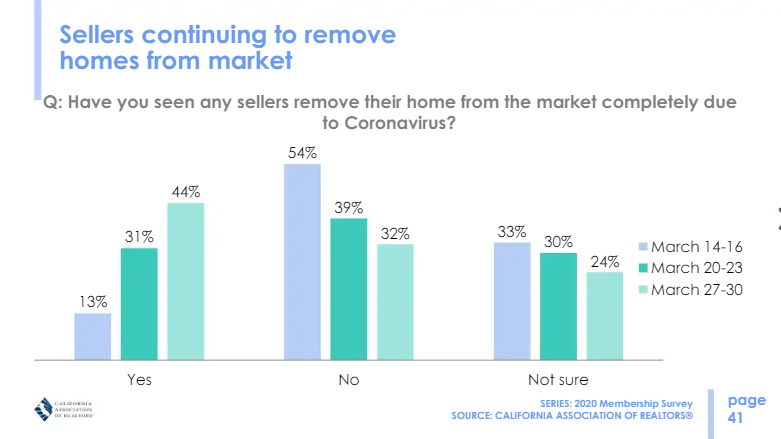
What we’ve seen since COVID-19 began, is that many sellers decided to delay or postpone coming onto the market until some of the uncertainty subsides. Many buyers have jumped back on the fence and are holding off. The uncertainty of their job being in jeopardy, a loss in income, health fears, or seeing a “big hit” in their stock portfolio has taken its toll. Although there may be fewer buyers out there, there are still even fewer homes for sale. Many are getting gobbled up now.
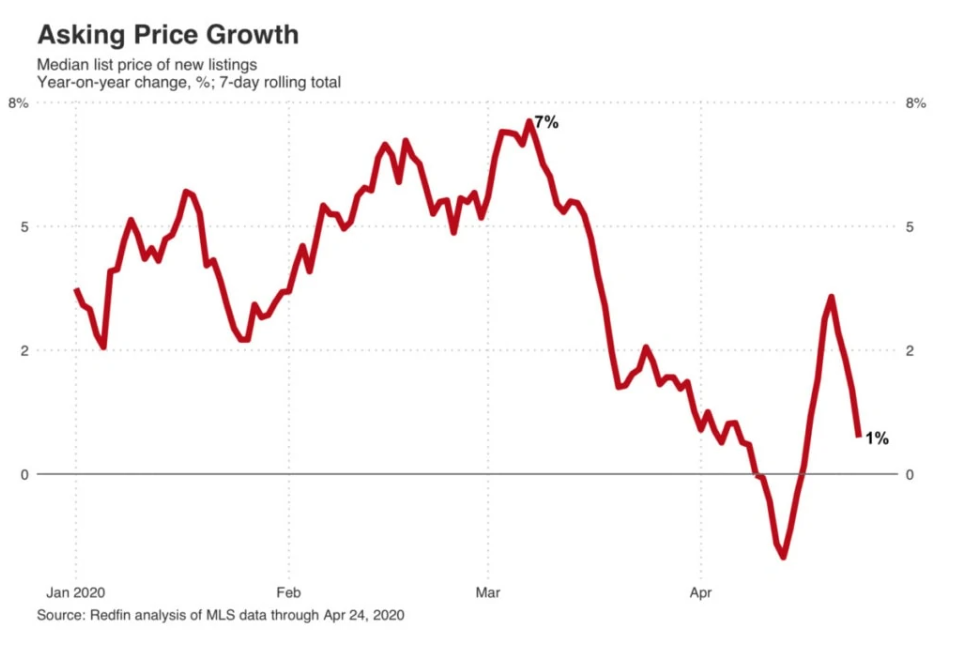
The C0vid-19 market is such a “mixed” bag right now that it’s difficult to wrap your hands around it or even try to predict what’s coming down the pike. As I’ve said before; this is unchartered territory. Affordable homes in the right location that are in somewhat move-in condition seem to be getting the most attention. Many buyers are reluctant to make big commitments on cash reserves for the “high end” market or big time fixers. That market seems to be a little “soft” in many areas right now. Buyers may also be shying away from the “close quarters” of the more expensive condos. However, the “right” house, in the “right” location will still experience a competitive market with multiple offers.
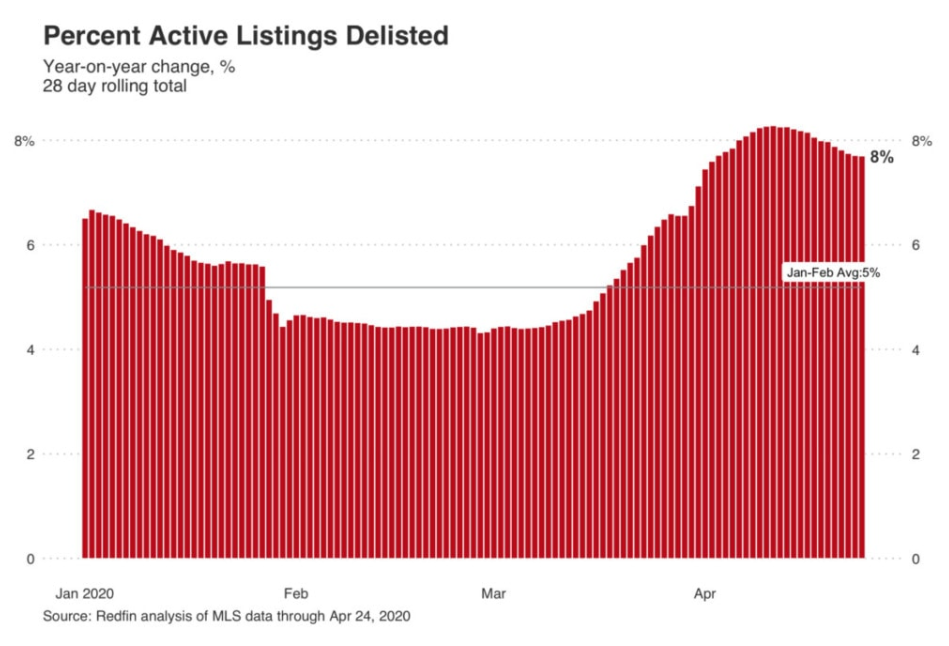
Income properties are more sensitive to risk aversion. Eviction moratoriums, rent reductions, local pre-tenant ordinances being passed, COVID-19 related payment deferrals, have all taken their toll and made these properties less attractive to buyers.
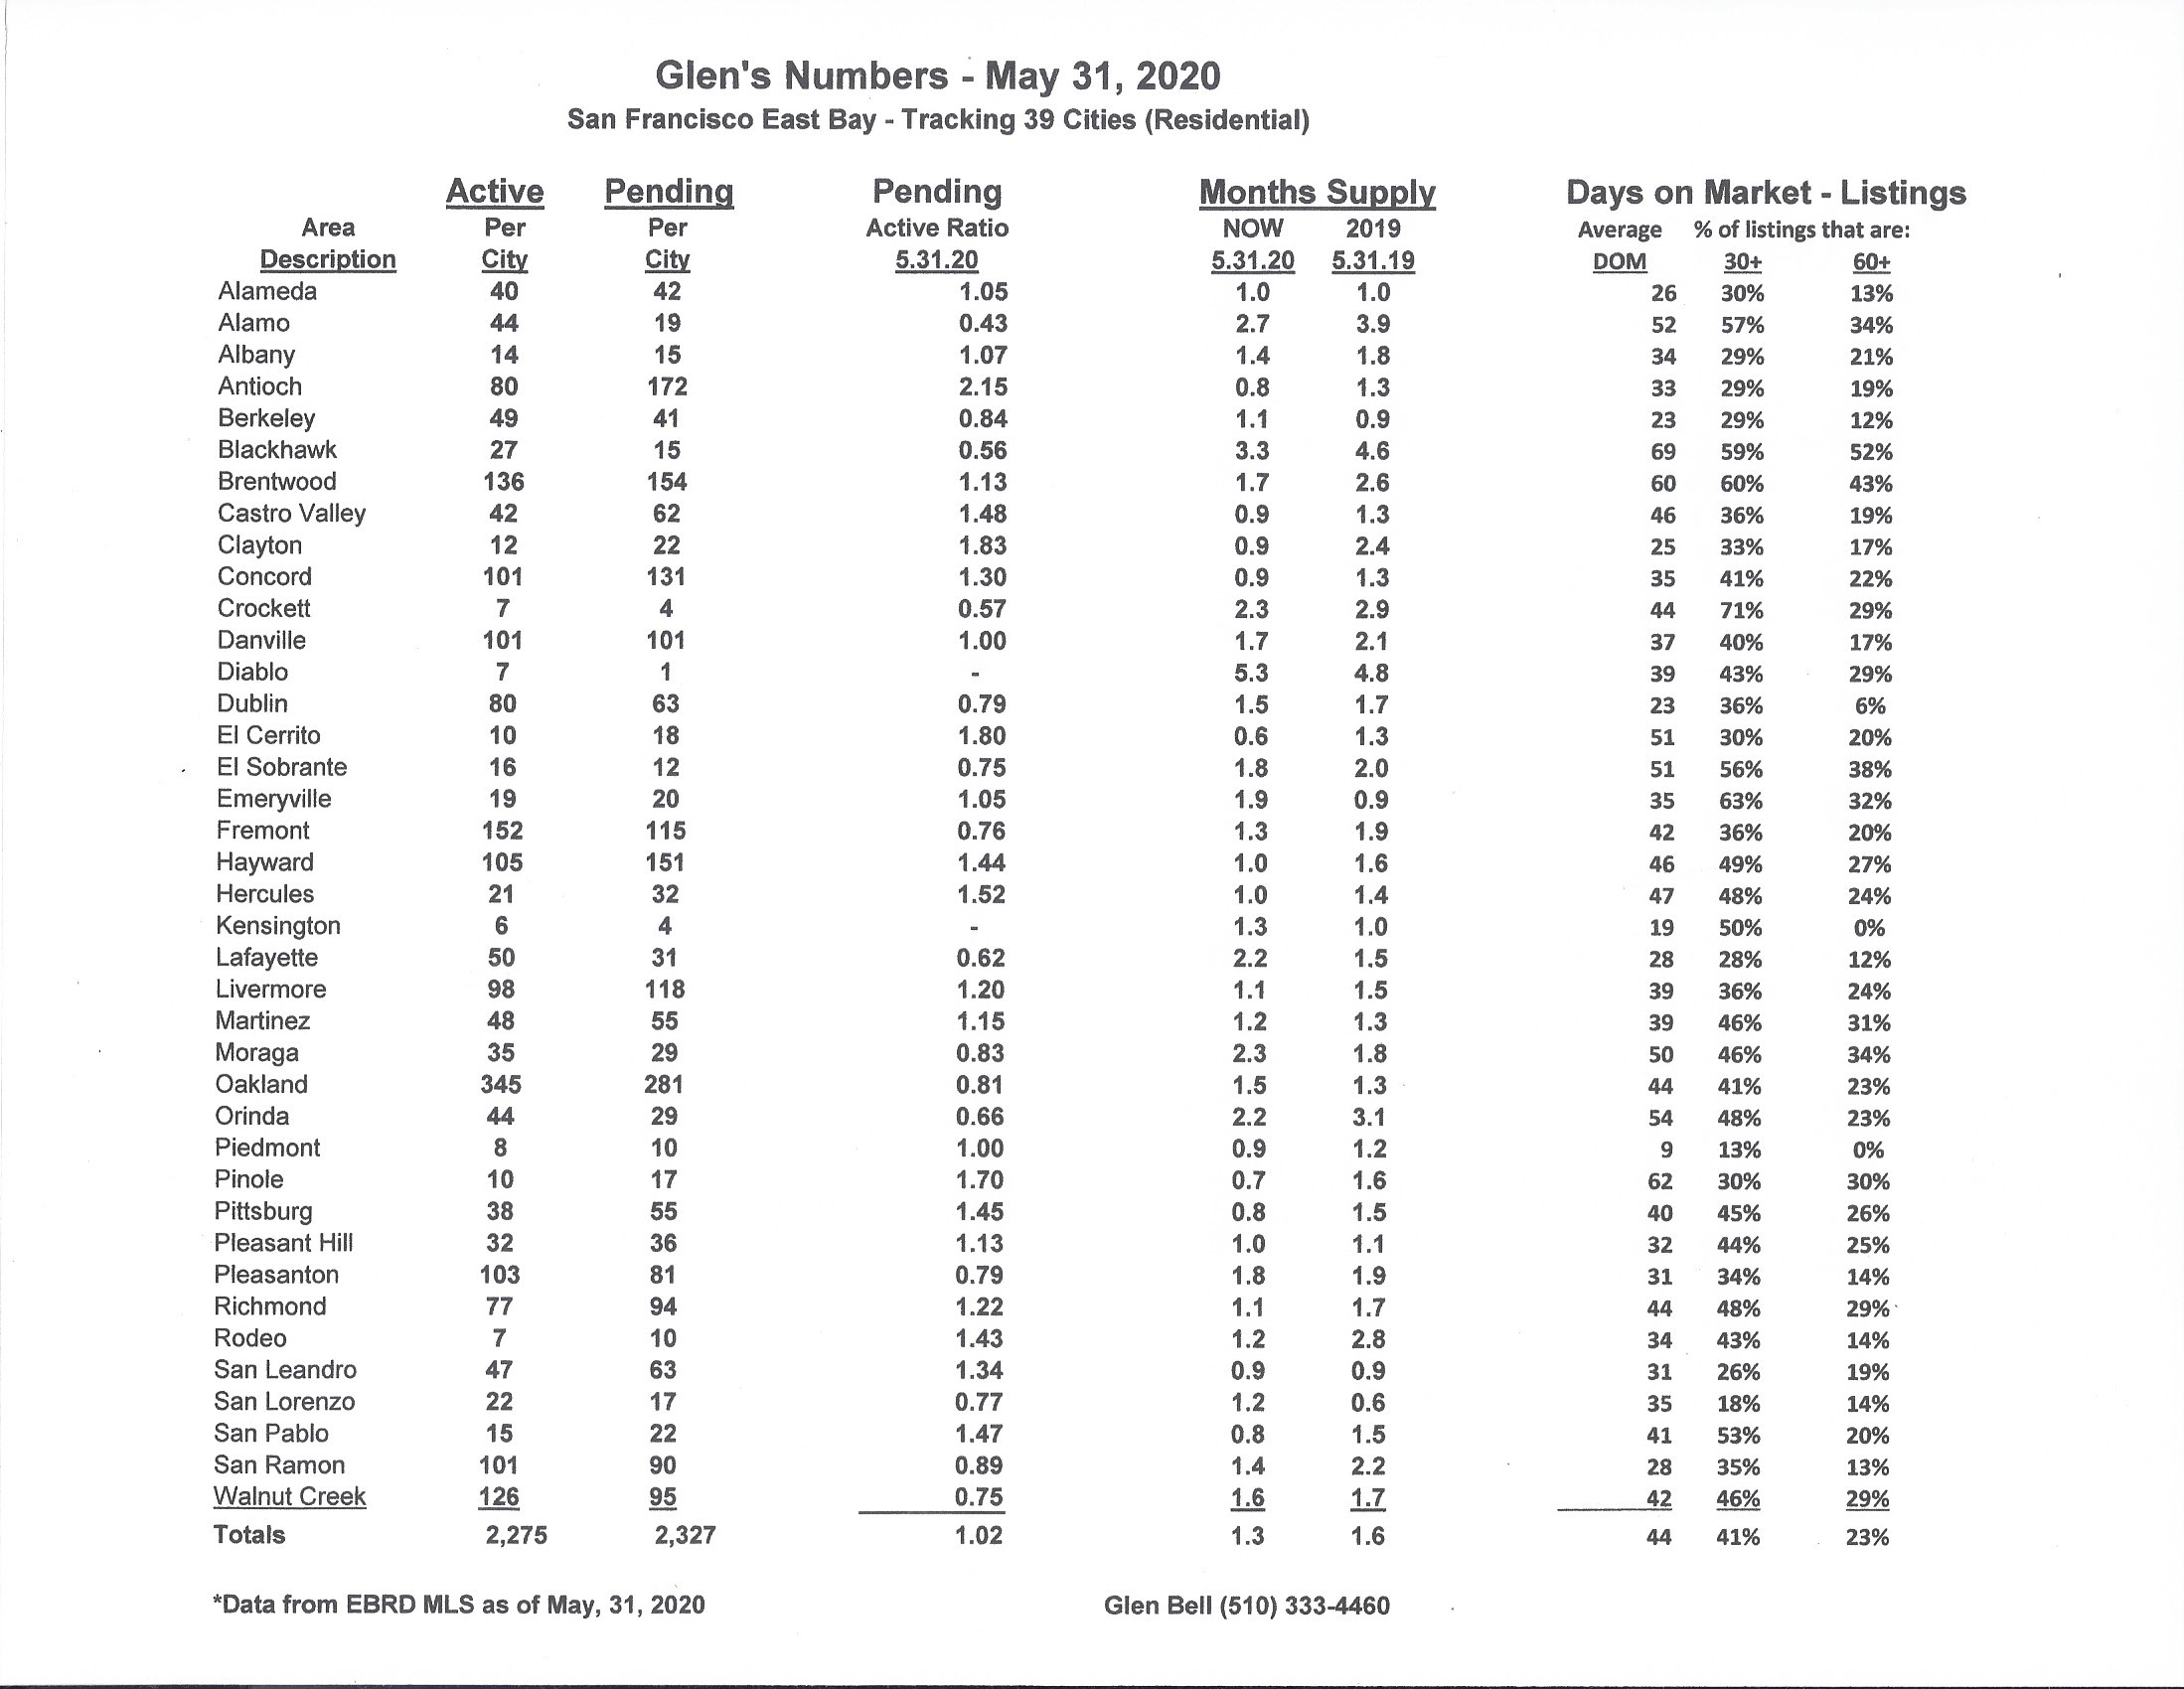
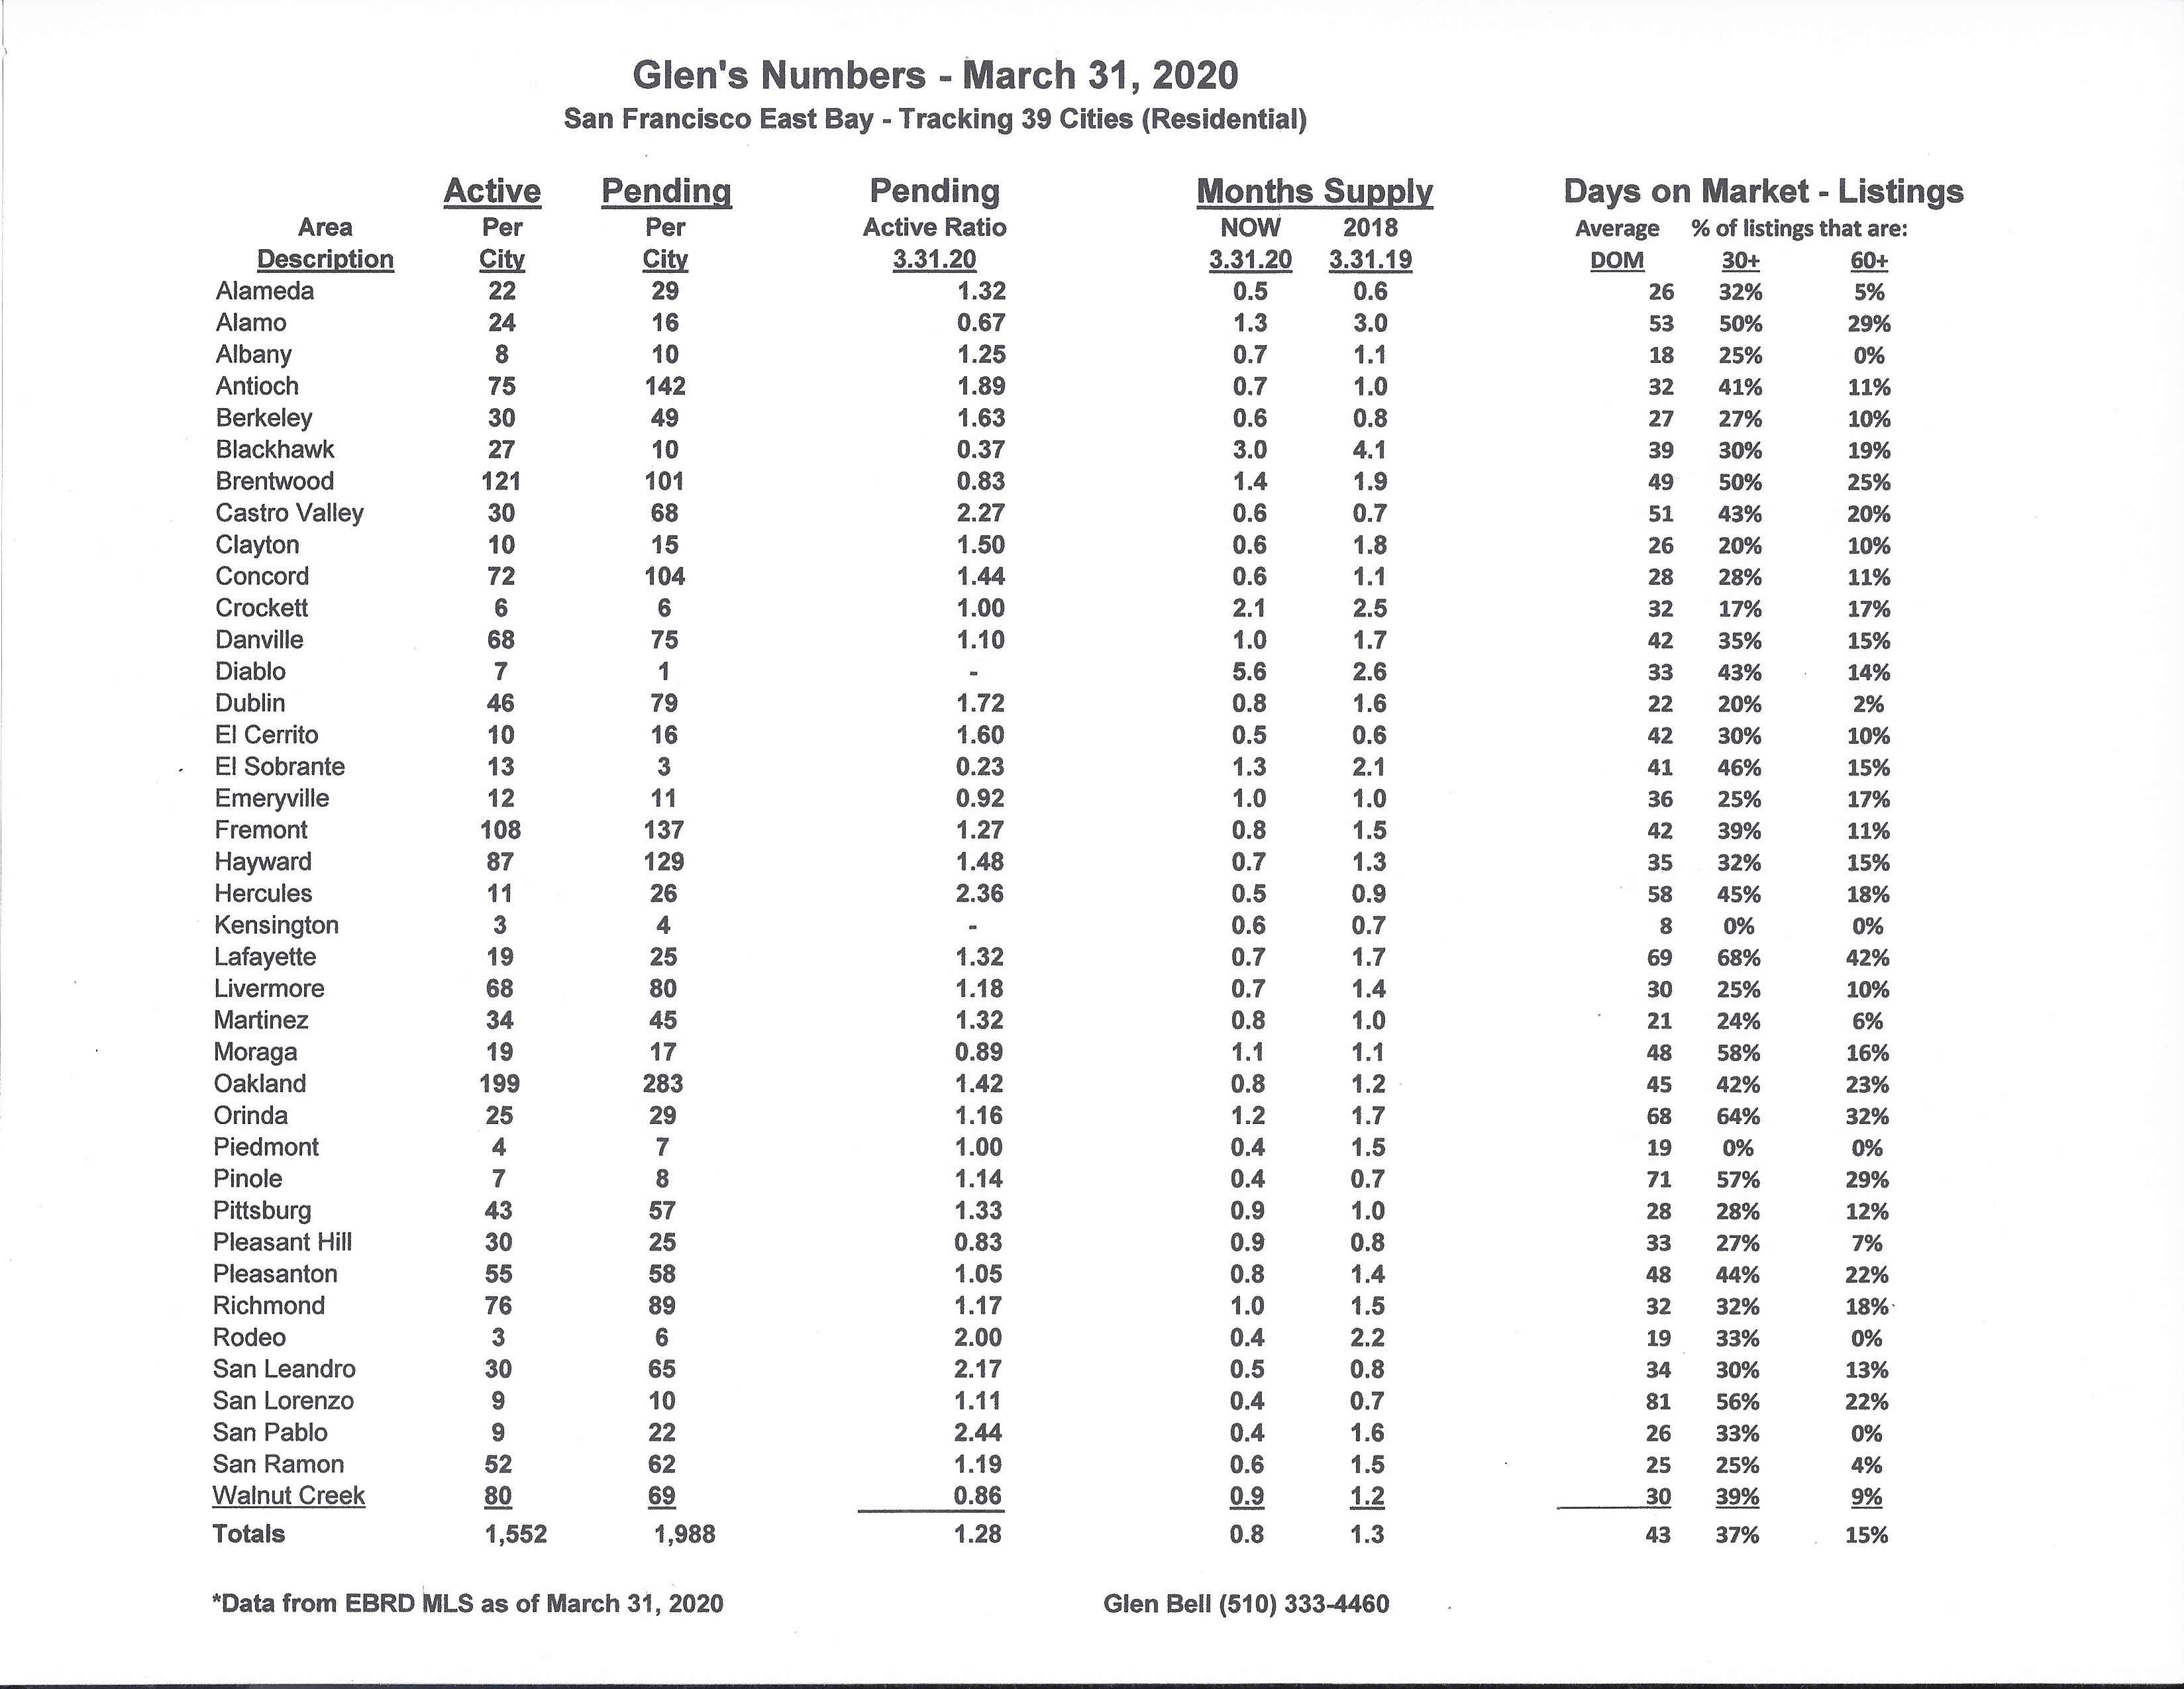
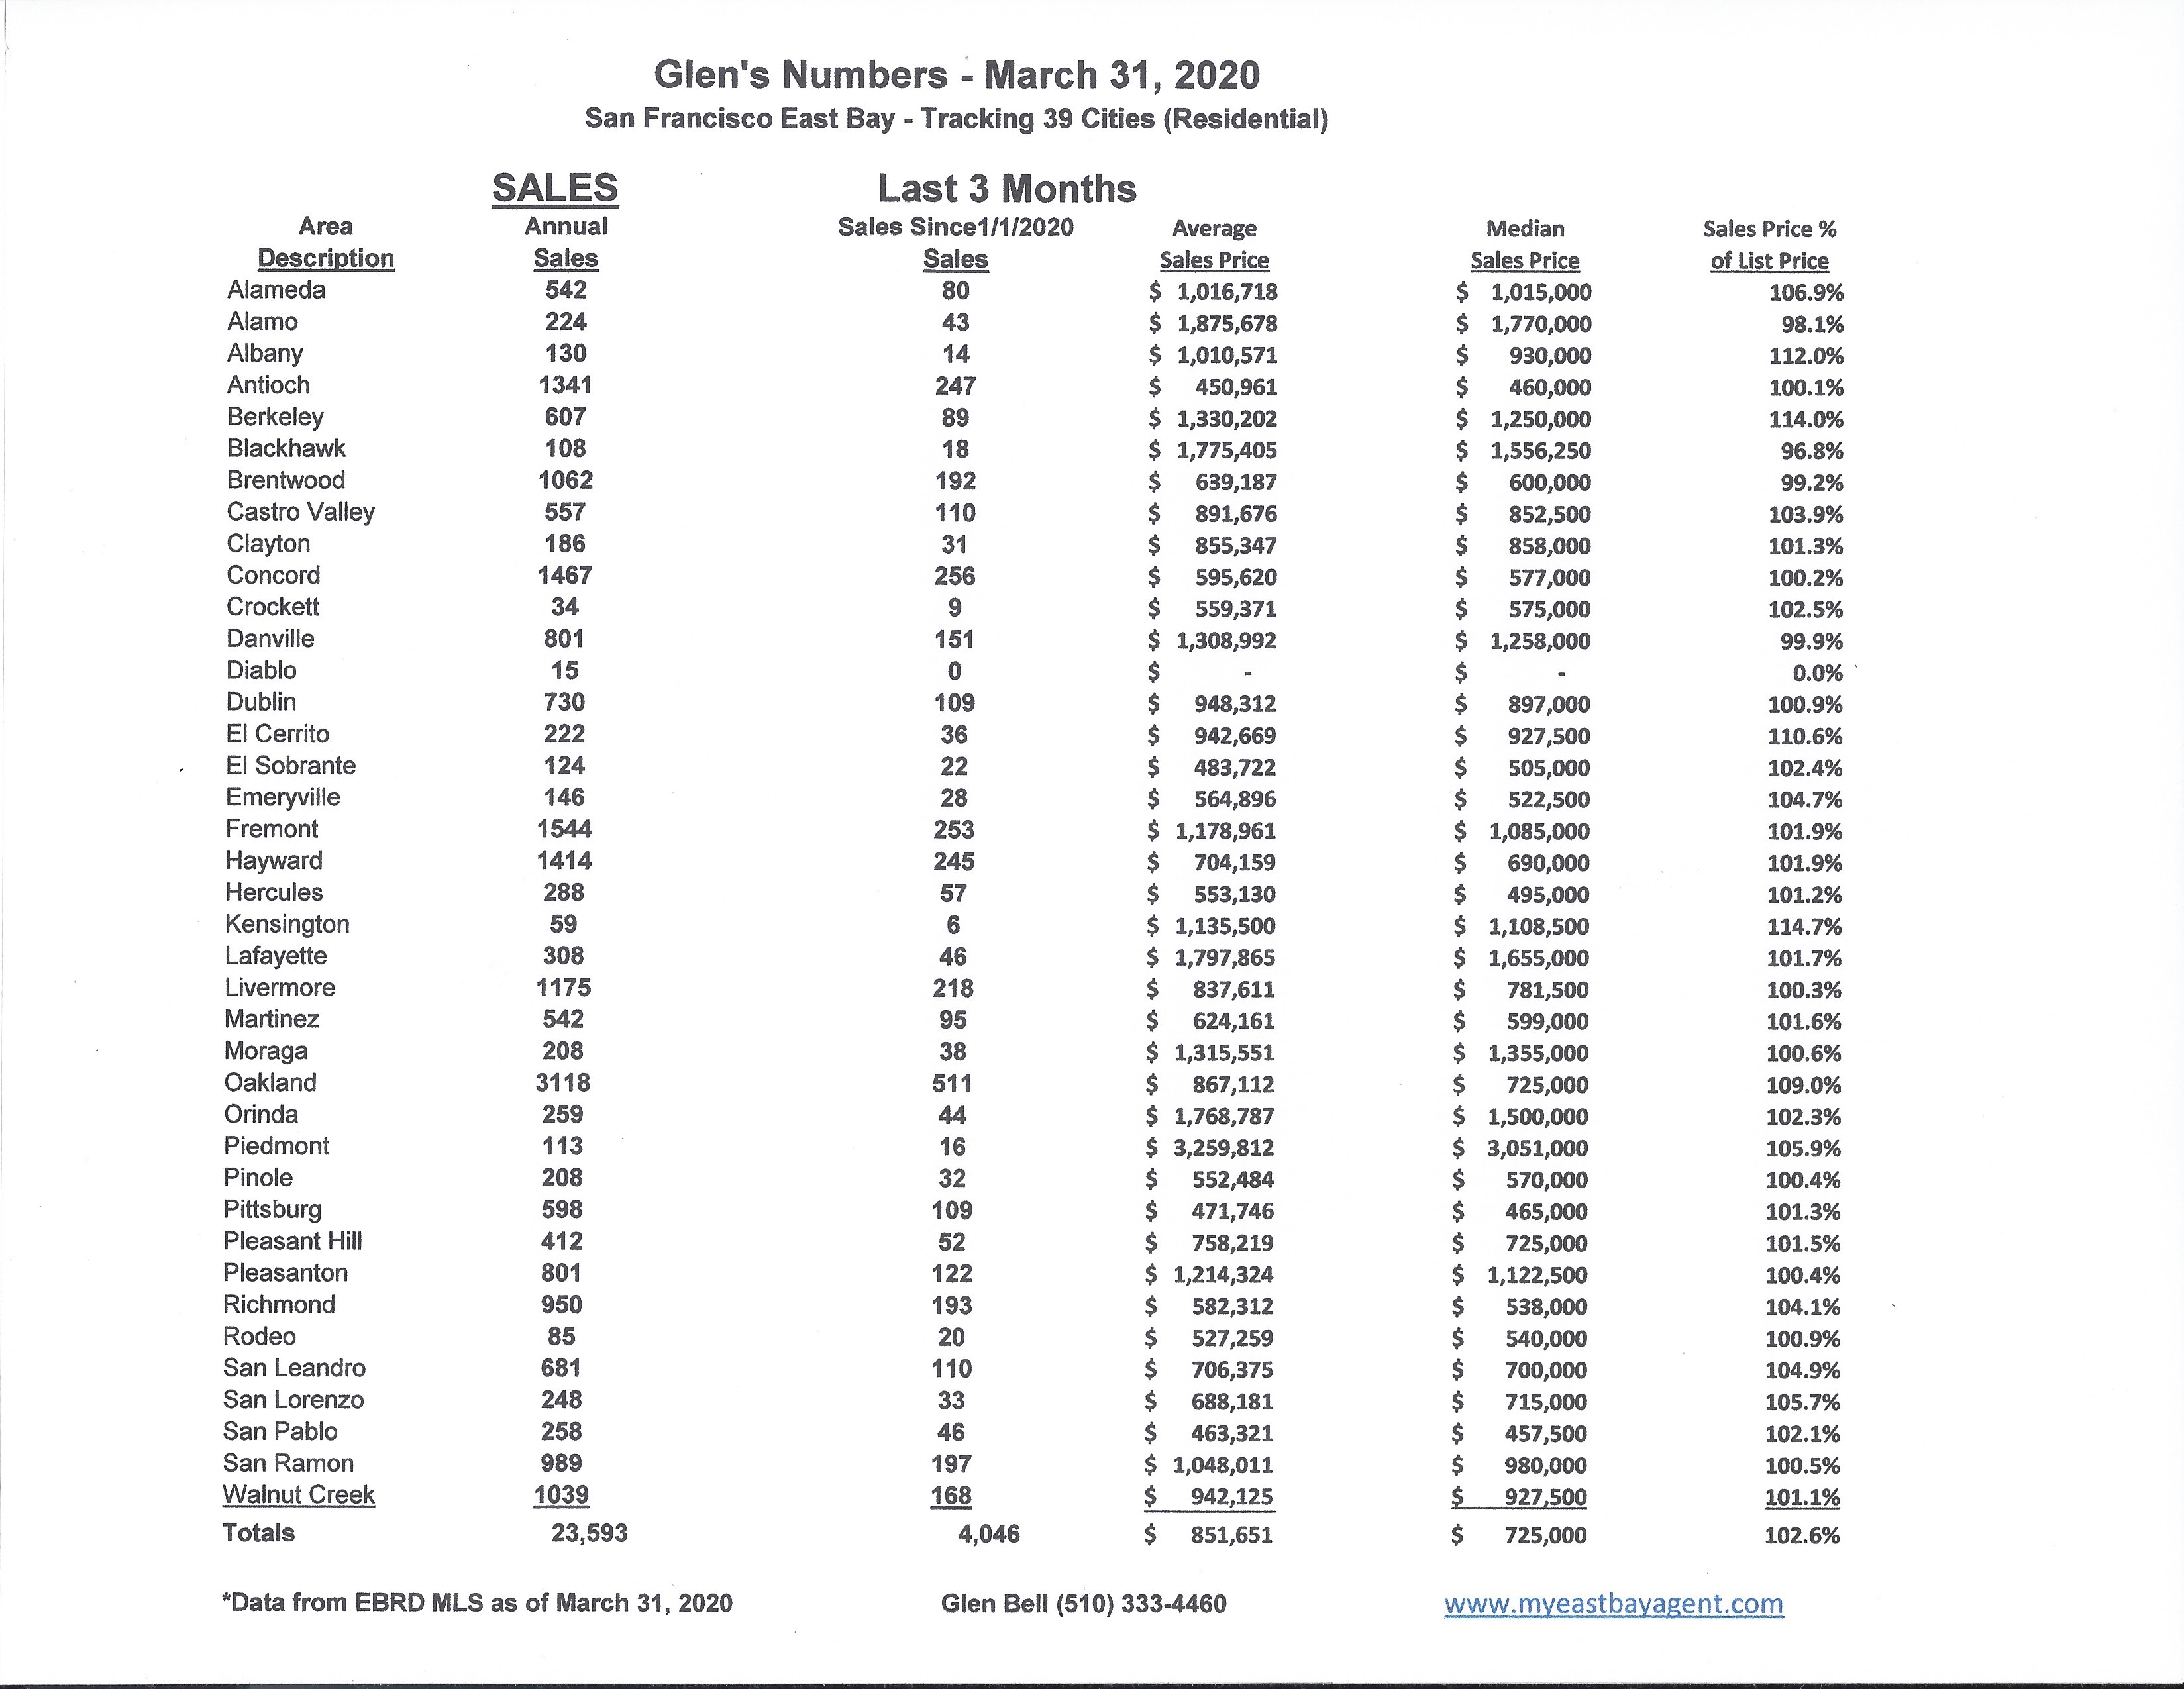
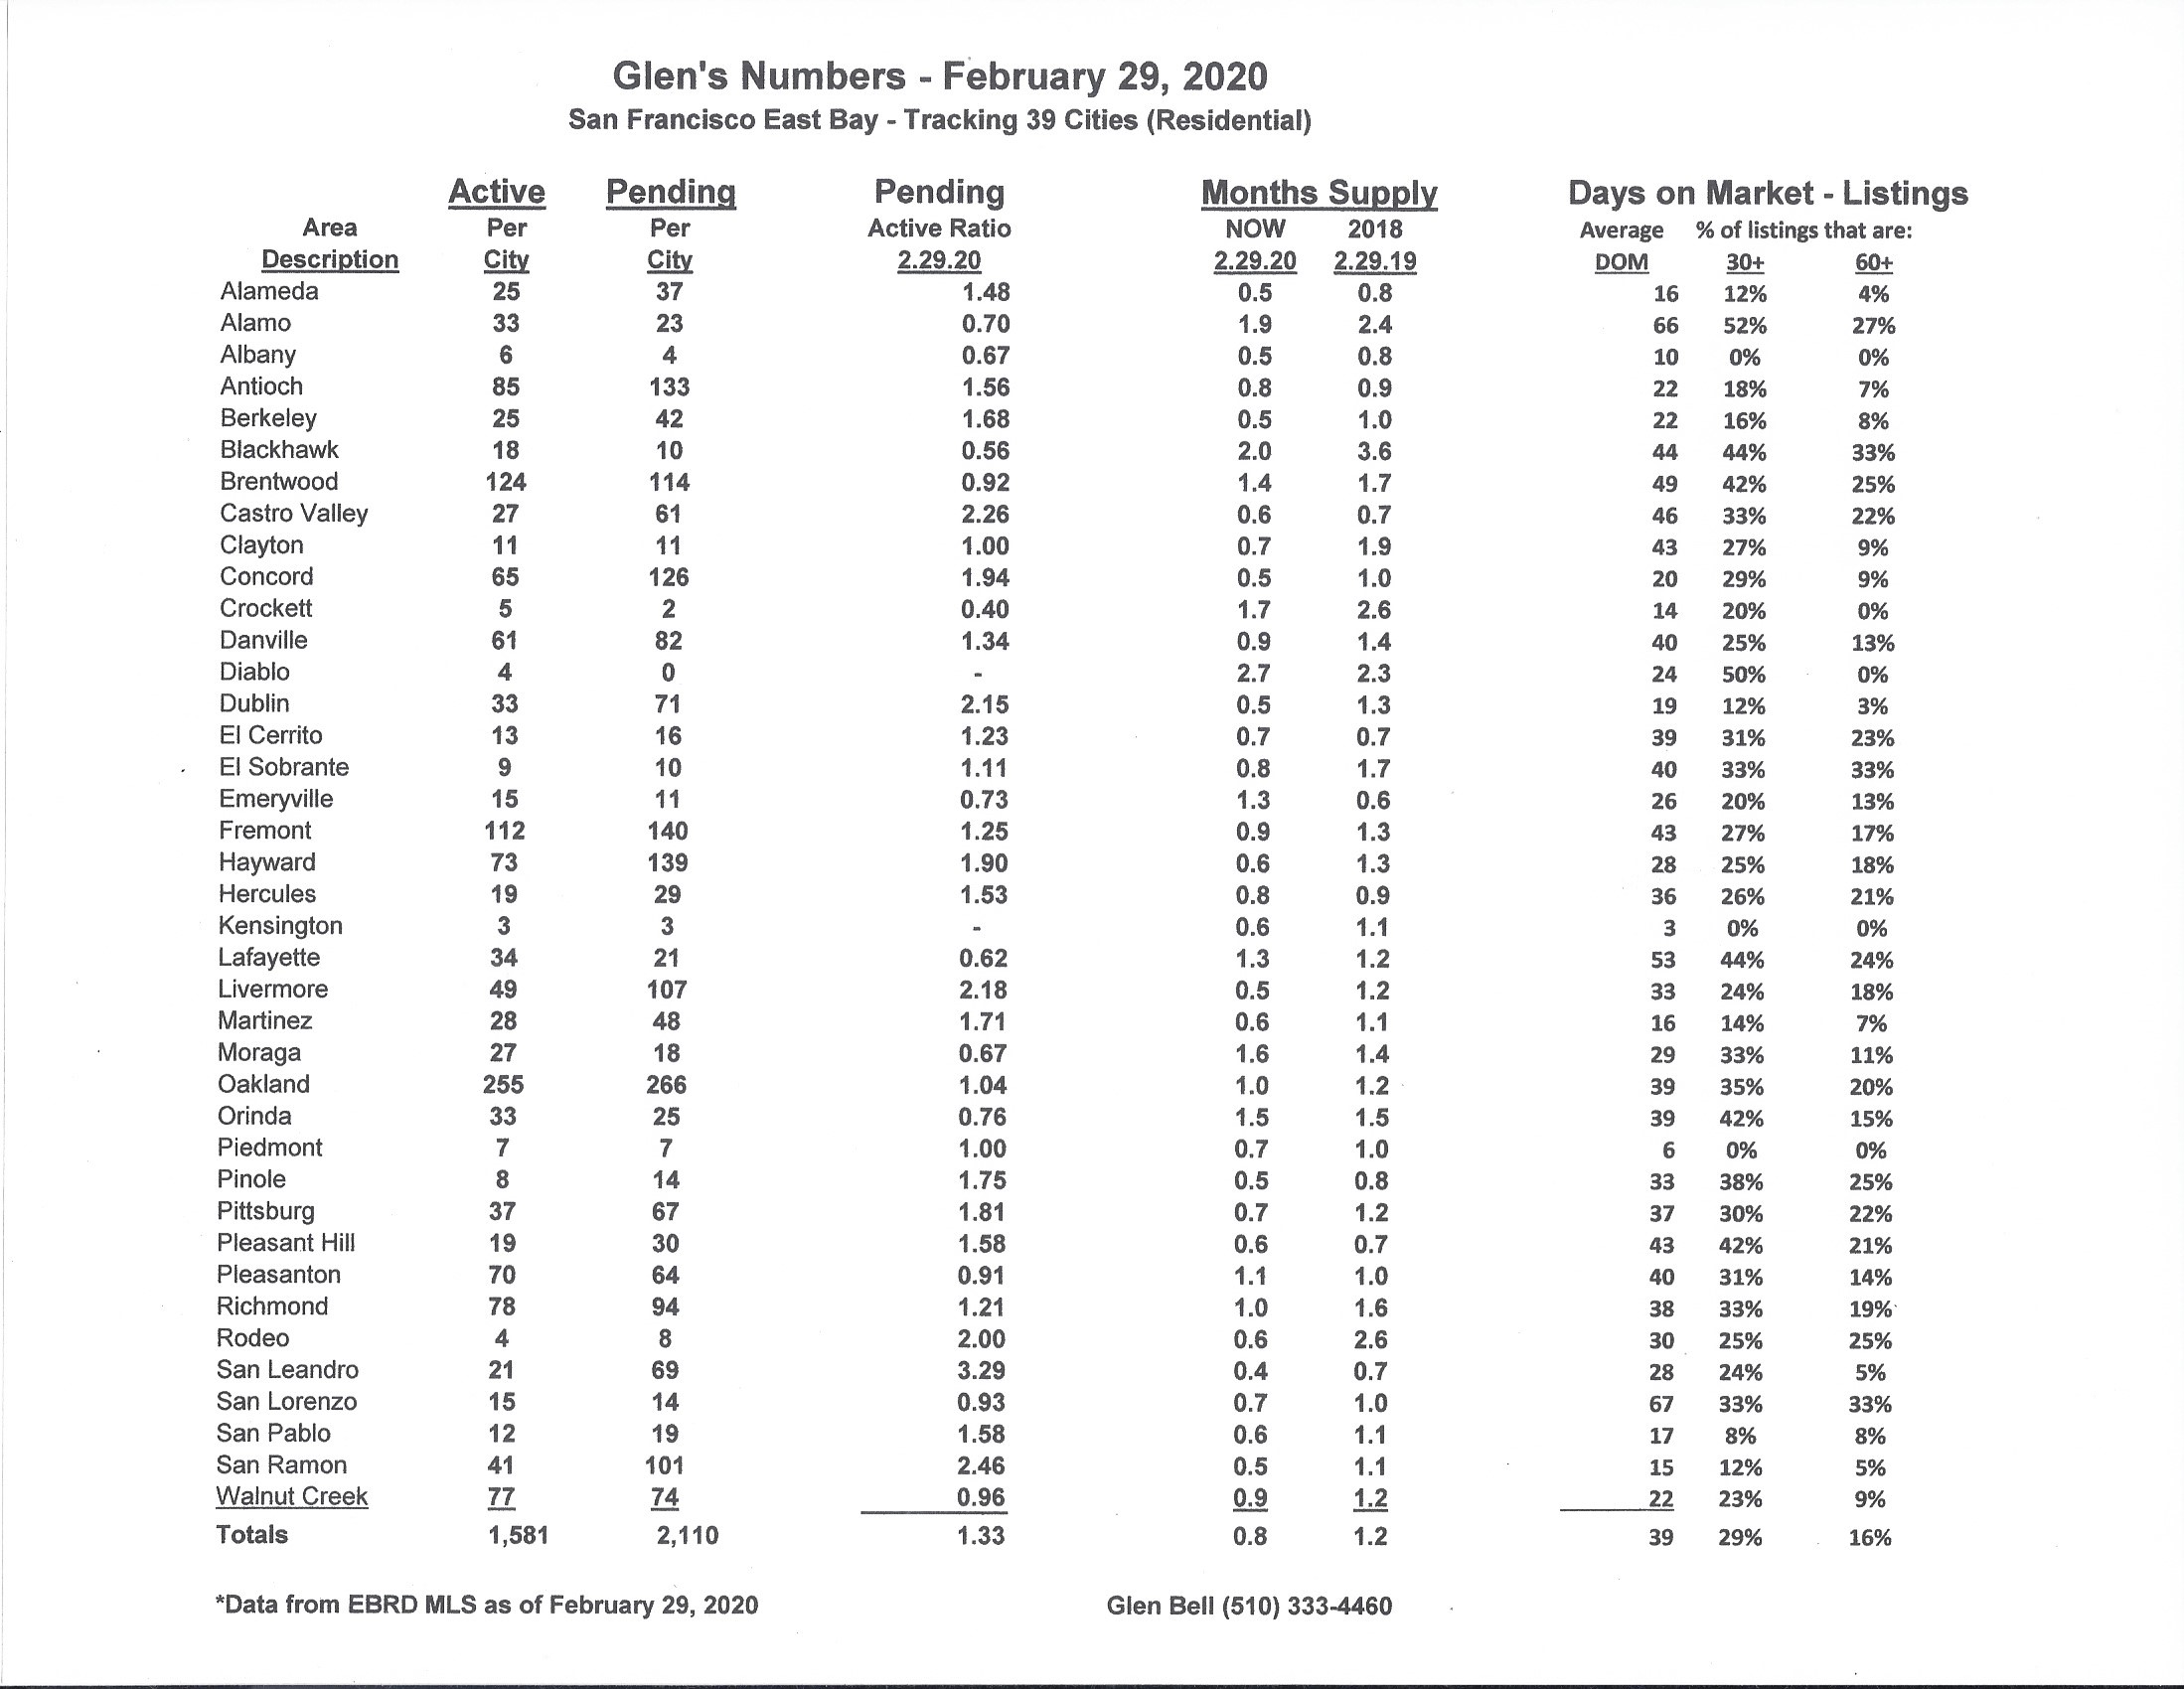
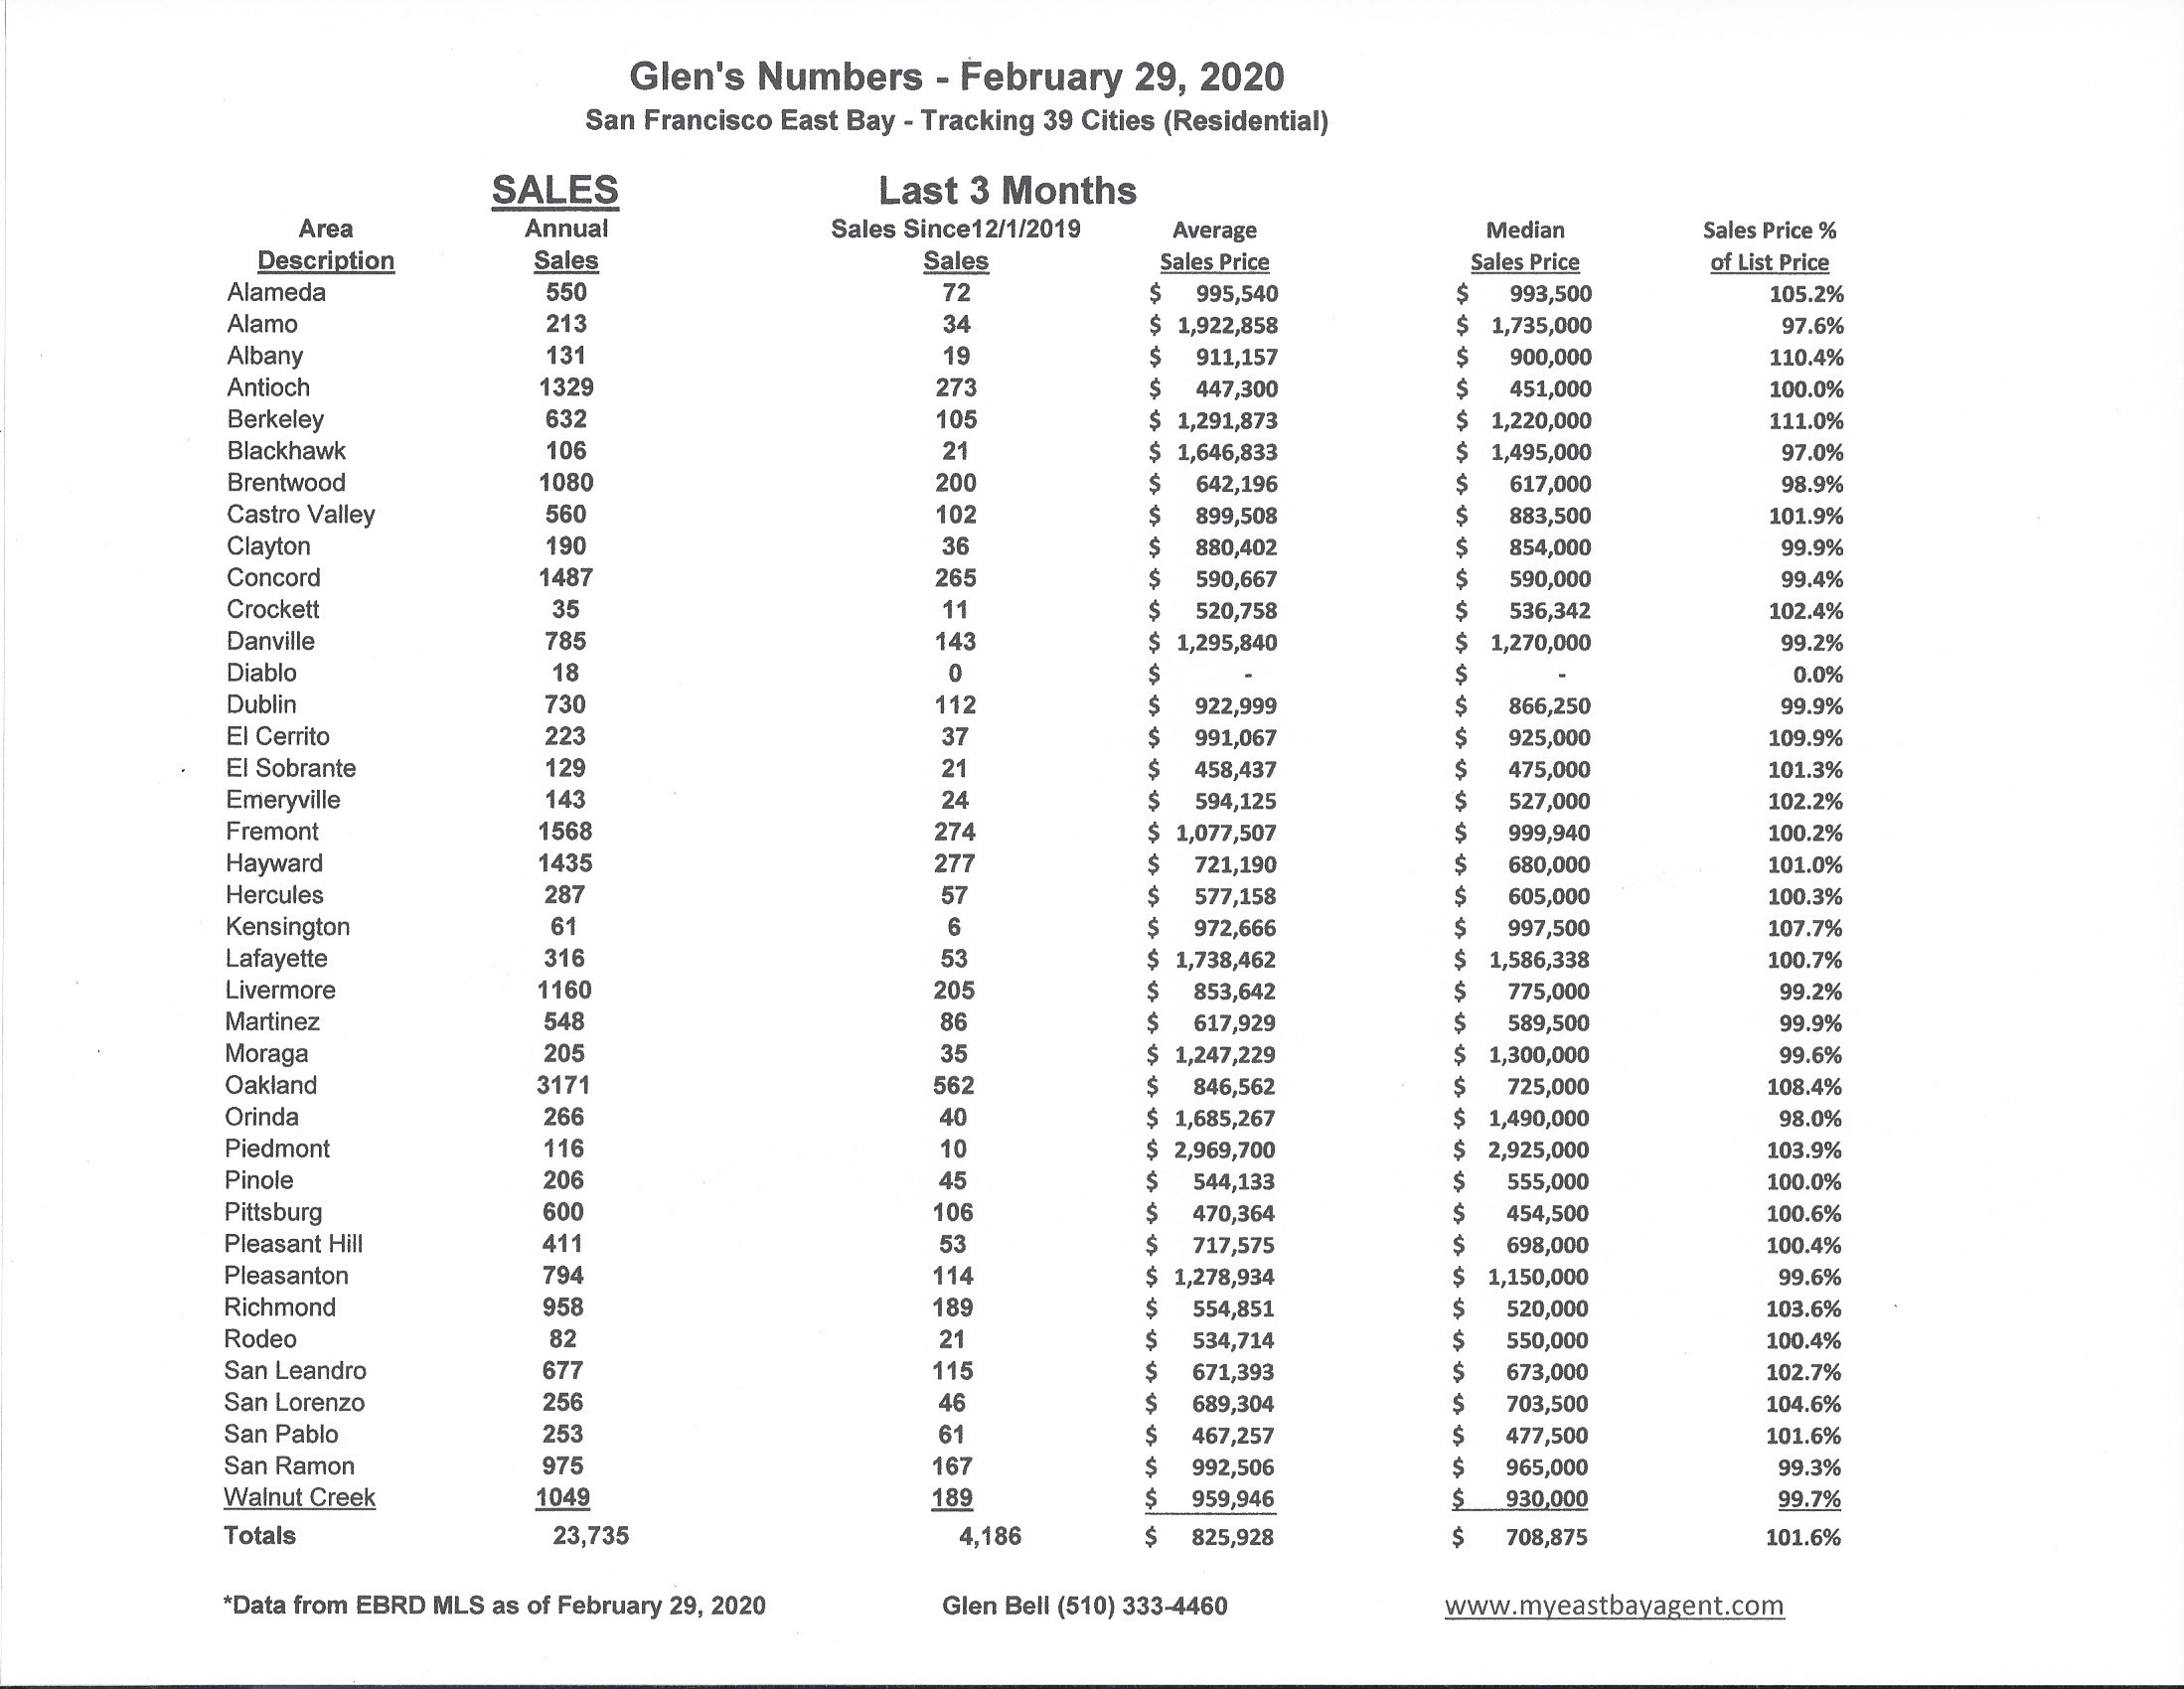
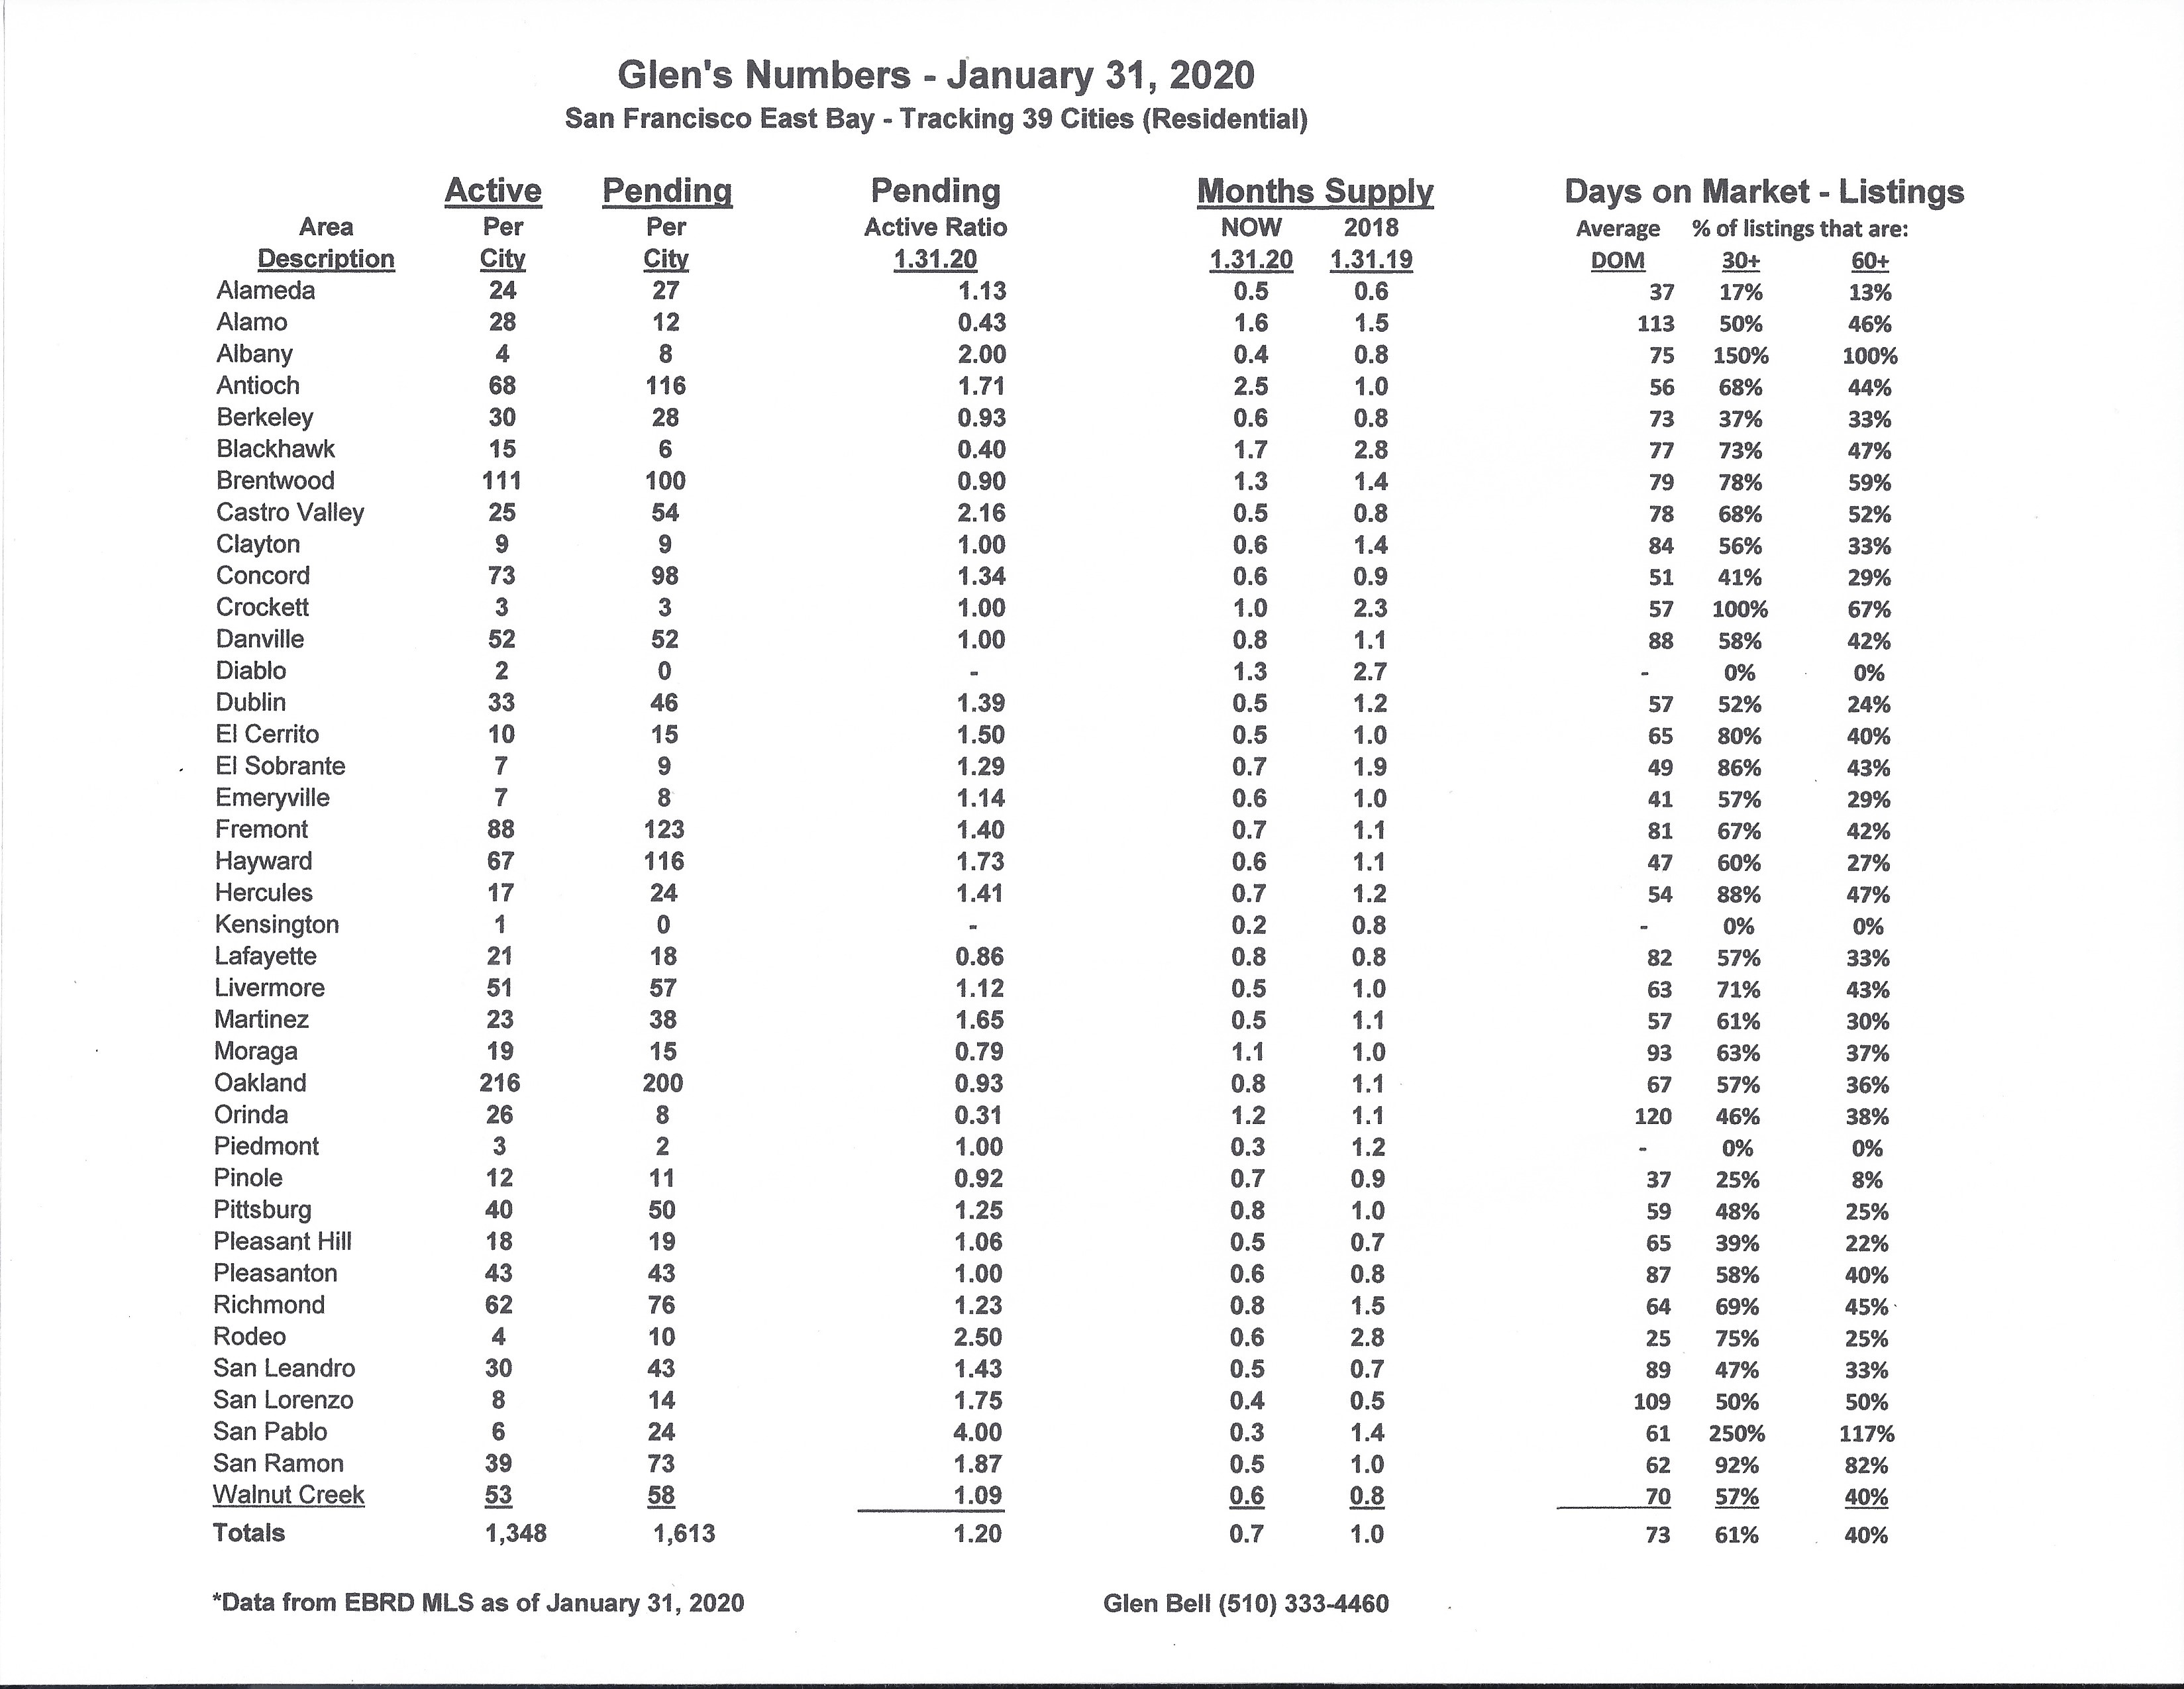
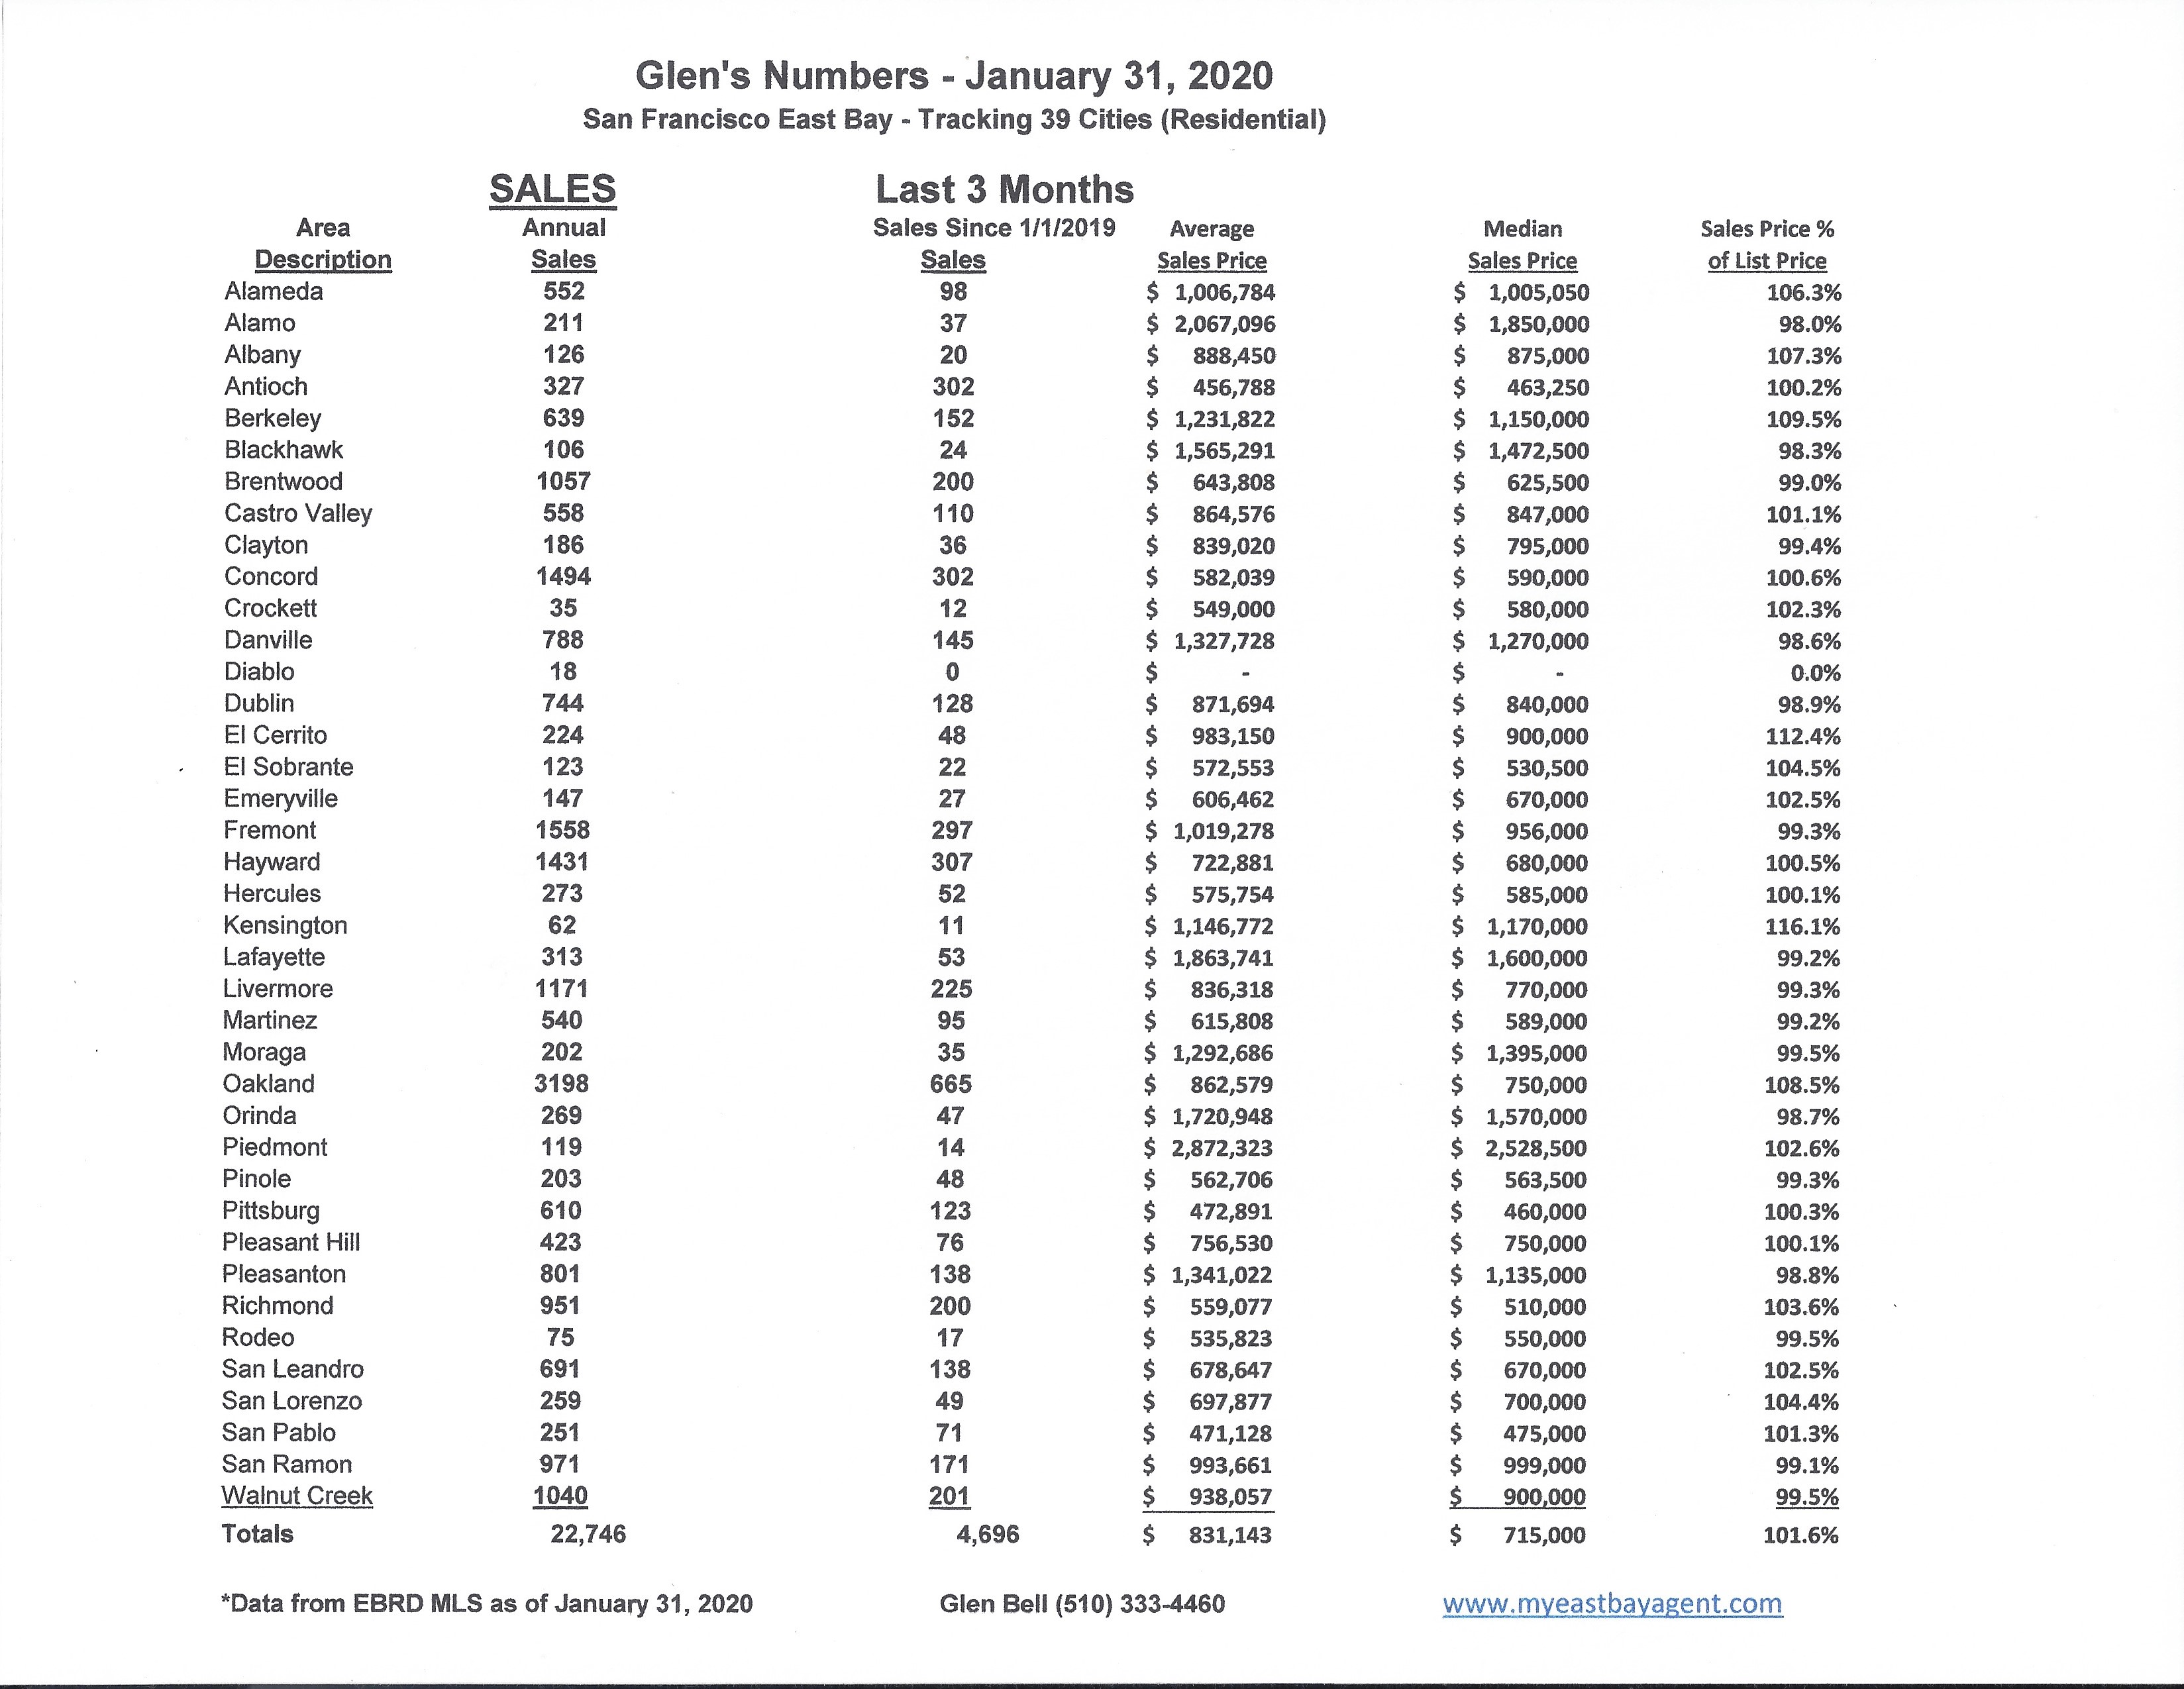
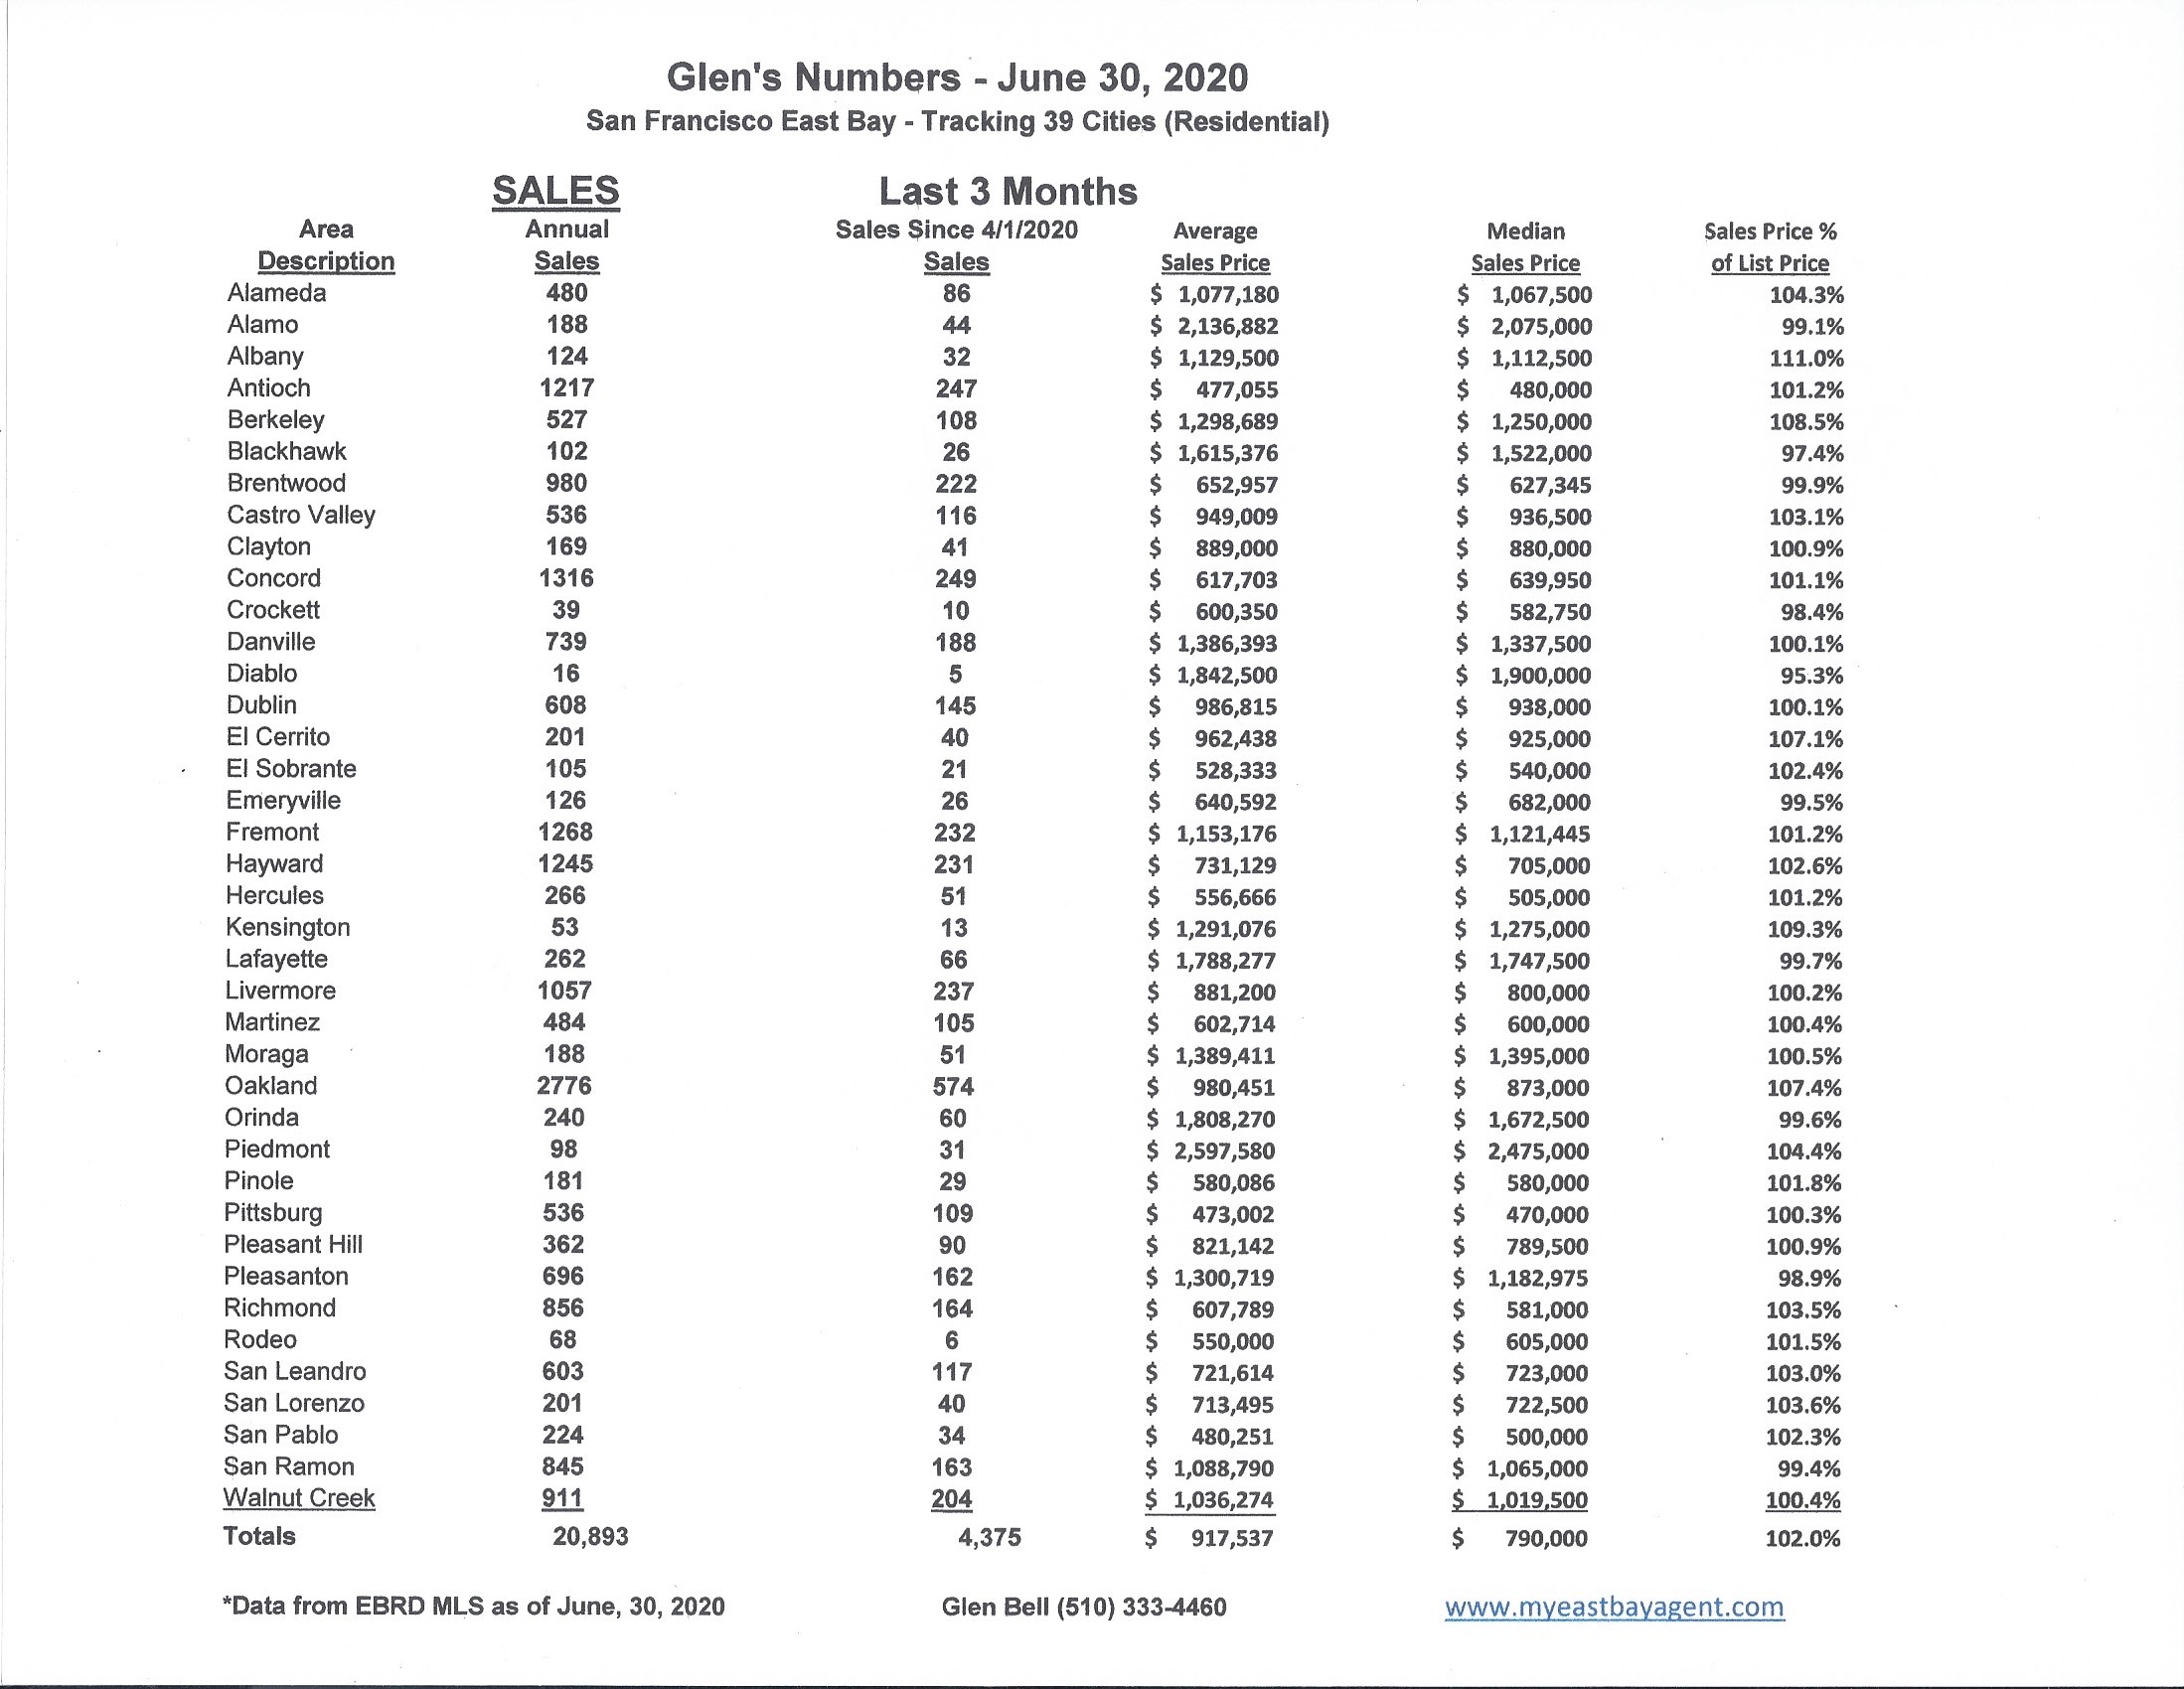
Here are some highlights for the 39 East Bay Cities that I track:
Sales are up slightly from last month, but 38% lower than last year’s numbers. Prices have been up slightly through spring but are now beginning to flatten out during the summer months. More homes seem to be “sitting,” and taking longer to sell. We’re seeing more price reductions with more transactions falling out.
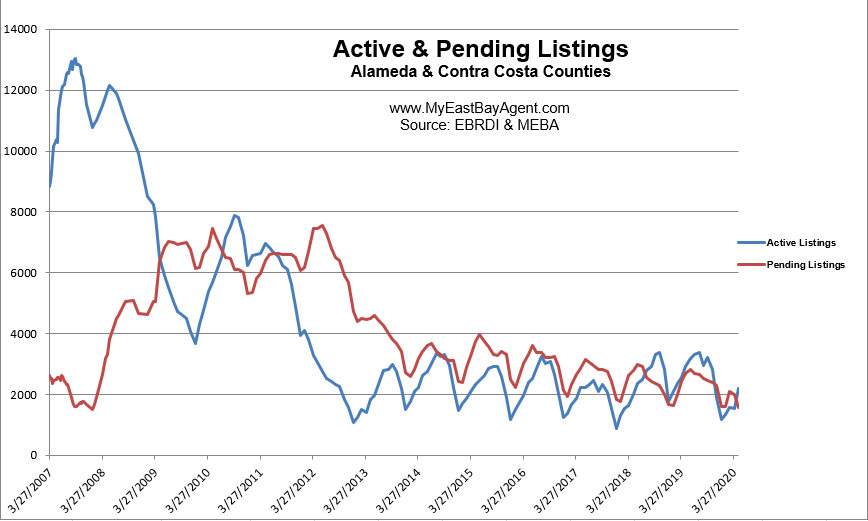
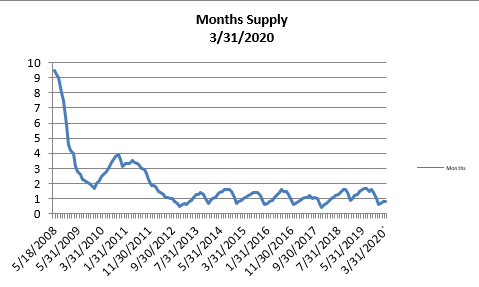
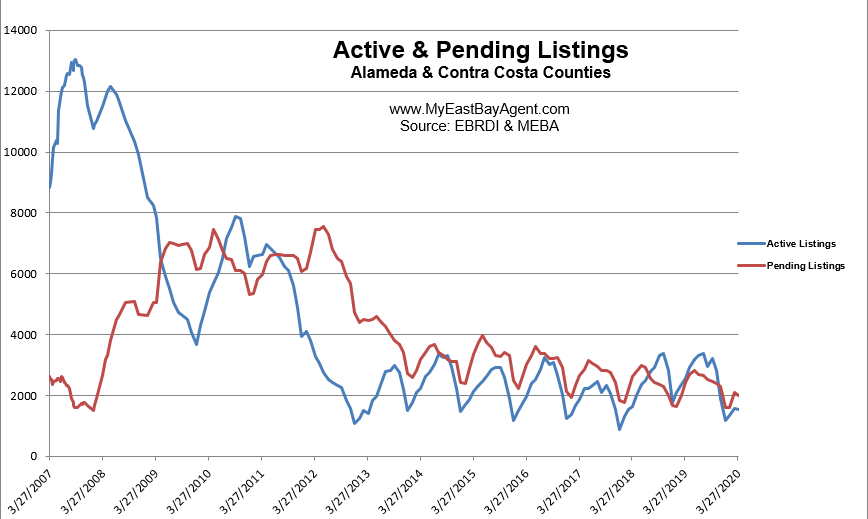
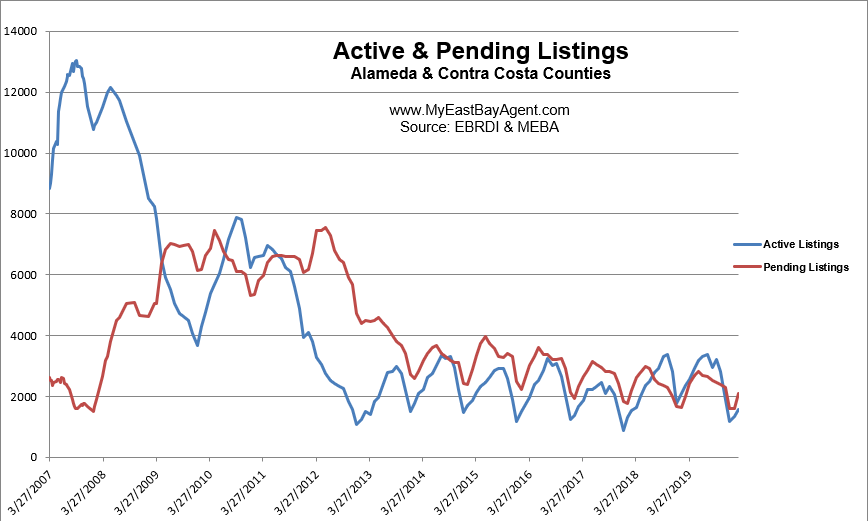
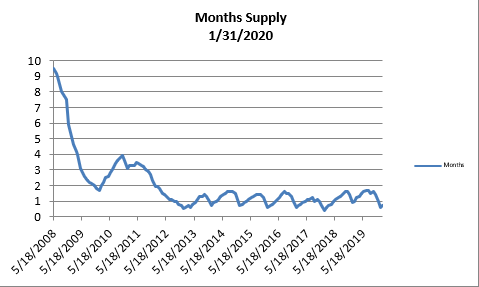
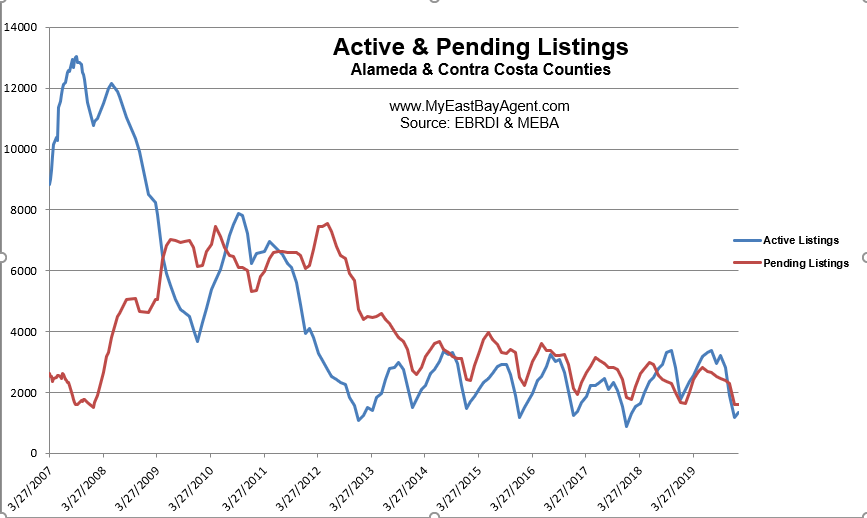
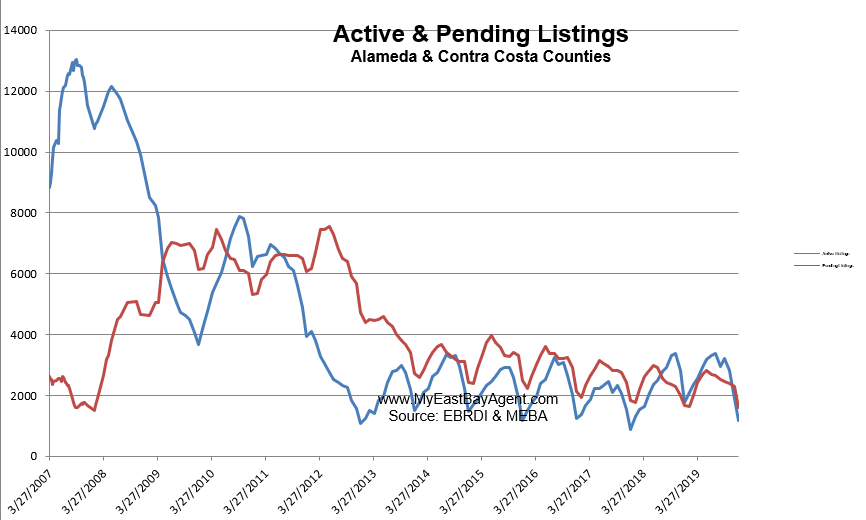
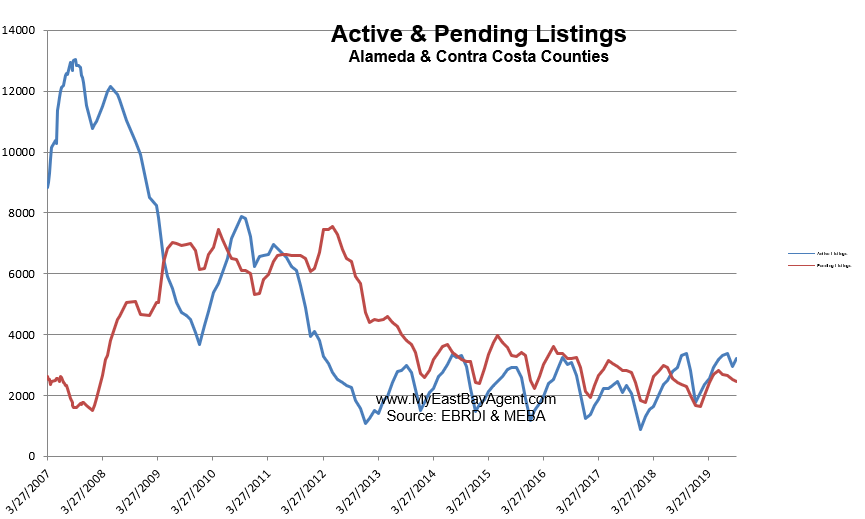
The seasonal drop in inventory followed our normal pattern during the holidays. We watched the number of homes decrease by nearly 60% over November and December. Last year was somewhat unusual because we saw a late season start and early season end. Inventory at the end of December was at its’ 2nd lowest level since I began tracking these 39 cities in 2006, with only 1163 homes for sale at the end of December. Our expectations normally are that new home listings begin to appear on the market as early as mid-January with a steady increase of inventory every month through to September, traditionally our high point.
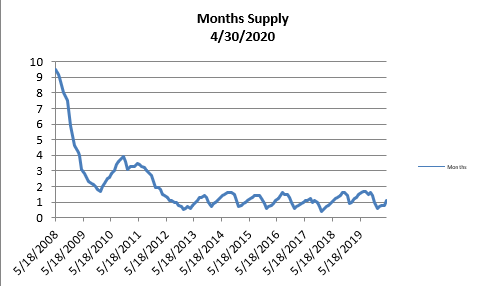
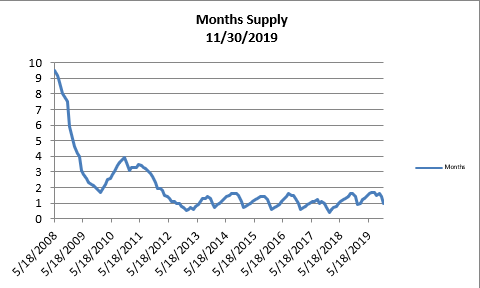
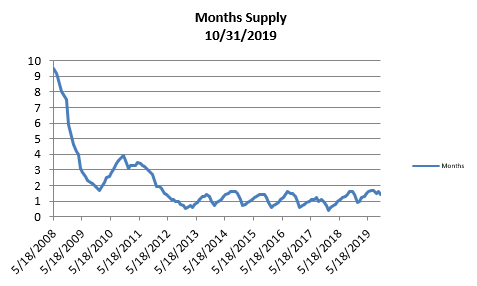
Inventory decreased slightly in June by 4%. This was unexpected. We normally expect to see more than that in June, typically one of our strongest selling m0nths of the year. That’s 34.2% lower than what we saw last year at this time. This represents a 39 day supply of homes, compared to a 51 day supply last year at the end of June. This is the lowest I’ve seen for a June since I started tracking numbers in 2008. The number of pendings improved by a 23.7% compared to May, a good sign that we still have buyers. We’re also 7.4% higher when compared to last year at this time.
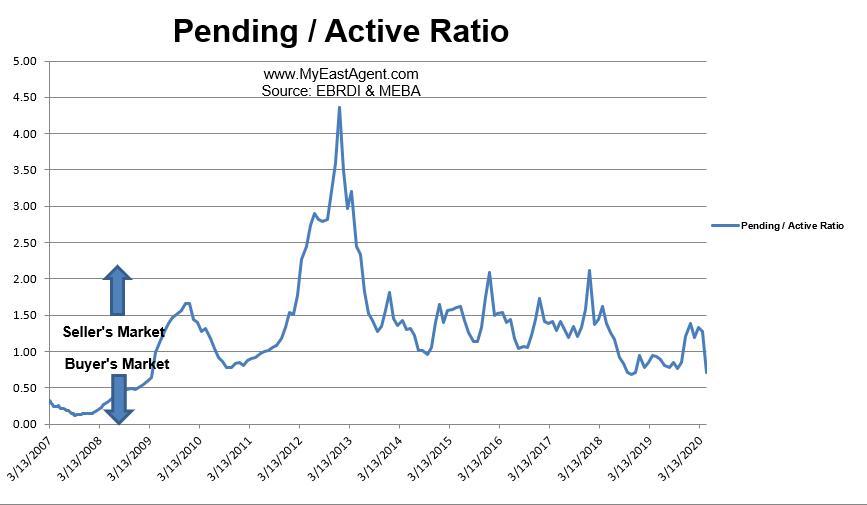
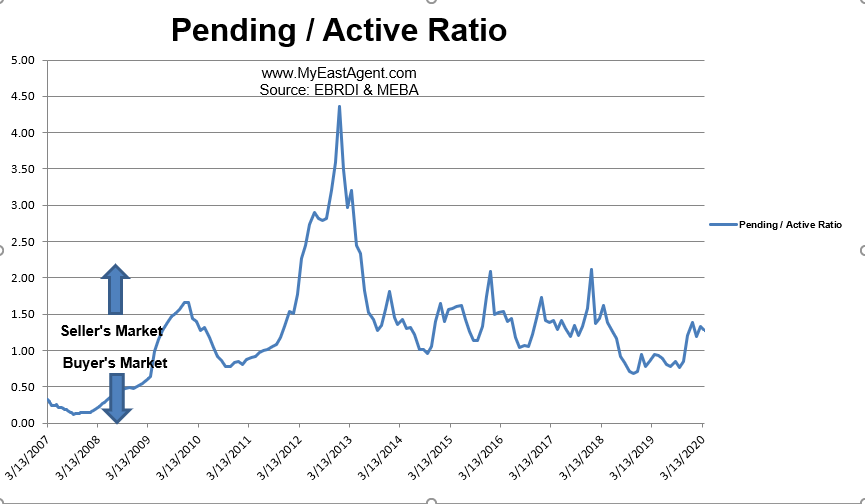
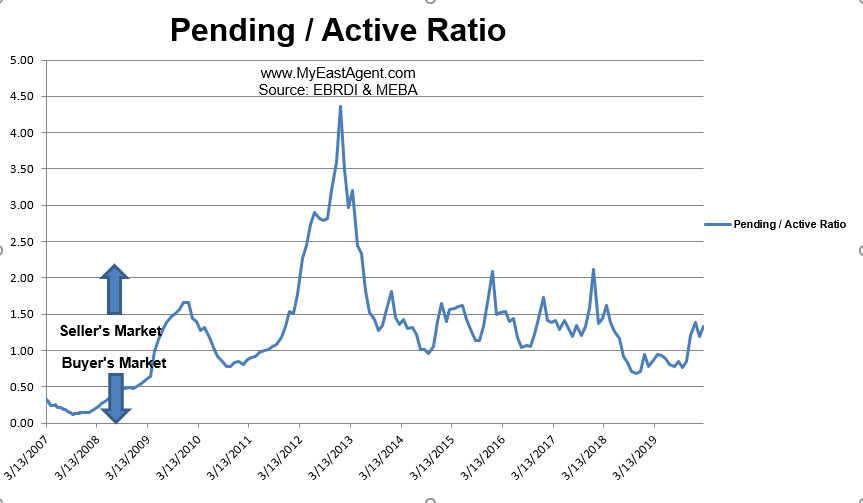
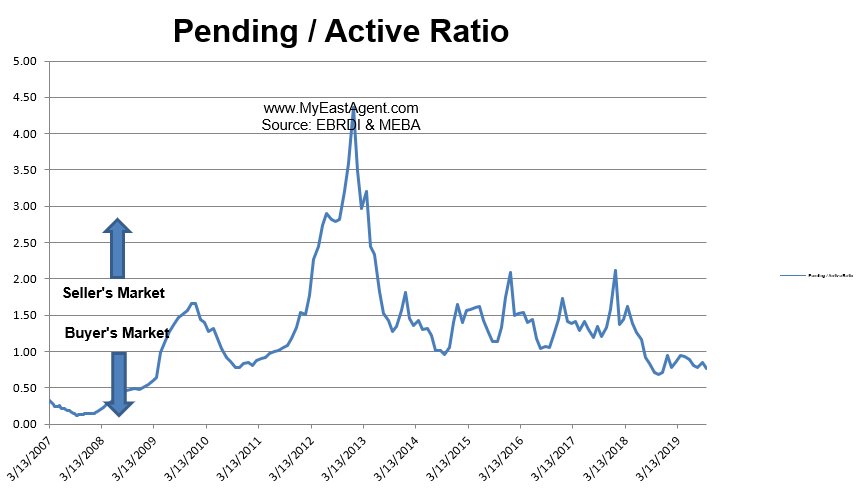
The pending/active ratio continued to move upwards, crossing more into a sellers market similar to what we saw at the beginning of the year. This is much higher when compared to last years’ number of .81. We were at 1.02 last month. The pending/active ratio has been a benchmark that we’ve used as a measure of supply and demand to determine whether we’re in a buyer’s or a seller’s market. Typically, a number well above 1, (less inventory with more pendings) favors sellers. A number below 1 favors buyers..
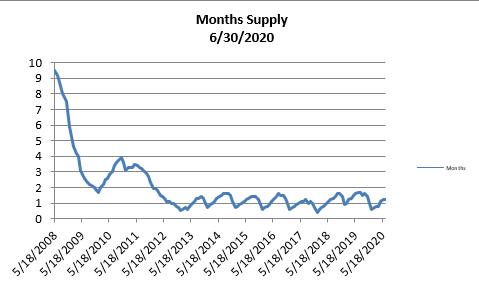
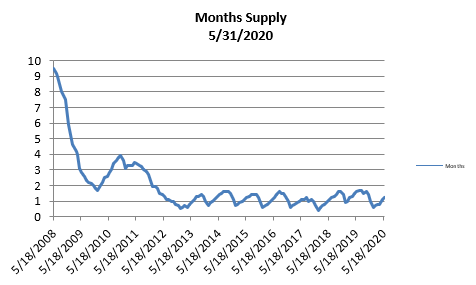
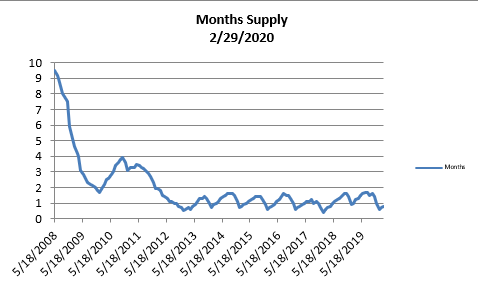
- The month’s supply for the combined 39 city area is 39 days. Historically, a 2 to 3 months’ supply is considered normal in the San Francisco East Bay Area. As you can see from the graph above, this is normally a repetitive pattern over the past four years. Supply is less when compared to last year at this time, of 51 days.
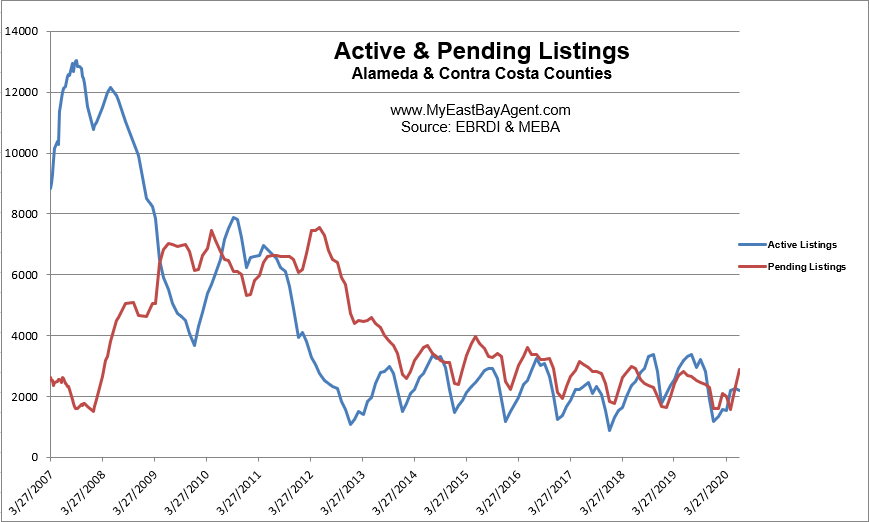
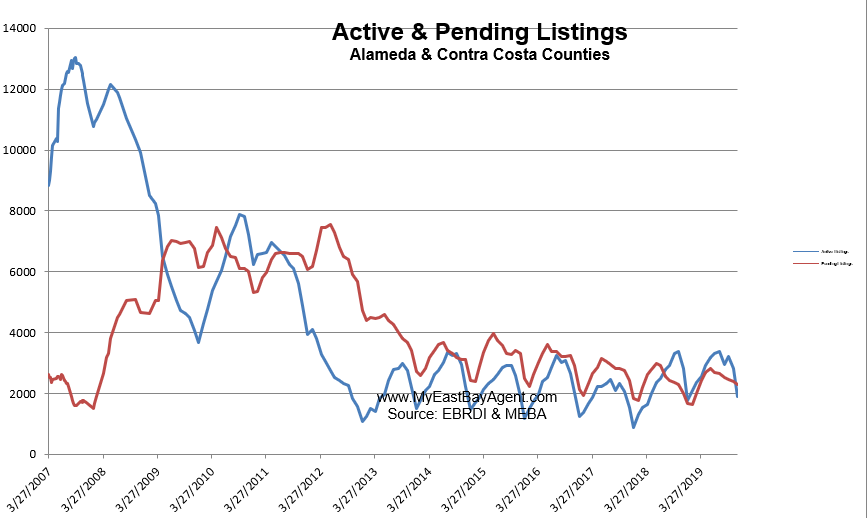
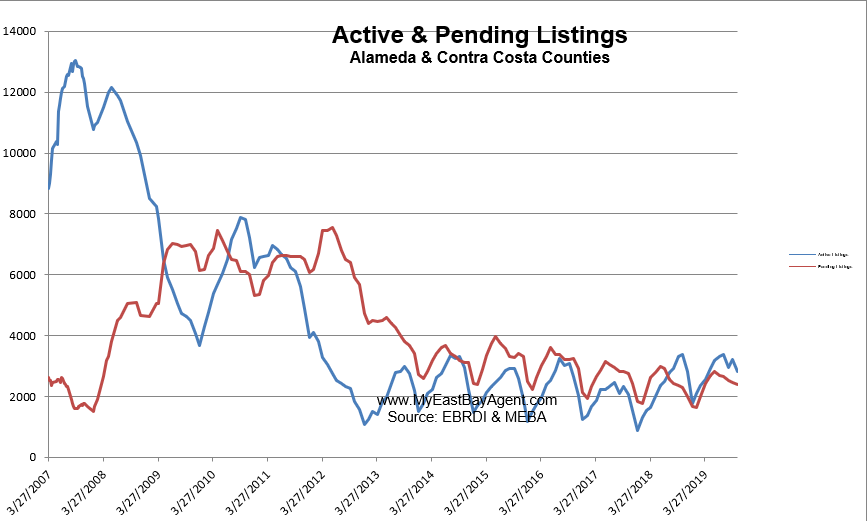
- Our inventory for the East Bay (the 39 cities tracked) is now at 2,185 homes actively for sale. This is fewer than what we saw last year at this time, of3,317. We’re used to seeing between 3,000 and 6,000 homes in a “normal” market in the San Francisco East Bay Area. Pending sales increased to 2,878, higher than what we saw last year at this time of 2,679.
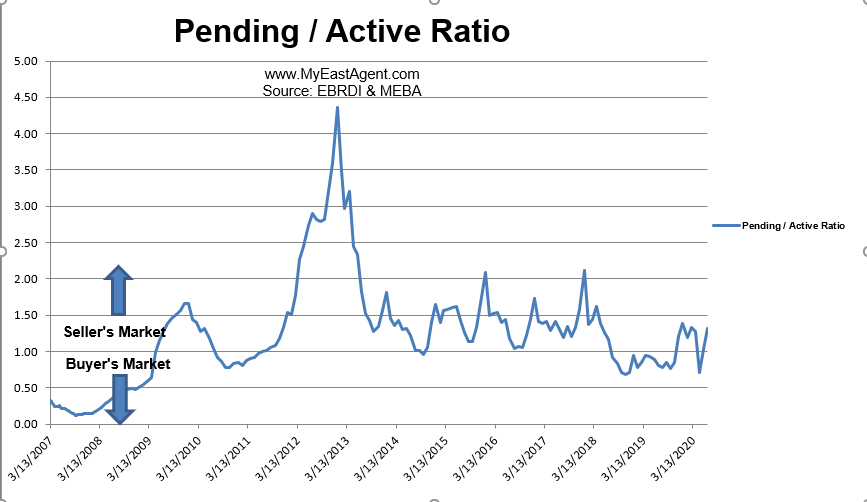
- Our Pending/Active Ratio is 1.32. Last year at this time it was .81.
- Sales over the last 3 months, on average, are 2% over the asking price for this area, lower than what we saw last year at this time, of 3.4%.

Recent News
Stunning rebound: Bay Area home sales surged nearly 70% from May to June; prices rose 3.6%
By Katheen Pender, SF Chronicle, June 16, 2020
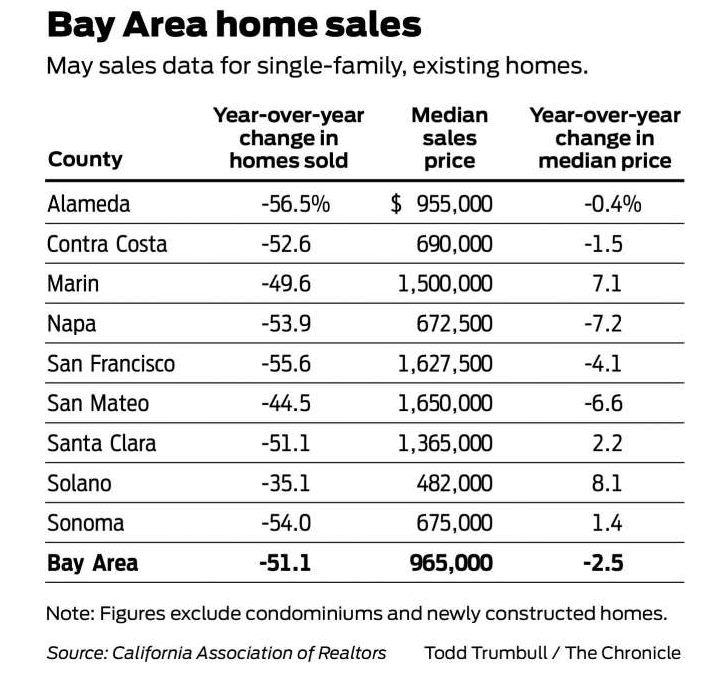
The Bay Area home market saw an enormous resurgence in sales and a modest increase in prices from May to June, as pent-up demand and record-low interest rates collided with sparse inventory, according to a California Association of Realtors report issued Thursday.
Sales of existing, single-family homes rebounded 69.2%, the largest month-to-month sales jump since the association started keeping records for the Bay Area in 1990. Compared to June of last year, sales were down 7.8%. The median price rose to an even $1 million, up 3.6% from May and 4.2% higher year over year.
Because deals typically take around a month to close, June sales and prices largely reflect deals that started in May, as shelter-in-place orders eased and the economic outlook became “less-opaque,” said Jordan Levine, the association’s deputy chief economist. “I think the last couple weeks we have seen uncertainty increase,” he added.
On Monday, Gov. Gavin Newsom took steps to close down parts of the state’s economy that had reopened. On Thursday, the government reported that 287,732 Californians filed unemployment claims last week, up 8.7% from the week before and the highest since early May.
June’s sales surge represents a sharp turnaround from the May, April and March, when Bay Area home sales fell 51%, 37% and 12%, respectively, on a year-over-year basis as shelter-in-place orders and widespread economic uncertainty kept buyers and sellers on the sidelines.
“Pending sales hit bottom in late April,” Levine said. By late April and throughout May, demand was coming back as “the economy opened up slightly.” Also by May, people who were tired of living — and working — in cramped quarters were looking to expand.
What they found on the market was — not much. In June, there were just 5,304 active listings in the Bay Area, down 31% from 7,655 in June of last year. The only Bay Area county with an increase in active listings was San Francisco.
Falling mortgage rates also helped with affordability. On Thursday, the average rate on a 30-year fixed-rate mortgage fell to 2.98%, the first time it had ever dipped below 3% in the nearly 50 years since Freddie Mac has been tracking the rate on government-backed mortgages.
The association’s report does not include sales of condominiums, newly built homes and ones not advertised on a Multiple Listing Service.
The market for condos was generally weaker than for single-family homes last month. The median condo price fell to $701,000, down 0.6% from May and down 6.5% year over year. Condo sales were up 82% from May but down 22% from last June. The association reports condo numbers separately from its main report.
Jing Fang, a broker associate with the Compass real estate firm who works mostly with condo buyers in San Francisco, said he is seeing “a lot of momentum and activity. Buyers think there is a little bit of an adjustment in the market, and interest rates are below 3% now.” For one-bedroom units, “I’m not seeing much of a price reduction.” Two-bedroom units selling for close to $2 million “are a little soft.” She added that “sellers are pretty motivated. Otherwise they wouldn’t put their home on the market right now.”
Jessica Tsai and Marvin Lam are purchasing a one-bedroom unit with patio and den in a new condominium building that’s nearing completion on Third Street, in San Francisco’s up-and-coming Dogpatch. The couple put a deposit down in November because “we are engaged and wanted to spend a little bit more time in the city. We weren’t ready for the burbs yet,” Lam said.
They like Dogpatch for its proximity to the waterfront and new Warriors arena. Lam was planning to open a new business in the neighborhood. After the coronavirus hit, they monitored condo prices south of Market Street and found “more volatility” than before. “Some close above asking, some under, some still on the market longer,” Lam said.
“A lot of price reductions were in other areas. The new buildings in Dogpatch seem to have retained their value,” Tsai said. They’re going ahead with the purchase because “we still really like the property.”
Statewide, single-family home sales rose 42.4% between May and June and the median price rose 6.5% to $626,170, a record high. “A change in the mix of sales was one primary factor that pushed the median price higher in June, as sales of higher-priced properties bounced back stronger than lower-priced homes,” the association reported.
That was true in the Bay Area as well. In April, lower-priced homes were selling faster than higher-priced ones.
In June, “high-price home market segments around the Bay Area were extremely strong,” Patrick Carlisle, chief market analyst for Compass said in a report last week. “In San Francisco, houses selling for $2.5 million and above constituted 30% of all house sales, well above the 2-year monthly average of 18%.”
San Francisco overall, which has had some of the strictest shelter-in-place rules, has been the “weakest performing market as measured by supply and demand indicators (but not median price change) in the Bay Area in the last 4 months. However, it too has seen a very strong rebound from the huge declines immediately following (shelter-in-place) rules being implemented in mid-March,” Carlisle wrote.
He added that the San Francisco rental market “has been hammered by declining rent rates and increasing vacancy rates as newly unemployed residents leave the most expensive apartments in the country. Unemployment typically hits the rental market much harder than the for-sale market.”
If unemployment continues to rise, the “ripple effect” will be felt throughout the housing market, Levine said.
Bay Area home sales plummet during coronavirus, but prices rise
Home prices up in 5 of 7 counties
By Louis Hansen, Bay Area News Group, July 11, 2020
Bay Area home sales plummeted in May, falling by more than one-third in most counties and by nearly half in San Francisco as COVID-19 fears chilled buyers and sellers.
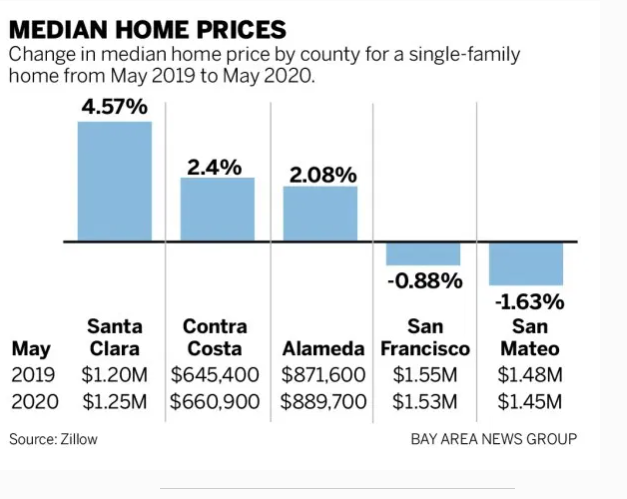
But the slowdown in transactions did little to slow prices — median sale prices rose noticeably in Santa Clara, Alameda and Contra Costa counties, according to Zillow data. The median home sale price for seven counties came in at $866,900.
Bay Area demand for scarce homes remained strong despite the shutdowns and constraints caused by the pandemic. “These numbers are pretty impressive. Pretty striking,” said Zillow economist Jeff Tucker.
The smaller pool of Bay Area house hunters shrugged off historic job losses, an ever-lengthening health crisis and economic uncertainty to snap up the few homes for sale at rates not seen since the peak of the market in 2017. Even limited in-person home tours and less personal meetings with brokers did not discourage these buyers.
The lure of record-low interest rates — hovering around 3.1 percent — has also encouraged many to start shopping.
Median prices for single family homes rose, year-over-year, in five of seven counties in May, according to Zillow. The median price for a home in Santa Clara County rose 4.6 percent to $1.25 million, grew 2.4 percent to $660,900 in Contra Costa County, increased 2.1 percent to $889,700 in Alameda County, jumped 5.9 percent to $462,100 in Solano County, and climbed 2.9 percent to $646,300 in Sonoma County.
Prices fell in the region’s two most expensive spots, but provided no bargains. The median sale price in San Francisco fell about one percent to $1.53 million and dropped 1.6 percent to $1.45 million in San Mateo County, according to Zillow.
Data for Marin and Napa counties was not available.
The market for condominiums in core Bay Area counties continued to crumble, with price drops nearing 15 percent in Santa Clara County, and smaller declines in San Francisco, San Mateo, Alameda and Contra Costa counties.
Tucker said the appeal of single-family homes — with yards and private space — has grown during the pandemic. Many condo units now have limited access to common areas, community gyms and outdoor spaces, and tighter living conditions could be a turn-off for some buyers.
Agents say buyers remaining in the market are serious and prepared to move. Some are reporting bidding wars for Silicon Valley properties, with low inventory fueling the market. And despite the growing reliance on remote work, few have noticed a run for distant suburbs with lower prices and bigger spaces.
Core Silicon Valley communities, including Palo Alto, Mountain View, Cupertino, Sunnyvale and Saratoga, have seen growing interest and sales over listing prices.
Compass agent Mark Wong of Saratoga said business remained brisk with motivated buyers. During the pandemic, he’s seen several clients looking to move from San Francisco high rises to single-family homes in the South Bay.
The tech economy has also remained solid, he added. “People are still buying and selling every single day,” Wong said. “They seem to be bullet-proof on their income.”
Buyers are shopping online and making quick decisions, he said, with offers being accepted as quickly as a day after a property has been listed. “Buyers just can’t wait,” he said.
Agent Tina Hand, president of the Bay East Association of Realtors, said demand remains strong along the I-880 corridor. Low mortgage rates have boosted buying power. “It’s free money,” she said.
Realtors have adapted to new rules, staggering home showings in one-hour intervals because open houses have been banned. The inventory of homes for sale in the East Bay has fallen, like the greater Bay Area.
The pandemic has changed some buyers’ habits. “People are now seriously looking at traditional single-family homes,” she said. “They’re looking for yards again.”
Home Sales Exceed Pre-Pandemic Levels for the First Time as Mortgage Rates Hit Another Record Low
By Sheharyar Bokhari, Redfin, July 15, 2020
Key takeaways for the week ending July 5
- Home sales were up 2% from pre-pandemic levels and are likely to continue rising; pending sales were up 10% during the same period.
- Weekly average mortgage rates fell to a new low of 3.03%, fueling homebuyer demand.
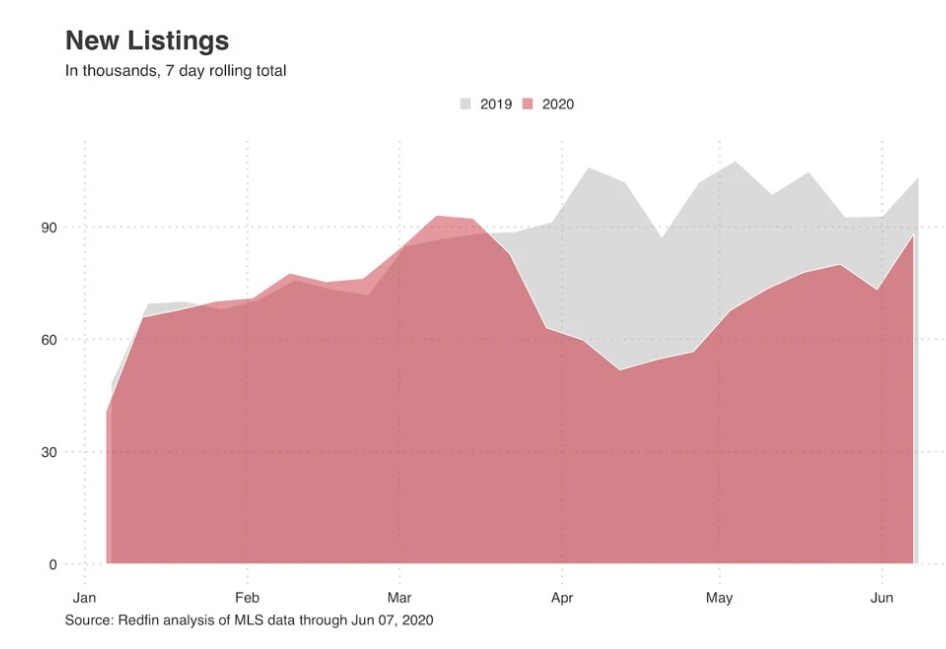
- New listings recovered to pre-pandemic levels for the third straight week, but can’t keep pace with buyer demand; the number of homes for sale was down 29% from last year.
- Nearly half of homes that sold during the week spent two weeks or less on the market, making the market feel “chaotic” for buyers.
- Low rates and low inventory pushed home sale prices up 7% from a year earlier.
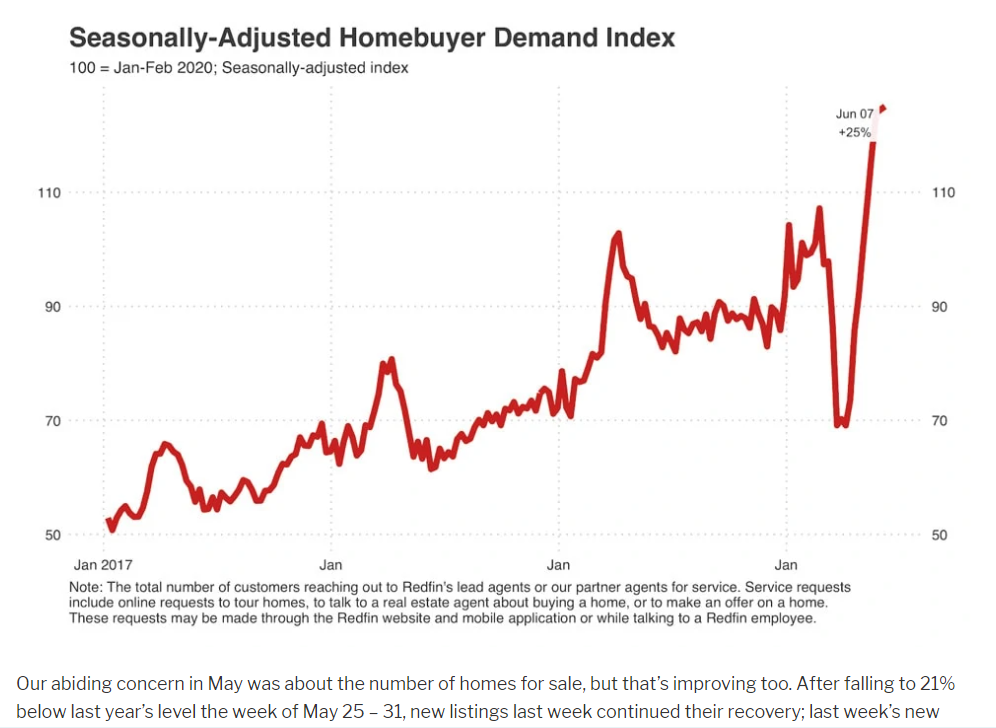
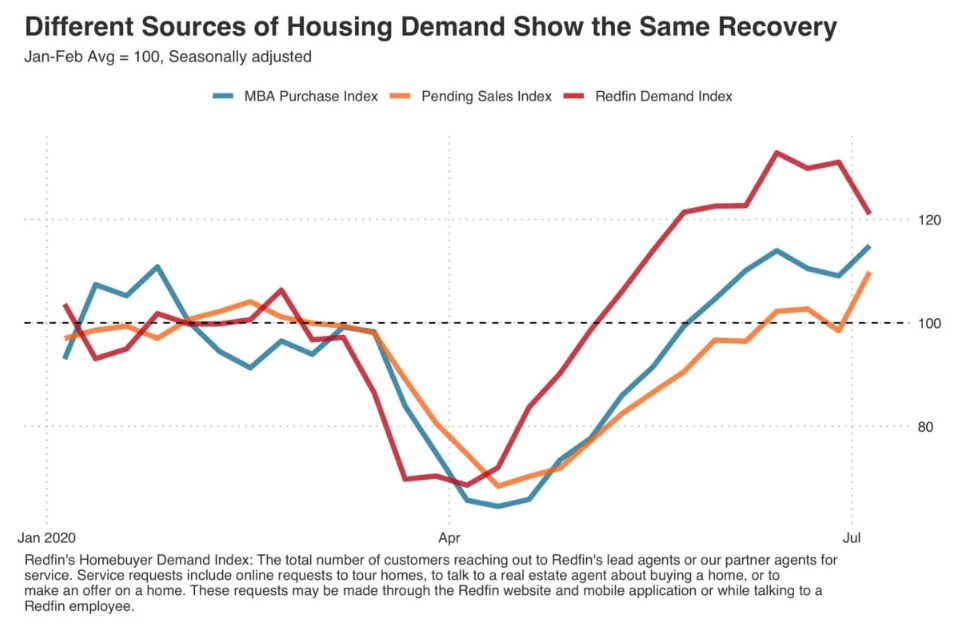
With mortgage rates at a record low, pending sales and homebuyer demand remain above pre-pandemic levels
The housing market continued its recovery in the week ending July 5 despite the rise in COVID-19 cases. For the first time, home sales exceeded pre-pandemic levels from January and February, up 2% on a seasonally adjusted basis. Demand is being propelled primarily by record low mortgage rates; the average 30-year fixed rate was down to 3.03% for the week ending July 9.
“The industry is responding to an avalanche of applications for refinances and purchases.” said Rob Foos, a mortgage advisor with Redfin Mortgage in Boston. “A combination of rock-bottom rates plus pent-up purchase demand has resulted in the highest levels of purchase applications in about a decade.”
Several leading indicators suggest that home sales will continue to increase in the coming weeks; pending sales grew 10% from pre-pandemic levels on a seasonally adjusted basis and the Redfin home-buying demand index has hovered around 20% above the pre-pandemic levels for seven straight weeks. Mortgage purchase applications were also about 15% above pre-pandemic levels.
Potential sellers worry about finding their next home
New listings were at their pre-pandemic levels for three straight weeks, up 1% on average on a seasonally adjusted basis. But there aren’t enough new listings to satisfy the strong homebuying demand. As a result, the total number of homes for sale was down 29% from a year ago. Redfin agents report that sellers are now rarely citing coronavirus concerns as a reason not to list, but more often cite the lack of homes for sale itself as the thing that’s holding them back.
“Some of my clients are considering selling, but it’s a matter of finding a home they can buy,” said Redfin agent Thomas Wiederstein in Phoenix. “Even if they do find a home that checks all the boxes, many move-up buyers can’t buy a new home before they sell their current one. With bidding wars so common, it’s very hard to get an offer accepted that’s contingent on the sale of the buyer’s current home.”
Lack of homes for sale fuels competition
Buyers face competition more often than not, as more than half of Redfin offers faced a bidding war in June for the second month in a row, and homes are going off-market quickly. The share of listings that went off market within two weeks stood at 45% this week, up from 35% a year ago. Shoshana Godwin, a Redfin agent in Seattle, is seeing a return to bidding wars and buyers waiving contingencies to make their offers more attractive.
“We’re back to buyers waiving their rights to cancel the contract if something pops up during the inspection or they can’t get their loan approved. Buyers used to try to inspect the home before writing an offer, but now sellers are providing an inspection report upfront. That brings in even more bidders because they don’t need to spend $500 on an inspection just to make an offer,” Godwin said.
Redfin San Francisco agent Chad Eng describes a housing market that feels “chaotic” in the absence of pre-pandemic norms.
“Due to COVID-19, agents are scheduling back-to-back 15-minute in-person home tours instead of holding traditional open houses. If you miss your appointment, you’re out of luck. Sellers often set a deadline for buyers to submit offers so they can review all of their options at once, but now that there’s so much uncertainty, sellers who receive one strong offer are less willing to wait around to see what else trickles in. I’ve seen multiple sellers accept an offer before the deadline, meaning buyers who wait miss out on their shot at buying the home.”
With competition comes rising home prices. The average sale price for the week ending July 5 was $310,000, up 7% from a year ago. The big question is how high prices will go? Asking prices for newly listed homes continue to accelerate as well, rising 16% over the same week last year to $324,900.
What’s ahead?
Right now the market shows no signs of slowing down, but it will face a new test at the end of July. Thanks to the CARES Act, roughly 30 million Americans are receiving an extra $600 in weekly unemployment benefits. That extra benefit is set to expire July 31, unless lawmakers pass an extension or new legislation to supplement income for folks who are out of work.
The expiration of these enhanced unemployment benefits could adversely affect personal spending, a crucial component of the economy that makes up 68% of GDP. A pullback in consumer spending could hit industries outside of travel, service and hospitality which so far haven’t been as impacted during the pandemic. That’s notable because so far, highly-paid employees have been largely insulated from the recession and the high unemployment rate in service jobs has had a limited impact on housing demand. If job losses creep into new industries, all bets are off.
Why California’s housing market isn’t tanking
Rents are falling in some areas, but home prices remain stubbornly high
BY MATT LEVIN, Cal Matters, JULY 6, 2020
It’s the worst economy since the Great Depression. Nearly 1 in every 6 California workers is out of a job, and those lucky enough to remain employed confront reduced hours, slimmed wages and mounting uncertainty over what the next few months will bring. The state budget is in shambles, and cities and counties are already laying off workers.
And yet California home prices aren’t dropping all that much.
Despite the economic carnage induced by the novel coronavirus pandemic, the state’s stubbornly expensive housing market appears headed for a relatively soft landing. While rents in some markets show signs of a steeper cliff, the value of a California single family home last month — $570,000 — is actually higher than what it was a year ago, according to the real estate data firm Zillow.