


 Facebook
 X
X
 Pinterest
 Copy Link

November 30, 2019 – Real Estate Market Numbers
By Glen Bell (510) 333-4460
Here are some highlights for the 39 East Bay Cities that I track:
Affordability, increasing inventory, reduced sales, considerations of moving out of the Bay Area, possibility of recession, are all topics of interest in a market in transition. Properties are staying on the market longer, we’re seeing fewer offers than before, more price reductions and some incentives now being offered, in effect, all favoring buyers. Yet indecision has many buyers on the fence with a wait and see attitude despite having more choices. The gap between buyer and seller expectations has increased. A softening of the market has many sellers still holding out for top dollar, while buyers seeing a bit of leverage for the first time in years are now looking to possibly take advantage.
The two numbers that stand out at the end of November was the huge drop in inventory that took place and the percentage of homes that are now sitting. This is the time of year when things begin to slow down. However, it’s a bit early this year. We normally don’t see dramatic changes like this until December. Buyers are hesitant on doing much when we start to reach the holiday season and they tend to shelve their search until the beginning of the new year. Sellers are aware that with less activity comes fewer buyers. If they haven’t already listed their property by now, considerations on delaying until the spring comes into play. We see fewer listings come onto the market now, and inventory begins to come down. However, what was so noticeable was that this process started earlier than normal. We usually see the large drop in December. It’s also a time for possible bargains. However, there’s less to look at. Many sellers who “have to” sell will stay the course and soften their expectations.
Here’s where we stand as of the end of November. Inventory has decreased since last month by a whopping 32.4%, now sitting at a 30 day supply of homes for sale. This is far less than what we saw last year at this time of 42 days. Pendings decreased slightly, but is slightly more than last year by 14.6%. The pending/active ratio increased to 1.2. This is well above where we were last year at the end November of .71. The pending/active ratio has been a benchmark that we’ve used as a measure of supply and demand to determine whether we’re in a buyer’s or a seller’s market. Typically, a number well above 1, (less inventory with more pendings) favors sellers. A number below 1 favors buyers. This may be attributed more to the market ending early this year, rather than when it normally does in December.
67% of the homes listed are now “sitting” for 30 days or longer, while 39% have stayed on the market for 60 days or longer. This is clearly higher when compared to last year’s number at the end of November (with then 59% remaining active over 30 days and 30% remaining active over 60 days). This is fairly normal for this time of year only a month earlier than normal. These are the kind of numbers that we usually don’t see until December. However, these percentages can be somewhat misleading. Many of the homes that have not been selling remain on the market while fewer newer homes are coming onto market because of Holiday concerns. That’s why the percentage of sitting homes goes way up.
The “distressed” market, (foreclosures and short sales) are no longer a factor representing less than .05% of the market.
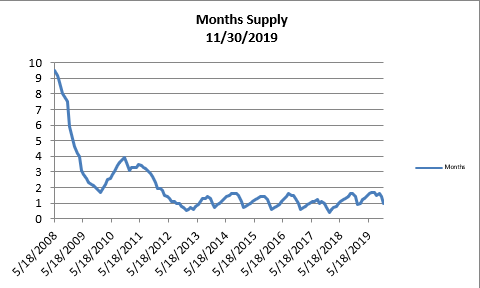
- The month’s supply for the combined 39 city area is 30 days. Historically, a 2 to 3 months’ supply is considered normal in the San Francisco East Bay Area. As you can see from the graph above, this is normally a repetitive pattern over the past four years. Supply is less when compared to last year at this time, of 42 days.
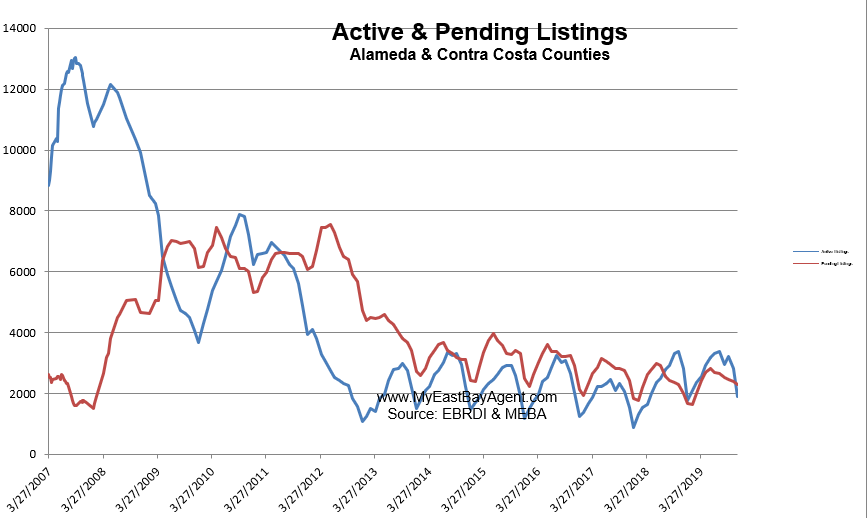
- Our inventory for the East Bay (the 39 cities tracked) is now at 1,905 homes actively for sale. This is fewer than what we saw last year at this time, of 2,816. We’re used to seeing between 3,000 and 6,000 homes in a “normal” market in the San Francisco East Bay Area. Pending sales decreased to 2,287, slightly more than what we saw last year at this time of 1,995, or about 14.6% higher.
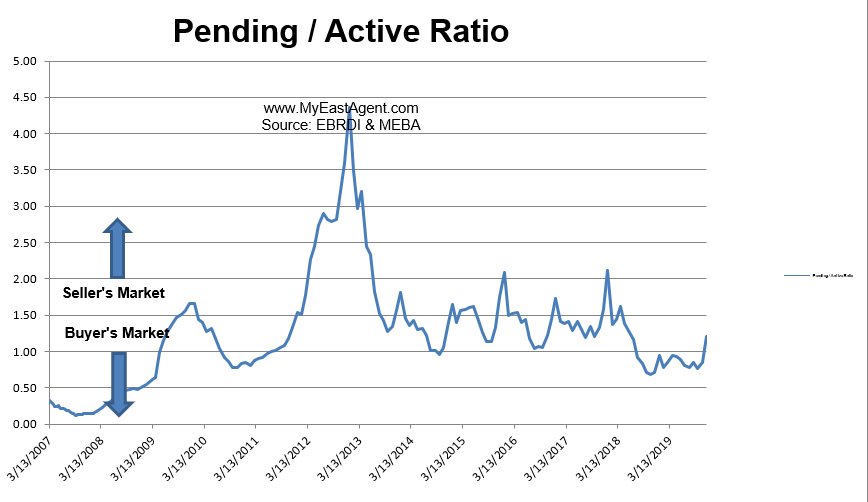
- Our Pending/Active Ratio is 1.2. Last year at this time it was .71
- Sales over the last 3 months, on average, are 2.1% over the asking price for this area, lower than what we saw last year at this time, of 2.8%.
Recent News
Housing Market In 2020: Boom Or Bust?
By Panos Mourdoukoutas, Forbes, December 9, 2019
2020 will be a challenging year for the housing market.
On the one side, there’s a strong US economy that has driven the unemployment rate to record low levels, boosting disposable income, which makes a bullish case.
Then, there are low mortgage rates and housing shortages, which add to the bullish sentiment.
“We think the housing market will remain strong for the most part in 2020, as low-interest rates will keep demand high for new mortgages,” says Josh Stech, CEO, and Co-Founder of Sundae, a site that helps sellers get a fair price for their house. “We also think there will continue to be shortages of new housing in many markets, which will contribute to overall price growth.”
On the other side, there’s the problem of affordability, which will put the brakes on the housing market. The Case Shiller Home Price Index in the US reached an all-time high of 218.27 Index Points in September of 2019, making it difficult for first-time home-buyers to afford a home.
“While sellers may be able to ask more for their homes, they’re likely to get fewer offers in total due to more buyers being priced out of the market,” says Stech. “This could lead to longer listing times and increased stress on sellers who go the traditional route of marketing their homes on the MLS.”
That’s how bull housing markets usually end.
And there’s “pent-down” demand, which has been “stealing” sales from the future since the era of “free money” began. A period of very low interest rates, that is.
To understand how “pent down demand” (a concept I coined) affects sales for high ticket items, a good place to begin is with the more familiar concept of “pent up demand,” the lack of current demand for high-ticket items households buy — like appliances, autos, and homes.
Pent up demand usually arises ahead of periods of consumer euphoria. It’s caused by such factors as lower price expectations, depressed consumer confidence, or a credit crunch.
And it disappears together with these conditions when that future day comes, and consumers rush to buy the items they put off in the past.
In contrast, pent down demand arises after a period of consumer euphoria. It’s caused by the low cost of financing — which blurs the distinction between present and future. Why wait to buy a new car or a new home next year when you can have it this year, with a “zero percent” financing plan?
Simply put, pent down demand “steals” sales for high discretionary items from the future. It eventually depresses spending on these items when the future arrives.
That’s what happened in the middle of the last decade when the housing market went from a boom in 2005 to a bust in 2007.
Does it mean that the US housing market is where it was back in 2005? Dan North, chief economist at Euler Hermes North America, doesn’t think so. He sees several differences between then and now.
“Houses, in general, are probably overvalued but not to a great degree, and certainly not as much as before the housing bubble peaked in 2005,” North says. “The housing bubble which had been inflating for over a decade before it collapsed had been driven by significant risks such as speculation, house-flipping, and highly questionable mortgages such as no-documentation loans, and adjustable-rate loans which turned disastrous for many borrowers.”
That’s why he assigns low probability of a housing crash in 2020. “At the current time we see little of these excessive risks, and combined with only modest overvaluation, the probability of damaging housing crash is limited.”
Queen, New York-based independent real estate agent Basili Makris agrees. “I expect real estate prices to stabilize in 2020,” he says. Though, some local markets may have a little bit more room to rise.
Still, there’s “mean-inversion,” which can raise the probability of a market correction after years of a big run.
As California homeowners lose insurance due to wildfire risk, the state is stepping in
Kathleen Pender, SF Chronicle, December 6, 2019
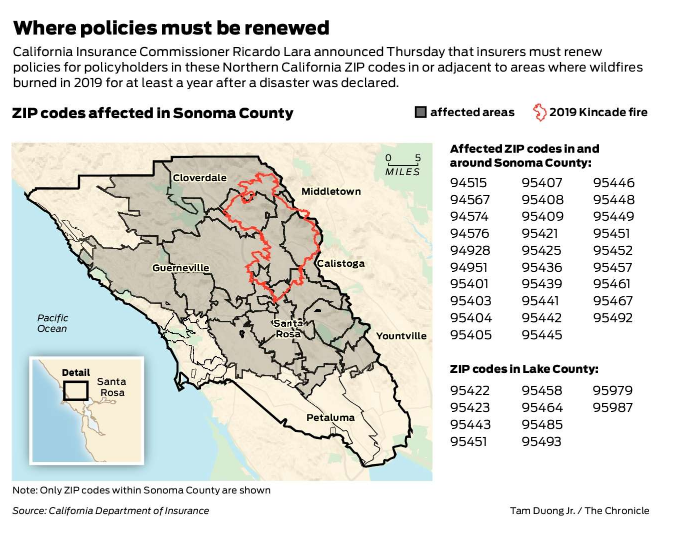
The California Insurance Department on Thursday implemented a new state law that prohibits insurance companies from not renewing policies for homeowners living in ZIP codes in or adjacent to wildfires for one year from the date the area was declared a disaster.
Insurance Commissioner Ricardo Lara also called on all regulated insurers to voluntarily halt nonrenewals based on wildfire risk for all business and residential customers statewide for one year, until Dec. 4, 2020.
The moves come at a time when homeowners in areas at high risk of wildfires are finding it harder to get and keep insurance. Lara made the announcement at the home of Sean Coffey of Montclair, whose home in the Oakland hills has been dropped three times, by three different insurers, since 2015.
Older state laws prevent insurers from not renewing customers who suffered a total loss caused by a declared disaster for a certain period of time. For losses suffered before 2019, they must offer to renew customers at least once. For losses in 2019 and later, they must offer to renew at least twice or for 24 months, whichever is greater.
The new law, which Lara authored when he was a state senator, took effect Jan. 1 for declared wildfire disasters starting on or after that date, but there were none until October. SB824 prevents insurers from dropping any residential policy in a ZIP code within or adjacent to a wildfire perimeter for one year from the date a disaster is declared. It applies only to nonrenewals on the basis of wildfire risk.
Cal Fire determines each fire’s perimeter, and the insurance commissioner identifies which ZIP codes are covered.
On Thursday, Lara issued a list of ZIP codes for seven of the 16 fires included in emergency declarations issued by Gov. Gavin Newsom this fall. The list includes the Kincade Fire in Sonoma County, Eagle Fire in Lake County and major fires in Southern California. It will identify ZIP codes in and around the other wildfires soon.
The laws preventing nonrenewals, apply to insurance companies regulated by the state and to surplus carriers, such as Lloyds of London, which are not state-regulated.
In August, the department released data showing that nonrenewals are growing in response to wildfire risk. They rose by more than 10% last year in seven counties from San Diego to Sierra.
Homeowners turned down by mainstream insurers are turning in growing numbers to surplus carriers and to the Fair Plan, California’s insurer of last resort that offers limited coverage.
Coffey said “it was a scramble” getting insurance when he and his wife bought their Oakland hills home in 2015. “I talked to six or seven companies, and finally found one the day before we closed on the house,” he said.
A year later, they got a nonrenewal notice and had to find another insurer. The next year, that company declined to renew. A third company insured them for two years, then dropped them. This year, they got a Fair Plan policy, which offered limited coverage for $1,480, and a separate policy from another company for liability and other coverage the Fair Plan lacks, for $580. They just got a notice that their Fair Plan policy is going up by about $670 next year.
Coffey and his wife, Elizabeth, both work for nonprofits and have two young children. Insurance is a big expense and it’s hard to budget for when the cost is unpredictable. “Every year I get nervous that we are going to get a letter” of nonrenewal, he said. “I just didn’t know it would be such a problem for homeowners.”
Last month, Lara ordered the Fair Plan to double the coverage limit on its bare-bones homeowner’s policy to $3 million by April 1, and to begin offering a comprehensive policy alongside it. The Fair Plan is an association backed by state-regulated insurance companies in proportion to their market shares. On Thursday, the Fair Plan said in a letter to Lara that it fully supports increasing the coverage limit to $3 million but does not want to offer a comprehensive policy. Doing so would divert its “finite resources” and would be more expensive than what consumers can buy now.
Industry spokesman Rex Frazier, president of the Personal Insurance Federation, issued a statement in response to Thursday’s announcement: “As climate change accelerates, we are facing more and growing wildfires in California, and we must adapt to that reality and factor climate change into coverage and rates to ensure availability of insurance for all homeowners. Year-over-year losses that the industry has seen are not sustainable for companies or good for homeowners. We look forward to working with the insurance commissioner to anticipate and prepare for these impacts on the insurance market to ensure that homeowners have access to coverage.”
Homeowners can find the list of ZIP codes at http://bit.ly/cafirezipcodes. Those who believe they have been dropped improperly by their insurers can file a complaint online at www.insurance.ca.gov or call 800-927-4357.
SF is one of the most expensive places in the world to build housing. Here’s why
Roland Li, SF Chronicle, December 8, 2019
Adrian Caratowsa was lucky.
After six years of trying and failing to score an affordable apartment in San Francisco, he won the lottery for a city-subsidized apartment in the Transbay district.
Caratowsa, who once lived in a South of Market warehouse with 27 roommates, now pays around $1,000 a month for a one-bedroom at 255 Fremont St. Nearly 70 people applied for each apartment in the building.
“I can’t imagine living in the city if I didn’t have it,” said Caratowsa.
San Francisco is struggling with a herculean task: creating as much housing as possible for people like Caratowsa to make up for decades of underproduction. But the enormous cost of building in the city has meant that developers can’t create nearly enough affordable or market-rate homes. More than 30,000 homes that have been approved haven’t yet started construction, as developers try to find financing and enough workers to build.
The Chronicle found numerous factors that contribute to San Francisco’s now astronomical housing development costs. Interviews with experts and those in the building industry and a review of the data point to the culprits: a worker shortage, long waits for permits, restrictive zoning and high fees, among other things. The result is a city consistently failing to produce enough housing to meet its needs.
Caratowsa lives in Natalie Gubb Commons, a project that cost a total of $58 million to design, obtain approvals for and build. Nonprofit developer Mercy Housing relied on federal, state and city financing to build the project at a cost of nearly $500,000 per unit. The per unit price would have been far higher if the city hadn’t donated the land. The cost to build one new apartment or condo unit in San Francisco today — whether market-rate or affordable — tops $700,000, nearly triple what it cost about 10 years ago.
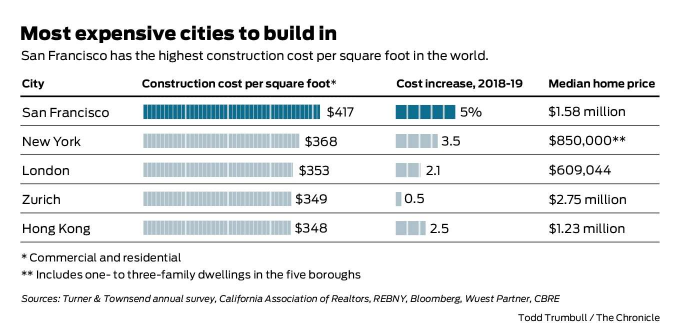
That means that this year, San Francisco surpassed New York for the highest construction costs in the world, according to consulting firm Turner & Townsend.
By contrast, the cost to build the average U.S. single-family house was $237,760 in 2017, according to the National Association of Homebuilders.
Construction costs are one of the primary reasons that so little housing is getting built in San Francisco. From January to September this year, construction began on just 1,281 market-rate homes, down 62% from that period last year, according to real estate data firm CoStar.
Here’s a breakdown of the factors taking San Francisco housing costs to record highs.
Key elements: It’s not surprising that actually building a structure is one of the biggest costs. “Hard costs” — paying for construction workers and materials like lumber, concrete and steel — account for about half of the total price tag, said Mark Hogan, an architect at OpenScope Studio.
Land costs vary, but on average account for around 20% of the budget. The remaining 30% are “soft costs” that include city fees and hiring consultants, attorneys, architects and other professionals.
Developer Patrick Kennedy of Panoramic Interests said market-rate developers seek around 5% annual returns, so an apartment that costs $750,000 to build would need to generate $37,500 a year after operating expenses and taxes. Rents would have to exceed $5,000 a month to make it feasible to build.

Construction costs: Labor costs have jumped 5% a year because of a shortage of workers. The 2008 recession devastated the construction industry, forcing many workers to switch careers. The Bay Area’s commercial building boom has made the problem more severe.
In recent years, projects like Salesforce Tower and Apple Park competed with housing developments for the same pool of workers, from carpenters to electricians to plumbers.
Kennedy, who has a 200-unit project under construction at 333 12th St. in San Francisco, said that a skilled worker can cost as much as $1,000 for an eight-hour day. Panoramic, he said, may spend $300,000 just on parking for its workers over an 18-month period.
Construction workers also must contend with high housing costs, which create a vicious cycle. Workers needed to build new housing must earn enough money to afford to live in the area.
Workers who move to the Bay Area from outside California require more time to be trained. They don’t know the local building codes or earthquake safety requirements, said Joseph Olla, a vice president at San Francisco general contractor Nibbi Brothers.
That level of inexperience has added to the overall cost of labor, said Kennedy. It takes up to 25% more workers today to be as productive as a decade ago, he said.
According to the McKinsey Institute, the construction industry’s labor productivity grew only 1% per year over the last 20 years, compared with 2.8% for the total world economy.
“We’re building wood framing pretty much the same way we did in 1833,” Kennedy said.
The average worker hasn’t seen huge benefits, despite the need for labor, said Scott Littlehale, senior research analyst for the Northern California Carpenters Regional Council, a construction union group. Average annual wages for construction jobs have increased 4% a year since 2012, below the 4.7% rise in the overall Bay Area economy, he said.
Olla of Nibbi Brothers said he sees higher profits for subcontractors specializing in scarcer, high-skilled jobs, such as plumbers and electricians.
Land purchase: San Francisco has among the highest land costs in the country. One extreme example: In 2017, a Chinese developer bought majority ownership of a waterfront condo site valued at a record $916,000 per unit — just for land.
Skyrocketing land costs are partially tied to how few areas in the city are zoned for apartments. Buildings with three or more apartments are allowed on only about a quarter of San Francisco’s land.
“If there’s a limited area where you are allowed to build multifamily, the prices for those areas are going to be much higher than they would be otherwise,” said David Garcia, policy director at UC Berkeley’s Terner Center for Housing Innovation. Allowing apartments in more areas could bring down the cost of housing, he said.
Fees and permits: Residents in new housing use transit, parks, schools, police and other vital services, so cities charge fees to offset the costs.
“We are trying to solve so many problems —all important — through housing” that it’s costing a lot, said Doug Shoemaker, president of Mercy Housing, the nonprofit developer that built Natalie Gubb Commons.
San Francisco fees add up to around $50,000 per unit for market-rate projects in the most active development areas, according to the Planning Department. Market-rate projects must also provide around 20% of units for low-income tenants — the highest proportion in the country — or pay fees to help fund affordable units elsewhere. Those fees add another $50,000 to $75,000 per unit.
Another factor driving up costs is San Francisco’s approval process. Developers say it is one of the most difficult in the world. Opponents of projects are empowered to easily delay them by requesting additional reviews or filing lawsuits.
Kennedy of Panoramic said these rules boost the cost of housing. “The lack of housing is a largely self-inflicted problem,” he said.
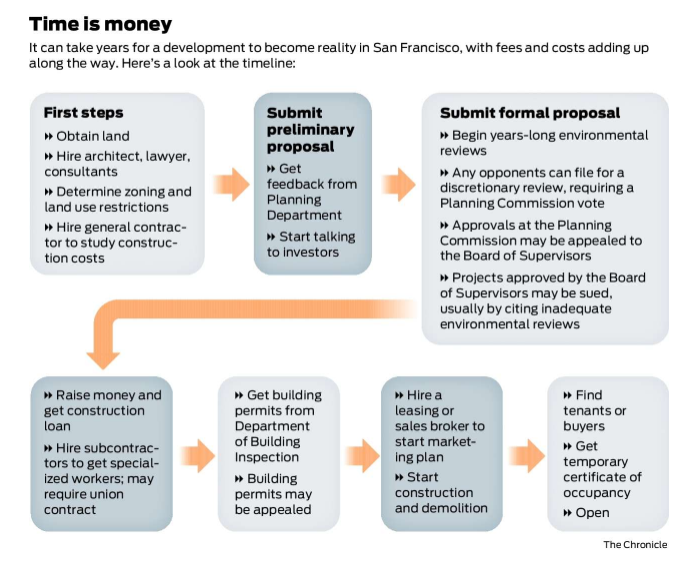
To navigate the approvals process, a slew of expensive professionals are usually required, including land use attorneys, architects, shadow consultants, open space designers and lobbyists.
Affordable projects can cost more per unit than some market-rate projects. They have additional open space and disabled-accessibility requirements, and there’s pressure for top-notch design, said Garcia of Terner Center.
“We have really high expectations of design quality that range from incredibly important to probably unnecessary,” Shoemaker said.
How to slash costs: San Francisco and California could make it cheaper to build housing by streamlining approvals, experts say. The city could adopt more “area plans,” which can speed up the process by establishing ground rules, and local officials and state legislatures could limit the ability of opponents to delay projects.
“Cities don’t control the price of materials and labor,” Garcia said, but they do have the authority to speed up approvals.
The average environmental review process, now lasting about two years, could be cut down to a few months through area plans.
Another way to save money: reduce parking requirements. Each space costs $50,000 to $100,000, Kennedy said.
Developers are also exploring modular construction, where modules are assembled elsewhere and shipped in. Kennedy said the practice can lead to a 20% savings, and cut 50% off of the construction time.
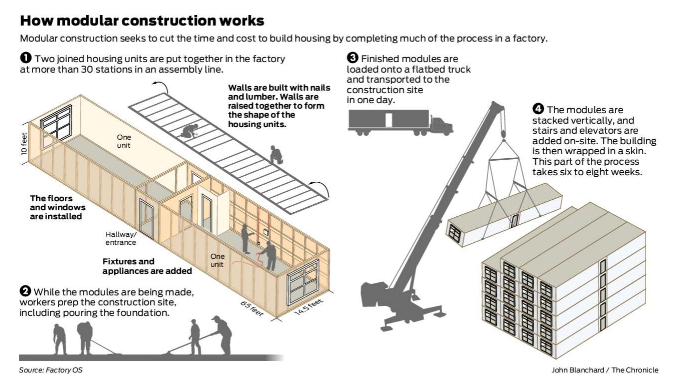
But that strategy has run into union opposition because some work on the modules is done in another city or overseas.
So for now, costs will probably keep climbing.
A San Francisco high-rise can now cost $1 million per apartment to build, about 20% higher than what is feasible, said Oz Erickson, chairman of developer Emerald Fund. With rents and home prices hitting a plateau and costs continuing to rise, he said, development is approaching “impossible.”
Lots of baby boomers will sell their Bay Area homes — here’s when that might affect the market
Zillow study sees more competition between baby boomers, millennials
By Louis Hansen, East Bay Times, November 26, 2019
A flood of houses for sale could be headed toward desperate Bay Area homebuyers.
But don’t hold your breath — baby boomers won’t be leaving their roosts in earnest for at least another decade, according to a new Zillow survey.
The real estate site expects a 25 percent turnover in Bay Area home ownership by the faraway year of 2037, as aging boomers downsize, move or die. In the meantime, Zillow expects the region’s housing choices to remain limited as older and newer residents continue to compete for homes.
“The inventory squeeze is going to be at its most acute in the next five to 10 years,” said Zillow economist Jeff Tucker. Nationally, Zillow expects a 27 percent turnover of homes in the next two decades.
Scant choices for homebuyers, historically low new residential construction and Silicon Valley’s demand for more workers have pushed Bay Area home prices to the highest in the nation. The median home sale price in the nine-county region was $810,000 in September, down from a peak of $928,000 last May. Favorable interest rates have made mortgages more affordable and fueled demand.
Despite a recent uptick in state building permits bringing new condos, apartments and single-family homes to the region, residential construction in the Bay Area remains mired at historically low levels.
Local agents and homebuyers say the market still favors sellers.
Many boomers haven’t been particularly anxious to leave California, said Nancie Allen, president of Bay East Association of Realtors. “I feel like a lot more boomers are aging in place,” said Allen, a Fremont-based agent.
Her boomer clients generally have two main incentives for staying put: a new home-equity loan on their property or a paid-off home with low property taxes. The possibility of a big tax bill — by losing Prop 13 protections and a capital gains levy on a sale — also discourage older homeowners from moving. “Boomers look at all that and say, “Why move?’,” Allen said.
Some of the reluctance to move may account for the region’s lack of choices for home buyers.
In the East Bay, inventory of homes for sale fell 20 percent in October from the previous year, according to the Bay East Association of Realtors. Median sale prices edged up 2 percent. Owners along the entire I-880 corridor in the East Bay put fewer homes up for sale, with the exception of Berkeley.
Agents saw significant drops in homes available in central Contra Costa County, including Clayton, Martinez, Pleasant Hill and Walnut Creek. The inventory squeeze pushed prices up through the area, according to the association.
In Santa Clara County, the inventory of single-family homes fell 13 percent in October from the previous year, from 1,645 to 1,428 houses on the market, according to MLS Listings. San Mateo County listings dropped 1 percent from the previous year, from 653 to 646.
The Zillow study highlighted the national shortfall in new home construction. Between 2000 and 2009, developers built an average of 900,000 units annually. Between 2010 and 2019, new construction has accounted for just half that amount, 450,000 units annually, Tucker said.
Regions such as the Bay Area, Seattle and Los Angeles that attract young residents and encourage older homeowners to stay, Tucker said, “will continue to see the most acute housing crunch.”
The property tax breaks given by Prop 13 have set up a strong incentive for older homeowners to stay in place, Tucker said.
But younger residents can expect to see greater inventory in Walnut Creek (an expected turnover of 40 percent), North Beach (38 percent), and Mountain View and Palo Alto (32 percent each), according to Zillow. The numbers reflect the higher percentage of older residents in these communities.
Tucker expects that in retirement regions — particularly Arizona and Florida — two-thirds of the homes will turn over. The so-called Silver Tsunami is expected to hit Florida cities Tampa, Miami and Orlando hardest.
Other, older Midwest and Great Lakes cities with shrinking industrial economies in Ohio, Pennsylvania and upstate New York also are expected to have high turnover rates.
Can You Afford to Buy a Rental Property?
By: Matt Frankel, CFP, Contributor, Updated on: Dec 10, 2019
Can you really afford to buy your first rental property? Here’s how you can be sure.
Investing in real estate can be an excellent way to build wealth over time and create an additional income source, but it is also one of the more capital-heavy types of investments you can make. While you can get started in stock or mutual fund investing with just a few hundred dollars, that simply isn’t the case when it comes to buying rental properties.
With that in mind, before you start shopping for properties to invest in, it’s important to know that you can afford to become a rental property investor.
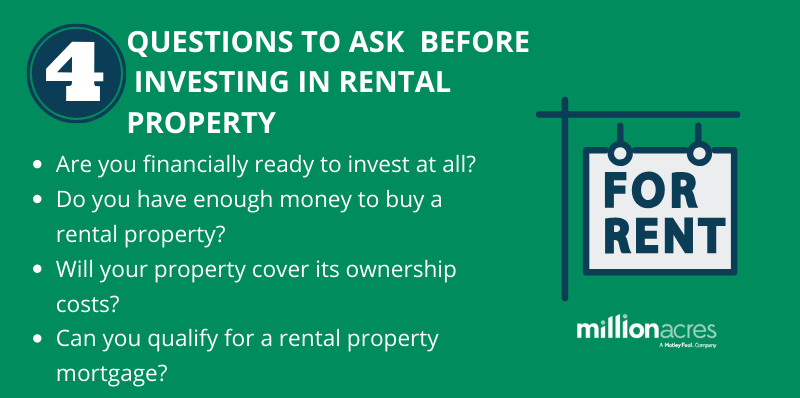
Having said that, the question of Can I afford to buy a rental property? isn’t a simple one. There are several considerations to think about before you can determine if you can afford to take the plunge into rental real estate investing:
- Are you financially ready to invest at all?
- Do you have enough money to buy a rental property?
- Will your property cover its ownership costs?
- Can you qualify for a rental property mortgage?
Let’s take a closer look at these four questions one at a time:
Are you financially ready to invest at all?
Before you even consider buying a rental property, it’s important to do a quick financial health checkup. In a nutshell, there are two basic financial things you should do before you become a rental property owner:
- Pay off high-interest debt:The average credit card’s interest rate is more than 17%. It’s possible to earn returns in this ballpark on rental real estate, but it isn’t exactly common, especially for new investors. The point is that it’s silly to invest money in the hopes of earning a 10%–15% annualized return (the most common range), while simultaneously paying a higher rate to borrow money. If you have high-interest credit card debt, you should aim to pay it off or at the very least get a 0% APR balance transfer before you buy a rental property.
- Establish an emergency fund:What good is an investment if you’ll have to sell it if you face any unexpected expenses? Before you start investing in real estate or anything else, it’s a good idea to build up a bit of an emergency fund to help you deal with unexpected expenses or financial hardships. Most financial planners suggest that you should aim to keep six months’ worth of expenses in an easily accessible place. This is certainly a good goal to aim for, but you don’t necessarily need to get there before you start to invest.
Do you have enough money to buy a rental property?
Once you’ve established that you’re ready to invest, the next step in rental property affordability is determining whether you have enough money to actually purchase a property. Obviously, this depends on the cost of the property itself. All other things being equal, it’s going to require more capital to buy a $300,000 property than a $100,000 home.
One common rookie mistake is assuming that the down payment is all you need, but that’s simply not true. Here’s a rundown of the various initial expenses you need to prepare for:
Down payment
The down payment is the most obvious upfront cost associated with the purchase of a rental property, but many new investors aren’t quite sure how much to expect.
Generally speaking, you should expect your lender to require a minimum of 20% down, as it is nearly impossible to find private mortgage insurance (PMI) for an investment property mortgage. If you are an extremely well-qualified buyer and are purchasing a single-family rental property, it’s possible to get a conventional mortgage with a 15% down payment, but that’s about the only exception I’m aware of. Most lenders want at least 25% down, especially on multi-unit residential properties, so that’s a good figure to prepare for.
Alternatively, you can choose to buy a multi-unit property and live in one of the units, which can qualify you for low-down-payment mortgages designed for owner-occupants. This is known as “house hacking” and we’ll discuss it later in this article.
Closing costs
Unless the seller has agreed to pay for closing costs, you’ll need to budget for this as well. Closing costs can vary considerably and can be higher on investment properties than primary homes. For example, property taxes are often higher for investor-owned homes than for owner-occupants, and you’ll be expected to prepay a certain amount of your property taxes at closing. Origination fees also tend to be higher on investment property mortgages.
As I mentioned, closing costs can vary dramatically, and typically run anywhere from 2% to 5% of the property’s sale price, although higher closing costs aren’t unheard of.
Repairs
If you buy a rental property that is 100% rent-ready and in overall great shape, you may not have to worry about this, but if you buy a property in need of any rehab, be sure to include this in your budget.
Your inspection report can be a good indicator of the need to budget for repairs, even if the property is in good working order. For example, I recently bought a property where everything was operational, but the inspection report revealed the water heater was on its last legs, so I set aside money to replace it shortly after closing.
Reserves
If you obtain a mortgage for your rental property, your lender will often require a minimum balance in reserves — typically between six and 12 months’ worth of mortgage payments.
This is a good start, but you may want to err on the side of caution and wait until you have more cash in reserve than you think you’ll need. Maybe your property will sit vacant for a few months after you buy it. Maybe something major will break, like the HVAC system. Before you buy a rental property, it’s best to be sure that even if setbacks happen, you can absorb them without having to dip into your personal savings.
Will your property cover its ownership costs?
If you’ve established that you can afford the upfront costs to purchase a particular rental property, the next step is making sure the property won’t be a money-drain after you buy it. In short, you need to make sure that you’ll get positive cash flow.
In other words, if a property rents for $1,000 per month but you’re paying $1,200 per month in various expenses, it’s going to drain your bank account over time. On the other hand, a property that brings in $1,200 and costs $1,000 will cause your bank balance to increase as time goes on, which is a far more desirable outcome. So, you need to learn some basic cash flow analysis.
Rental income — How much should you expect?
The first component in cash flow analysis is the property’s rental income. If the property is already rented, this is easy. If it isn’t, your real estate agent can be a good source for an estimate, and you can also order a rent appraisal that can let you know what to expect (if you obtain a mortgage, your lender might order a rent appraisal that you can use).
Many investors — myself included — have rules of thumb when it comes to rental income. For example, I won’t buy a rental property unless the purchase price is at most 100 times the expected monthly rent. So, if I expect a home will rent for $1,000 with minimal work, I’m willing to pay as much as $100,000. This is a pretty common rule and can help you separate the better property deals to pursue.
Operating expenses
There are lots of potential costs of owning a rental property, but for cash-flow purposes, we’re just going to focus on the recurring expenses. These can include, but aren’t necessarily limited to:
- Mortgage payments
- Property taxes
- Hazard insurance
- Property managementfees
- Any utilities you pay
- Lawn maintenance
- Pest control
Don’t forget about vacancies and maintenance
It’s not enough to simply subtract your operating expenses from your income. That’s a common mistake and you’d essentially be planning for an ideal scenario forever.
At some point, your property will be vacant — maybe it just needs a couple weeks’ worth of repair work between tenants, or maybe your real estate market will slow down and the property will sit vacant for a few months at some point. Similarly, at some point, you’ll need to spend some money on maintenance.
There’s no way to predict these situations with 100% accuracy or to know when they will occur, so it’s important to set aside a portion of the rent you collect to cover them when they happen. My personal rule is to set aside about 15% of the rent I collect for vacancies and maintenance — but I’ll adjust this a bit higher if the property is older and slightly lower if the property is brand new.
Cash flow example
Here’s a real-world example of the cash flow from a property I bought last year. The property is a triplex (three units), and rents for a total of $2,500 per month.
As far as operating expenses go, here’s what I pay:
- $1,600 (approximately) for my mortgage payment, including taxes and insurance
- $250 (10% of the rent) for property management
- $100 for lawn maintenance and pest control
This brings my total operating expenses to $1,950. Setting aside 15% of the rent for vacancies and maintenance takes up another $375 per month, which makes my total estimated ownership expense $2,325 per month.
So, my cash flow from the property is estimated to be $2,500 in rent minus $2,325 in expenses, or $175 per month. Of course, if the property doesn’t end up needing any maintenance and remains occupied 12 months every year, my actual cash flow will be significantly higher. However, it’s far better to prepare for a realistic scenario and be pleasantly surprised if things go well.
Many investors have specific cash flow requirements. Maybe they need a certain minimum amount of cash flow each month, or they want a specific percentage yield on their invested capital.
Personally, I simply require that my investment properties produce positive cash flow after assuming a reasonable amount for vacancies and maintenance, but it’s important to tailor any rules of thumb to your own investment goals and income requirements.
Can you qualify for a rental property mortgage?
If you’re planning on paying cash for your rental property, you can skip this section. If not, you’ll need to qualify for an investment property mortgage, which can be just as important to your affordability question as the other items on the list. After all, if you have enough money for a down payment and have identified a rental property that produces great cash flow, it doesn’t really matter unless you can obtain financing to buy it.
With that in mind, there are two main types of mortgages you can get to buy a rental property. I’ve used both, so here’s what you need to know about getting approved for each type.
Conventional financing
The term conventional mortgage is a broad one that generally refers to a loan that comes from a bank and isn’t explicitly guaranteed by a government agency. Generally, this means that the loan meets the lending standards of Fannie Mae or Freddie Mac, but it doesn’t have to. For example, a jumbo loan refers to a bank-originated mortgage that exceeds certain lending limits set by Fannie or Freddie and is very common in the investment property world.
For the purposes of this discussion, what you need to know about a conventional investment property mortgage is that you’ll need to personally qualify for the loan. These generally cannot be made to any other type of entity, such as an LLC.
This means that your personal credit, income, employment history, and assets will need to be sufficient to justify the loan. You can consider some of the property’s expected rental income for qualification purposes, but for the most part, your personal qualifications are what the lender will be looking at. Where investors often run into trouble is if the investment property’s mortgage payment would make your debt-to-income (DTI) ratio too high for the lender’s standards.
Asset-based lending
As the name implies, an asset-based loan is mainly dependent on the underlying asset — in this case, the rental property you’re attempting to buy.
To be clear, you’ll still typically need to meet the lender’s credit standards. However, the loan approval isn’t dependent on your personal income or employment qualifications. The last time I obtained an asset-based investment property loan, my lender didn’t even ask to see my tax returns or any other income documentation.
On the contrary, the main qualification is whether the rental property you want to buy will deliver enough cash flow to justify the mortgage. Asset-based lenders use a metric known as the debt service coverage ratio, or DSCR, when evaluating loan applications. This is the estimated rental income expressed as a multiple of the monthly mortgage payment including taxes and insurance. For example, if an asset-based lender requires a DSCR of 1.3, this means that if your mortgage payment will be $1,000, the property needs to bring in a rental income of $1,300.
In addition to ignoring your personal DTI ratio, another big advantage of asset-based investment property loans is that they don’t need to be made to you as an individual. In fact, many asset-based lenders prefer to loan to an LLC.
To be clear, asset-based loans tend to be more costly than conventional loans. In my experience, conventional investment property loans tend to have interest rates of 0.50%-0.75% higher than the average primary residence rate, but the premium is typically 2% or more on an asset-based loan. Still, these can be great ways to finance investment properties in many cases as long as the property still generates positive cash flow despite the higher cost of the loan.
House hacking can be an alternative if you can’t afford a rental property
If you can’t qualify for an investment property mortgage, or don’t have an adequate down payment, you might want to consider a house hacking investment. This can be a great way for first-timers with flexible living situations to dip their toes into the rental property investing world.
Here’s the basic idea: A house hack involves buying a two- to four-unit residential property, living in one of the units, and renting out the others.
There are some big advantages to this investment strategy, mainly involving the fact that the property can be classified as your primary residence. You can obtain a mortgage with a lower down payment and favorable interest rate, for example. FHA mortgages on primary residences (even with multiple living units) can be obtained with just 3.5% down. You can also get the lower owner-occupied property tax rates that exist in many areas. And when you eventually sell the property, you may be able to exclude any capital gains from income tax.
In fact, my first real estate investment was a house hack. Shortly after we got married, my wife and I bought a duplex and lived in one side while renting out the other. The rental income covered most of the mortgage payment, so we were able to live extremely cheaply while building equity in a more valuable property than we would have purchased on our own.
To be clear, there are pros and cons to house hacking, so be sure to read our guide to house hacking to determine if it might be a good way for you to start your rental property investing journey.


