
March 31, 2021 – Real Estate Market Numbers
By Glen Bell (510) 333-4460
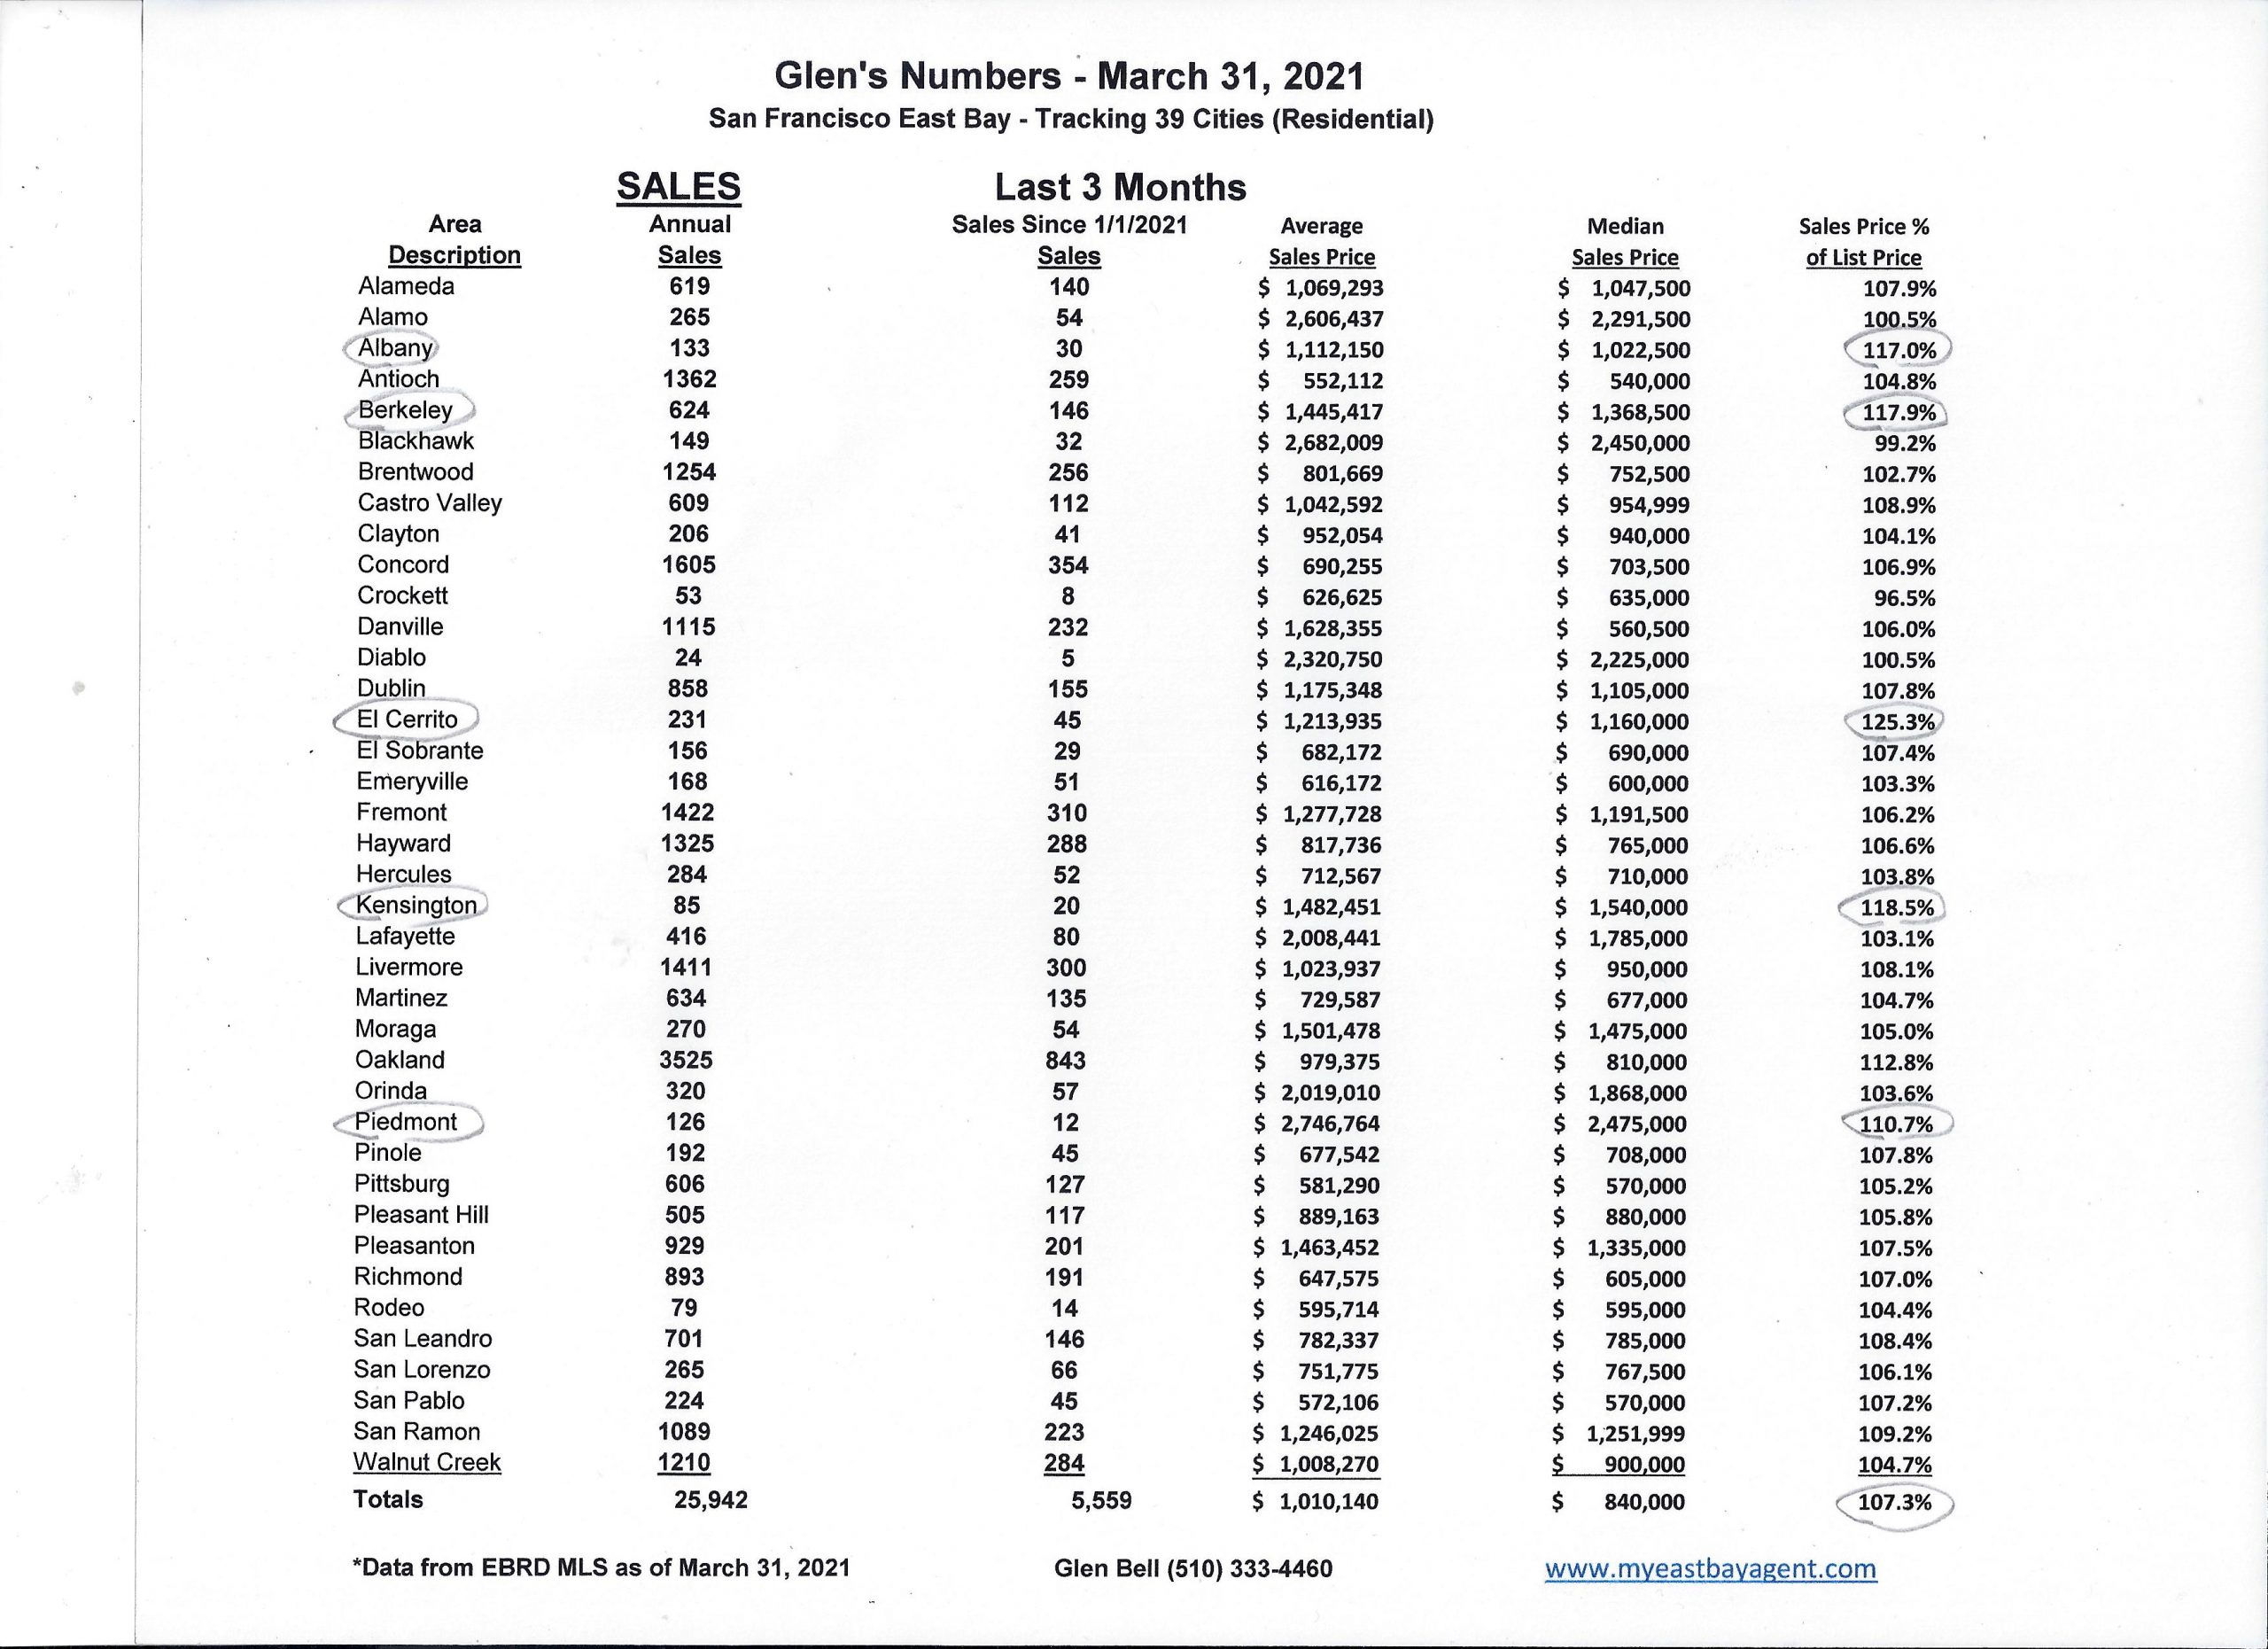
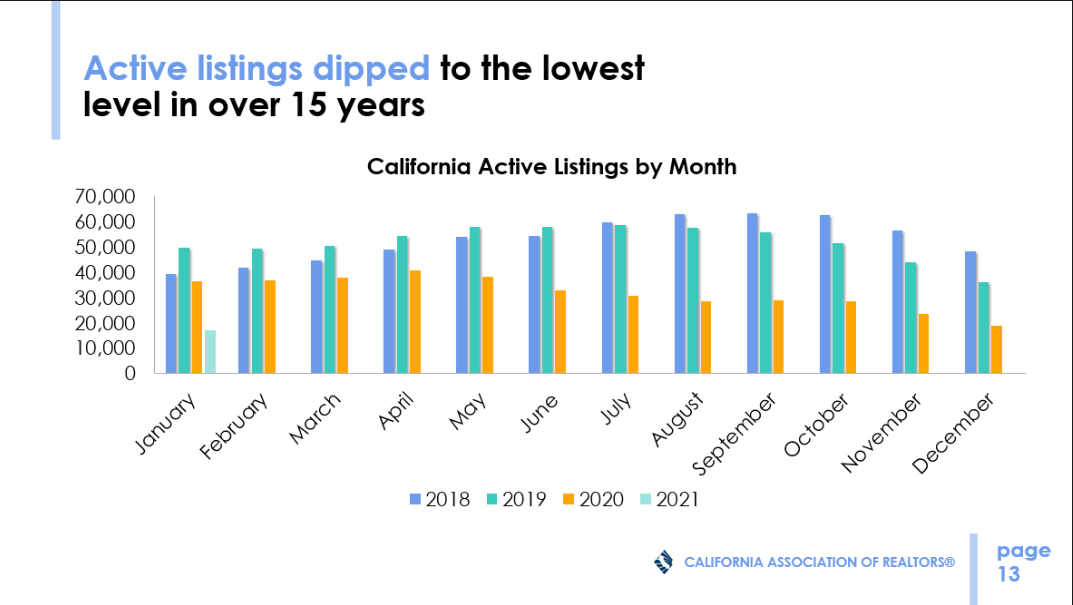
We’re seeing a very strong sellers’ market right now. It’s primarily due to our current supply and demand. Low rates and the foreseeable improvements in our economy are both driving factors. Inventory at the end of March, was the lowest that I’ve seen it for a March since I have been tracking statistics in the SF East Bay going back to 2007. Our inventory last year was low and this year it’s 20% lower in the East Bay. Demand is still there as there were a good number of homes going into contract. There just aren’t enough homes available for the number of buyers who are looking. This has triggered more competition driving prices up. That’s what you are now seeing with any of the online searches. This could change for a number of reasons, but what I’m hearing is that there won’t be much movement with interest rates for the rest of the year. So, I expect a strong sellers’ market to continue with maybe a bit of a slowdown later this year.
Our inventory really didn’t change much from last month. That’s unusual for March because we normally see a sizable increase. We have an 18 day supply of homes for sale today. Last year at this time, there was a 24 day supply. I suspect that although homes are coming onto the market, most are getting snapped up quickly. Pendings did increase by approximately 17%. Compared to last year at this time, it’s up a whopping 55%.
The pending/active ratio has been a benchmark that we’ve used as a measure of supply and demand to determine whether we’re in a buyer’s or a seller’s market. Typically, a number well above 1, (more inventory, or supply with fewer pendings, or demand) favors sellers. A number below 1 favors buyers. It’s reached 2.47 indicating a strong “sellers’ market.” This is the highest I’ve seen it since March of 2013. For those who remember, that was when sales started cranking up again from their big declines during the REO years beginning in 2008. Last year at the end of March, we were at 1.28.
For those agents working with buyers who have been looking, this has been a challenge. Prices have been increasing in most areas due to fierce competition. In fact, looking at the entire East Bay Area, the average sales price % over the average asking price is now at 7.3%. I checked and couldn’t find anything over 7% since I’ve been tracking this statistic. Last year at this time, we were at 2.6%.
Markets have traditionally been seasonal, but that’s become less of a factor due to Covid19 influences. With more people working at home and schools having been closed, we’re starting to see a migration from the San Francisco/South Peninsula areas to our own East Bay, or the Central Valley, and even out of state. Buyers want something more affordable and with some distance from their neighbors, possibly having a yard. That’s one reason why the condo market has become soft and that there’s a movement to houses in the East Bay.
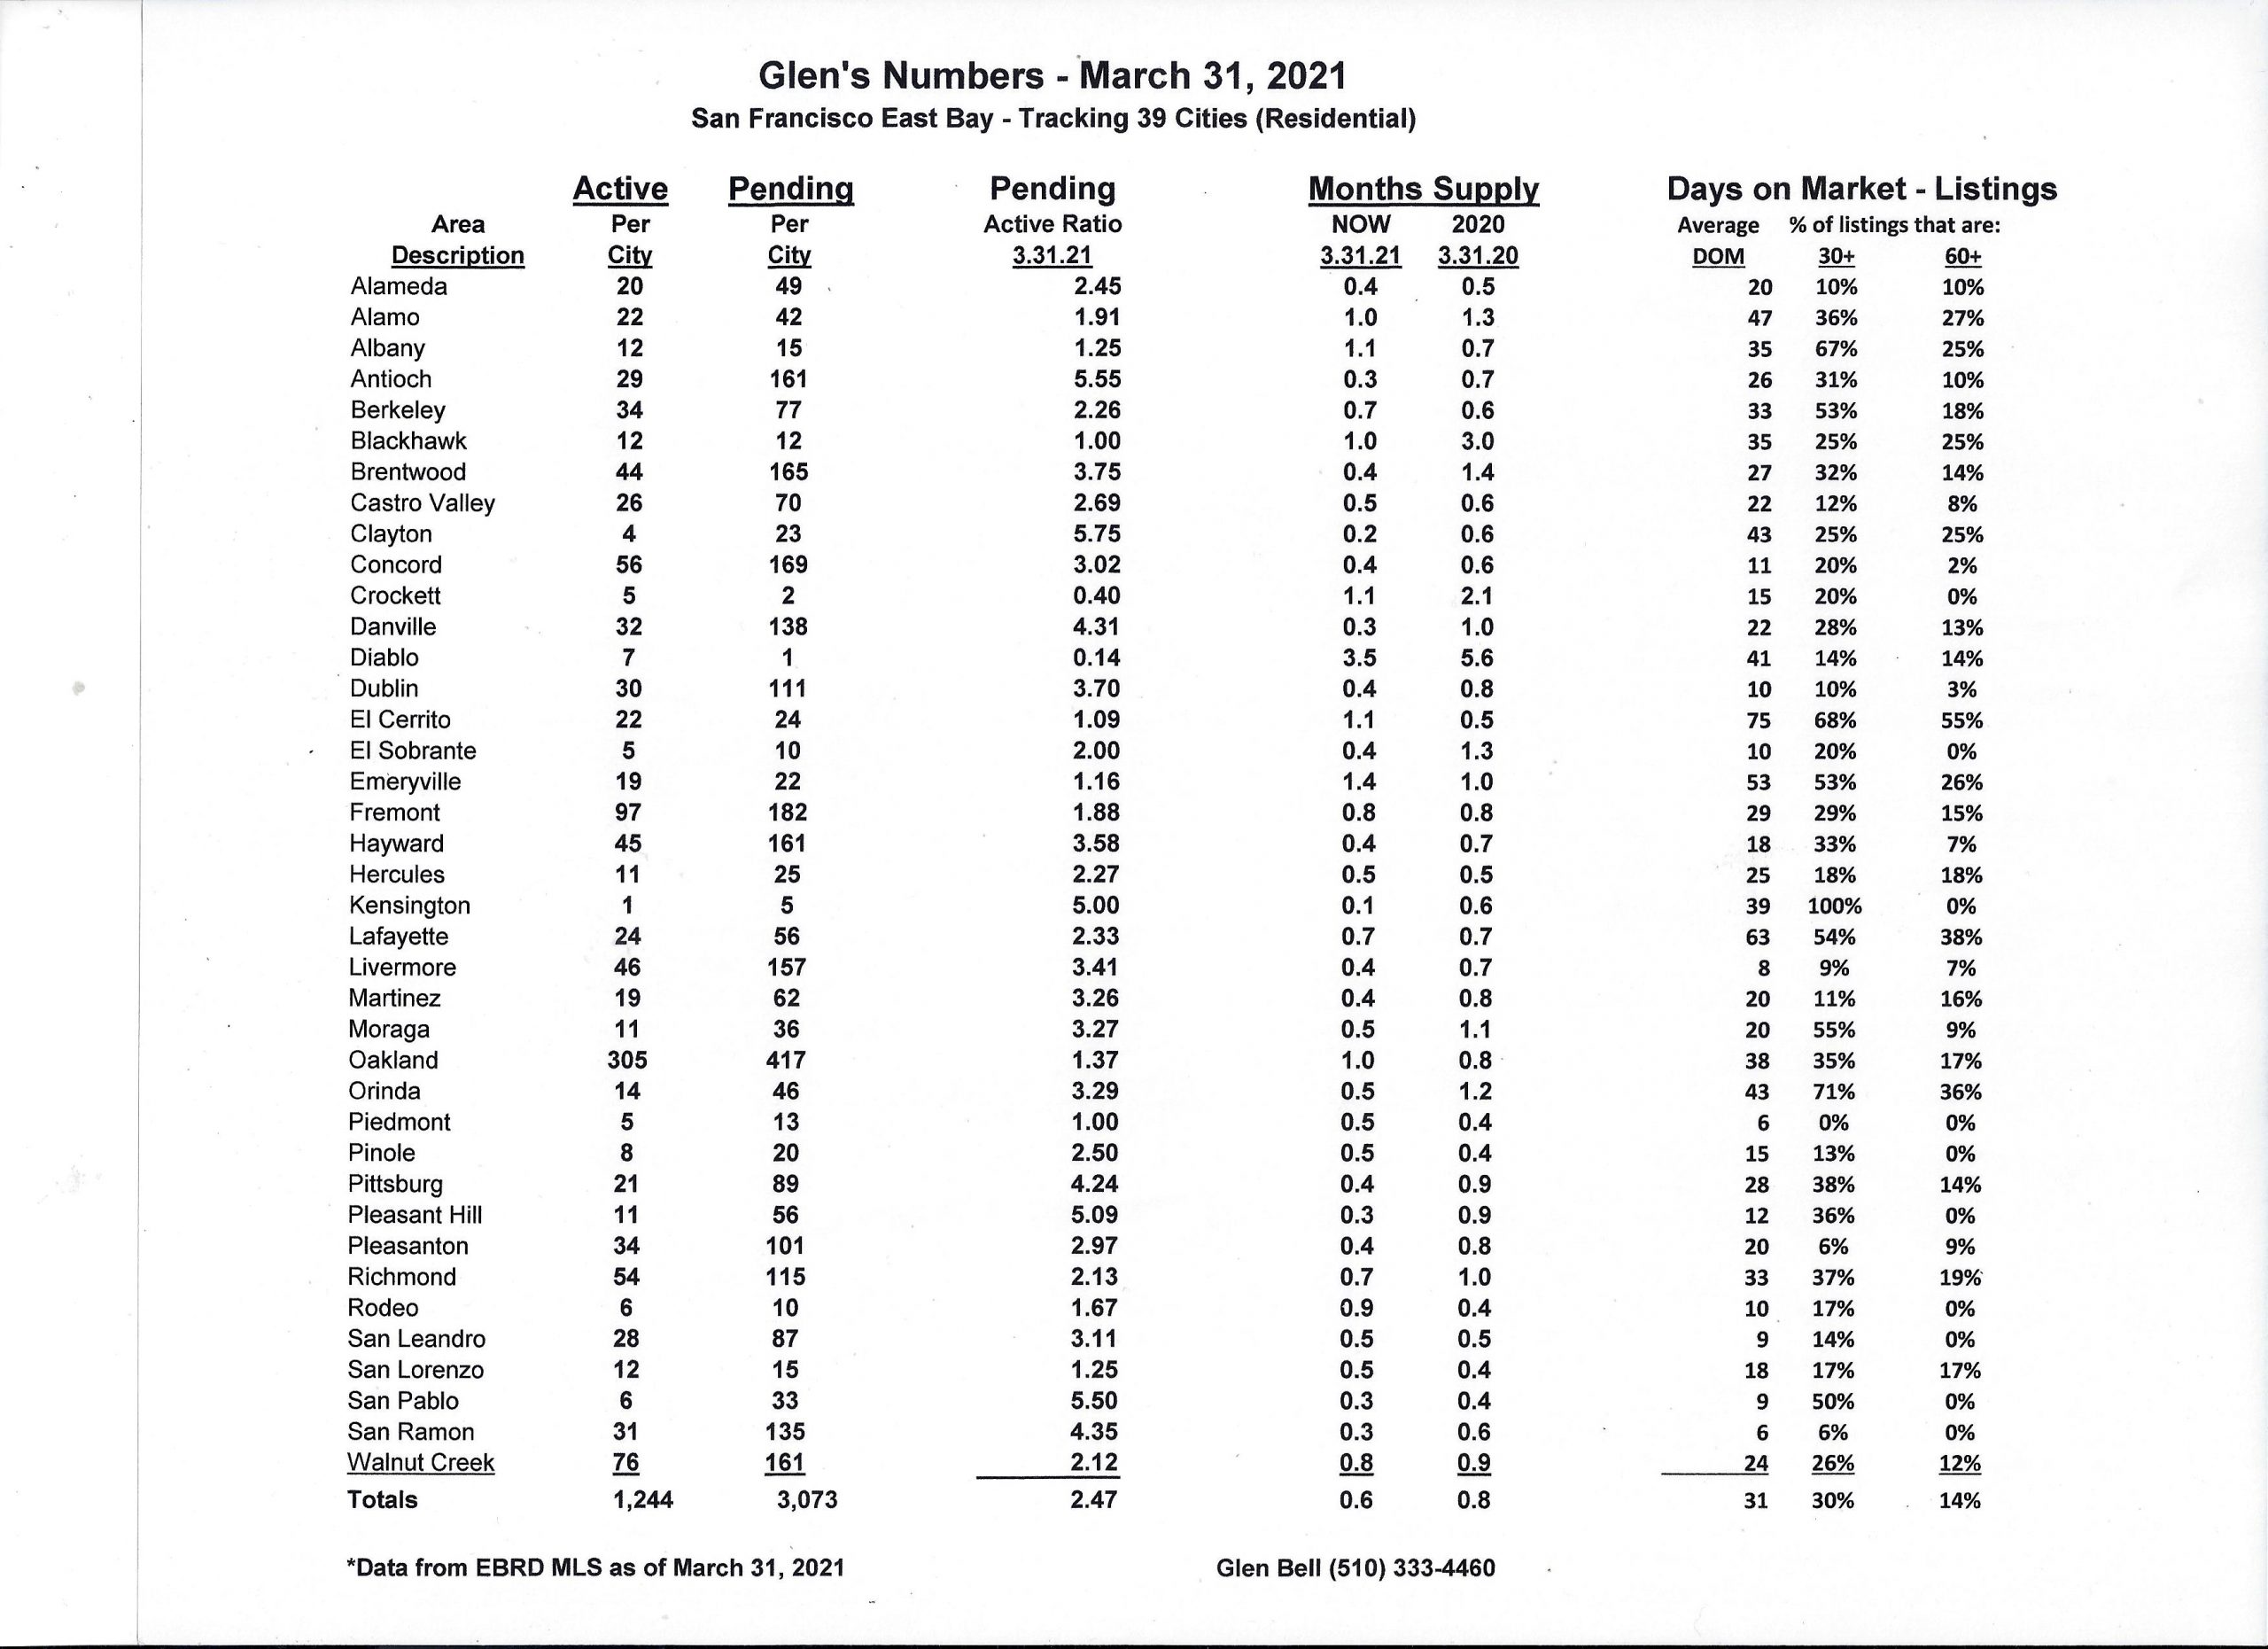
Here are some highlights for the 39 East Bay Cities that I track:
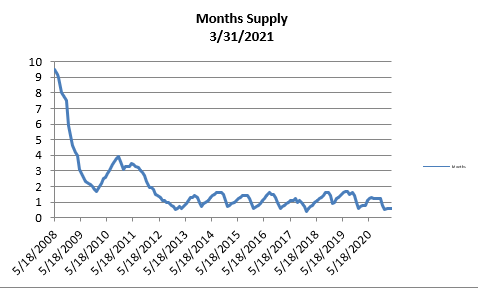
- The month’s supply for the combined 39 city area is 18 days. Historically, a 2 to 3 months’ supply is considered normal in the San Francisco East Bay Area. As you can see from the graph above, this is normally a repetitive pattern over the past four years. Supply is less when compared to last year at this time, of 24 days.
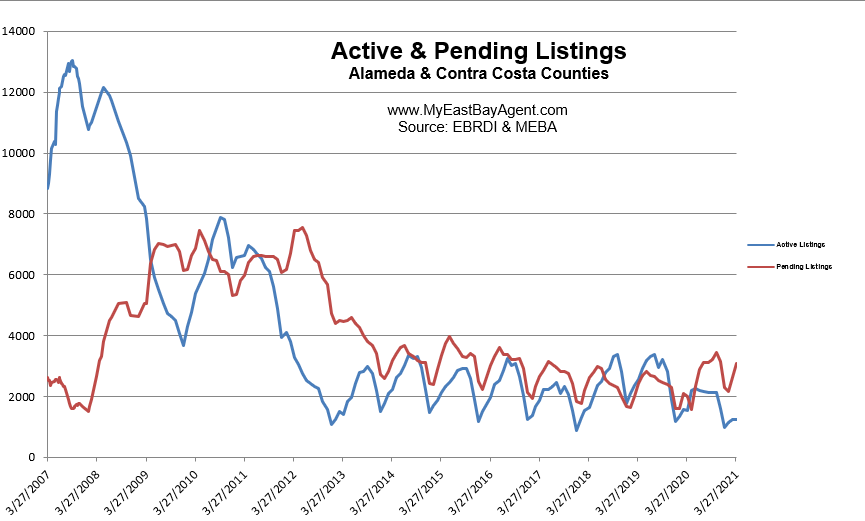
- Our inventory for the East Bay (the 39 cities tracked) is now at 1,244 homes actively for sale. This is fewer than what we saw last year at this time, of 1,552. We’re used to seeing between 3,000 and 6,000 homes in a “normal” market in the San Francisco East Bay Area. Pending sales increased slightly to 3,073, much higher than what we saw last year at this time of 1,988.
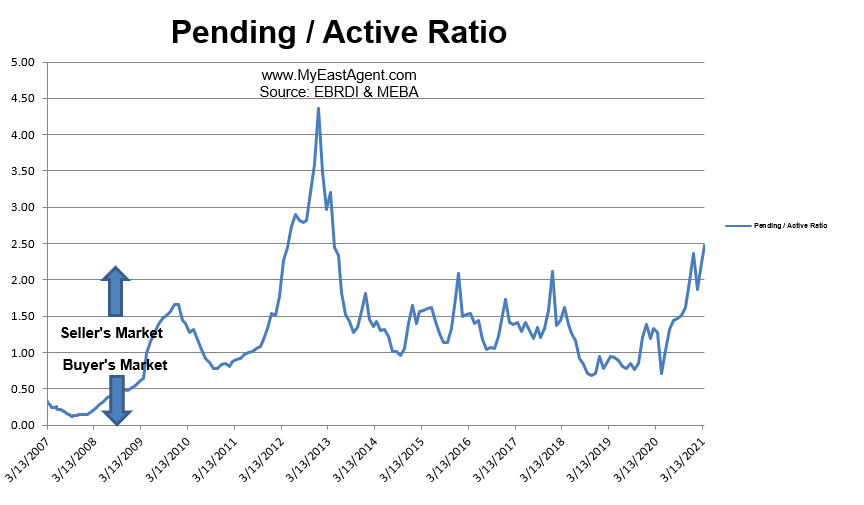
- Our Pending/Active Ratio is 2.47. Last year at this time it was 1.28.
- Sales over the last 3 months, on average, are 7.3% over the asking price for this area, much higher than what we saw last year at this time, of 2.6%.
Recent News
C.A.R. Housing Market Forecast
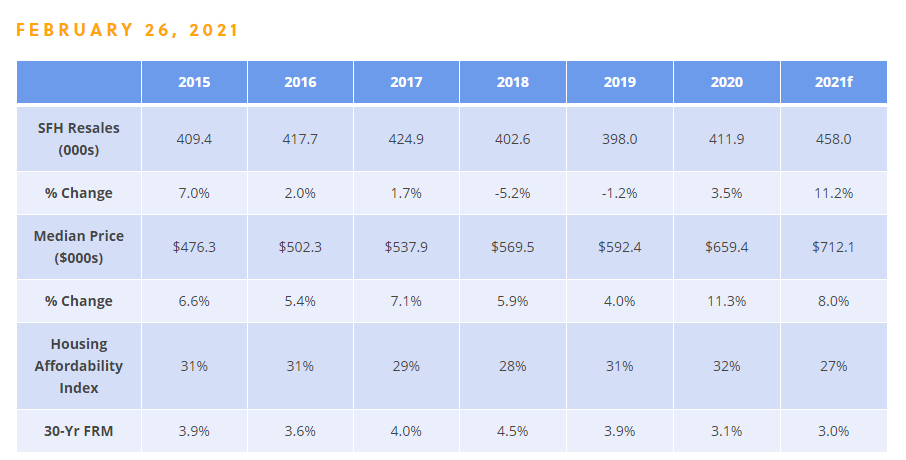
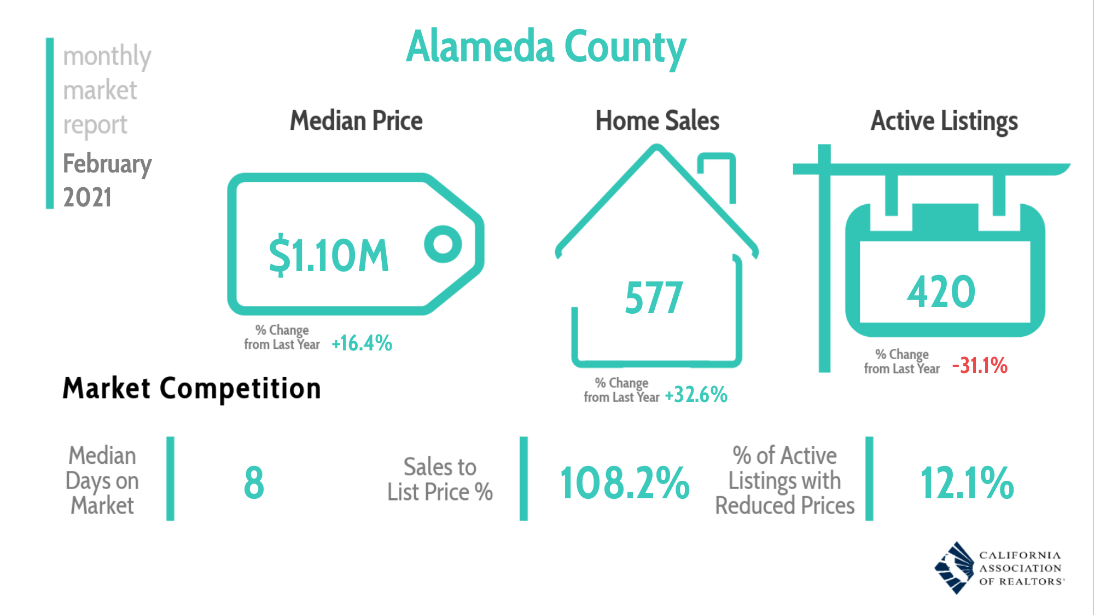
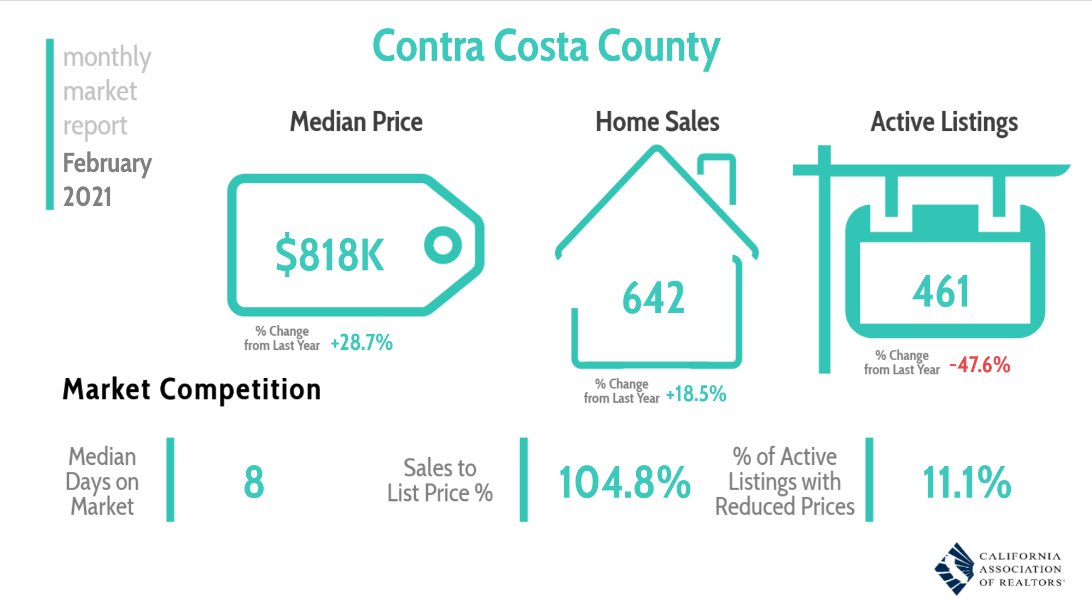
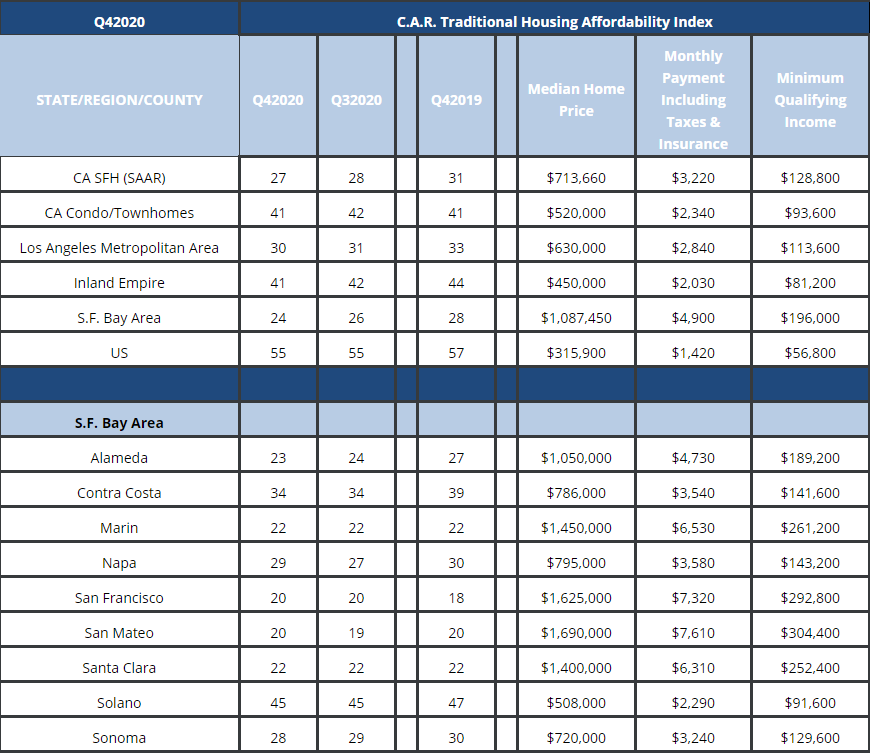
C.A.R.’s Housing Affordability Index (HAI) measures the percentage of households that can afford to purchase a median-priced, single-family home in California. C.A.R. also reports affordability indices for regions and select counties within the state. The index is considered the most fundamental measure of housing well-being for home buyers in the state.
CAR Market Minute – April 5, 2021
As we enter the traditional home buying season, REALTORS® remain upbeat about the current housing market conditions. There are reasons to feel good about the market, despite rates rising high in recent weeks. With a strong growth in employment in March and a surge in consumer confidence to the highest level in the year, the economy is slowly recovering and life is hopefully getting back to somewhat “normal” in the second half of the year. Tight supply, however, remains a concern as it continues to hold back demand and continues to put pressure on affordability.
REALTORS® Feel Upbeat about the Market: California REALTORS® felt positive about the market as we entered the month of April. More than half (54.7%) of them expected sales to improve in the upcoming week, while nearly seven out of ten believed prices to increase from the prior week. Both measures reached the highest level since C.A.R. started tracking members’ weekly market sentiment in July 2020. Those who had a listing appointment also hit the highest level (40.4%) since late August, and 49 percent think active listings will rise in the upcoming week.
Pending Home Sales Hold back by Tight Supply: U.S. pending home sales dipped slightly by 0.5 percent from a year ago after eight consecutive months of year-over-year gains, according to the National Association of Realtors® (NAR). Tight housing inventory was the primary reason for the slowdown, as there were just 1.03 million homes for sale at the end of February, a 29.5 percent decline compared to a year ago. On a month-to-month basis, pending home sales were down 10.6 percent in February with all regions showing a decline.
Consumer Confidence Hits One-Year High: Consumer confidence in the U.S. surged in March and reached the highest level since the pandemic started a year ago. The index increased to 109.7 in March from 90.4 in February and was the third consecutive month with a gain from the prior month. The higher-than-expected number surpassed even the top-end of most forecasts by a sizable margin. Government fiscal stimulus, lower number of COVID cases, continued success in vaccine roll outs, and the reopening of businesses were all contributing factors to the optimism. While the index remains below a pre-pandemic level posted in February of last year, the increase in optimism is an encouraging sign that we are moving in the right direction.
Job Market Continues to Make Progress: With success in vaccine roll outs improving public health and easing COVID restrictions, economic activities started picking up and firms began ramp up hiring to meet increased consumer demand. Employers added 916k in March as the recovery gained momentum, easily beating consensus expectations. Hiring last month was broad based with almost all major industry reporting gains. Unemployment rate declined 0.2 percentage point to 6.0 percent in March 2021, the lowest since twelve months ago. While the unemployment rate is still above the pre-pandemic level and there is still a lot of ground to recover, the labor market is showing signs of a faster recovery than previously anticipated.
Mortgage Applications Moderate in Recent Weeks but Remain Elevated: With higher rates cooling refinancing activity, mortgage applications decreased 2.2 percent from one week earlier. The Purchase Index decreased 1 percent compared to the prior week but was 39 percent higher than the same week one year ago, as purchase activity dropped sharply due to the pandemic. The refinance share of mortgage activity dipped 3 percent on a week-to-week basis and was 32 percent down from the same week of last year. Refinance activity continued to pull back, as the pool of borrowers who can benefit from a refinance further shrinks with recent rate hikes.
Construction Spending Declines in February but Still Up over the Year: Severe weather have damped construction activity during February, as total construction spending fell 0.8 percent. On a year-over-year basis though, total spending is up 2.3 percent. Residential spending registered a decline of -0.2% from the prior month but was up a robust 21.1 percent from a year ago. Single-family expenditures inches up 0.1 percent during the month, while multifamily dipped 1.4 percent.
Asking prices of newly listed homes reach all-time high
Buyers becoming discouraged amid high homes prices and bidding wars
HousingWire, April 2, 2021, 1:14 pm By Tim Glaze
Home prices are sky-high, and a recent report from Redfin underlines that point with some staggering data.
Median home-sale prices increased 17% year-over-year to $335,613 – a record high, per data taken from more than 400 metro areas during the four-week period ending March 28, 2021. And asking prices of newly listed homes rose 14% year-over-year to $353,500, another all-time high.
Pending home sales were up 38% from the same period in 2020 — and up 28% from the same period 2019 — but pending sales grew just 0.9% from Redfin’s previous four-week report.
Sales in general are still high, per Redfin Chief Economist Daryl Fairweather — 59% of homes that went under contract in the current four-week period had an accepted offer within the first two weeks on the market — but the recent low numbers suggest some homebuyers have reached their limit on high home prices and bidding wars.
“Add to the mix a dwindling number of homes for sale and rising mortgage rates, and the typical family that is still searching for an affordable house may have missed the boat,” Fairweather said. “First-time homebuyers who were already stretching their budgets will have to make bigger compromises on size and location or resign to renting for another year.”
Active listings fell 42% according to the report, spurring would-be buyers to submit offers that are significantly over asking price and making the market difficult to navigate for first-time homebuyers and other price-conscious buyers. Redfin reported that 47% of homes that went under contract in the current four-week period had an accepted offer within one week of hitting the market – yet another all-time high. And 41% of homes sold for more than their listed home price, which was 16 percentage points higher year-over-year.
Fairweather’s suggestion for those would-be buyers: look at condominiums and other more realistic purchases, build some equity, and wait this out.
“[President Joseph Biden’s] infrastructure plan aims to incentivize zoning for multifamily homes, which could increase the supply of affordable homes and provide even more people a path to homeownership,” Fairweather said. “But, there is no guarantee the incentives would be enough for local governments to change their zoning practices.”
The aforementioned infrastructure plan, dubbed the American Jobs Plan, aims to inject $213 billion into housing with the building of 500,000 homes in low- and middle-income areas. And two million affordable homes and commercial buildings would be built and renovated over the next decade as part of the initiative.


 Facebook
 X
X
 Pinterest
 Copy Link

