Facebook
 X
X
 Pinterest
 Copy Link

November 30, 2022 – Real Estate Market Numbers
By Glen Bell (510) 333-4460
I think you have to look at the whole year to understand the market we’re in and how interest rates are factoring in.
We started the year out with the lowest inventory that I’ve seen in the last 20 years. The lack of inventory, while still experiencing lower interest rates, caused a crazy competitive market this last spring that just wasn’t expected by most economists. Most had projected single digit appreciation for 2022. It was a bit of a frenzy that drove the median prices up in Alameda County by 26%, to their peaks in May. Keep in mind that “fear” and “greed,” (similar to what we see in the stock market), are two driving principals in our market place. Buyers were scrambling to “get in” creating a crazy hyper competitive market that drove prices up. The negative news didn’t come into play until after the first quarter.
High inflation and economy concerns
Rapid interest rate increases
stock market declines
News of local lay-offs
Talk of a coming recession
Buyer fatigue
All of this has contributed to the uncertainty in our Bay Area Real Estate markets. Many buyers simply “paused” and got on the fence about buying. We began seeing a cool down starting as early as June. Properties are staying on the market longer, there are more price reductions, there are fewer multiple offers, sales are down, and prices have come back to where they began at the beginning of the year.
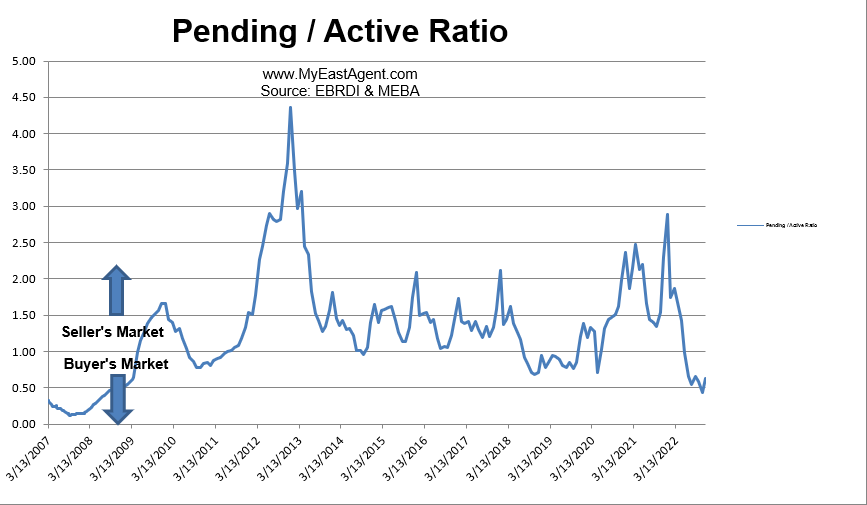
Unrealistic expectations by many sellers based on prices seen during the peak in May further contributed to the decline we’re experiencing now in our market. For the first time in years, we’re seeing a real shift from a strong sellers market to one that is now favoring buyers. Since June, our supply and demand ratio, (or pending over actives) has been below one. The pending/active ratio has been a benchmark that we’ve used as a measure of supply and demand to determine whether we’re in a buyer’s or a seller’s market. Typically, a number well above 1, (less inventory, or supply, with more pending sales, or demand) favors sellers. While numbers below 1 (more inventory, or supply, with fewer pending sales, or demand) favors buyers. Last year at this time we were still in a very strong sellers market with a ratio of 2.29. We are now experiencing a ratio of .62, indicating a buyer’s market.
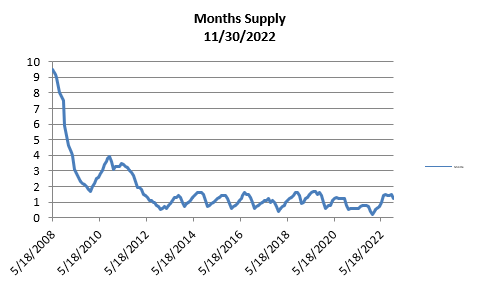
The month’s supply for the combined 39 city area is 36 days. Historically, a 2 to 3 months’ supply is considered normal in the San Francisco East Bay Area. Last year we saw a 12 day supply at this time. Yes, that’s quite a difference compared to last year but let’s put that in perspective. Inventory is still historically low. Back in 2008 during the REO days, when home prices saw big declines, we had a whopping 9.5 month supply of homes, see below graph.