


 Facebook
 X
X
 Pinterest
 Copy Link

May 31, 2021 – Real Estate Market Numbers
By Glen Bell (510) 333-4460
We’re seeing a very strong sellers’ market right now. It’s primarily due to our current supply and demand. Low rates and the foreseeable improvements in our economy are both driving factors. Inventory at the end of May, was the lowest that I’ve seen it for a May since I have been tracking statistics in the SF East Bay going back to 2007. Our inventory last year at the end of May was low and this year it’s 36% lower in the East Bay. Demand is still there as there are still a good number of homes going into contract. There just aren’t enough homes available for the number of buyers who are looking. This has triggered more competition driving prices up. That’s what you are now seeing with any of the online searches. This could change for a number of reasons, but what I’m hearing is that there won’t be much movement with interest rates for the rest of the year. So, I expect a strong sellers’ market to continue with maybe a bit of a slowdown later this year.
Our inventory really didn’t change much from last month. In fact, it’s remained relatively flat since the beginning of the year. That’s unusual because we normally see a steady increase beginning in January through fall. We have an 18 day supply of homes for sale today. Last year at this time, there was a 39 day supply. I suspect that although homes are coming onto the market to a greater degree, most are getting snapped up quickly. Pendings did increase slightly. However, compared to last year at this time, it’s up a whopping 37%.
The pending/active ratio has been a benchmark that we’ve used as a measure of supply and demand to determine whether we’re in a buyer’s or a seller’s market. Typically, a number well above 1, (more inventory, or supply with fewer pendings, or demand) favors sellers. A number below 1 favors buyers. It’s currently at 2.19 indicating a strong “sellers’ market.” I rarely see this ratio go over 2 and yet it’s remained above 2 since February. For those who remember, this market resembles the one following when sales started cranking up after their big declines during the REO years beginning in 2008. Last year at the end of May, this ratio was at 1.02, (what we would consider a balanced and fairly normal market).
For those agents working with buyers who have been looking, this has been a challenge. Prices have been increasing in most areas due to fierce competition. In fact, looking at the entire East Bay Area, the average sales price % over the average asking price is now at 11%. I checked and couldn’t find anything this high since I began tracking this statistic. Last year at this time, we were at 3.1%.
Markets have traditionally been seasonal, but that’s become less of a factor due to Covid19 influences. With more people working at home and schools having been closed, we’re starting to see a migration from the San Francisco/South Peninsula areas to our own East Bay, or the Central Valley, and even out of state. Buyers want something more affordable and with some distance from their neighbors, possibly having a yard. That’s one reason why the condo market has become soft and that there’s a movement to houses in the East Bay.
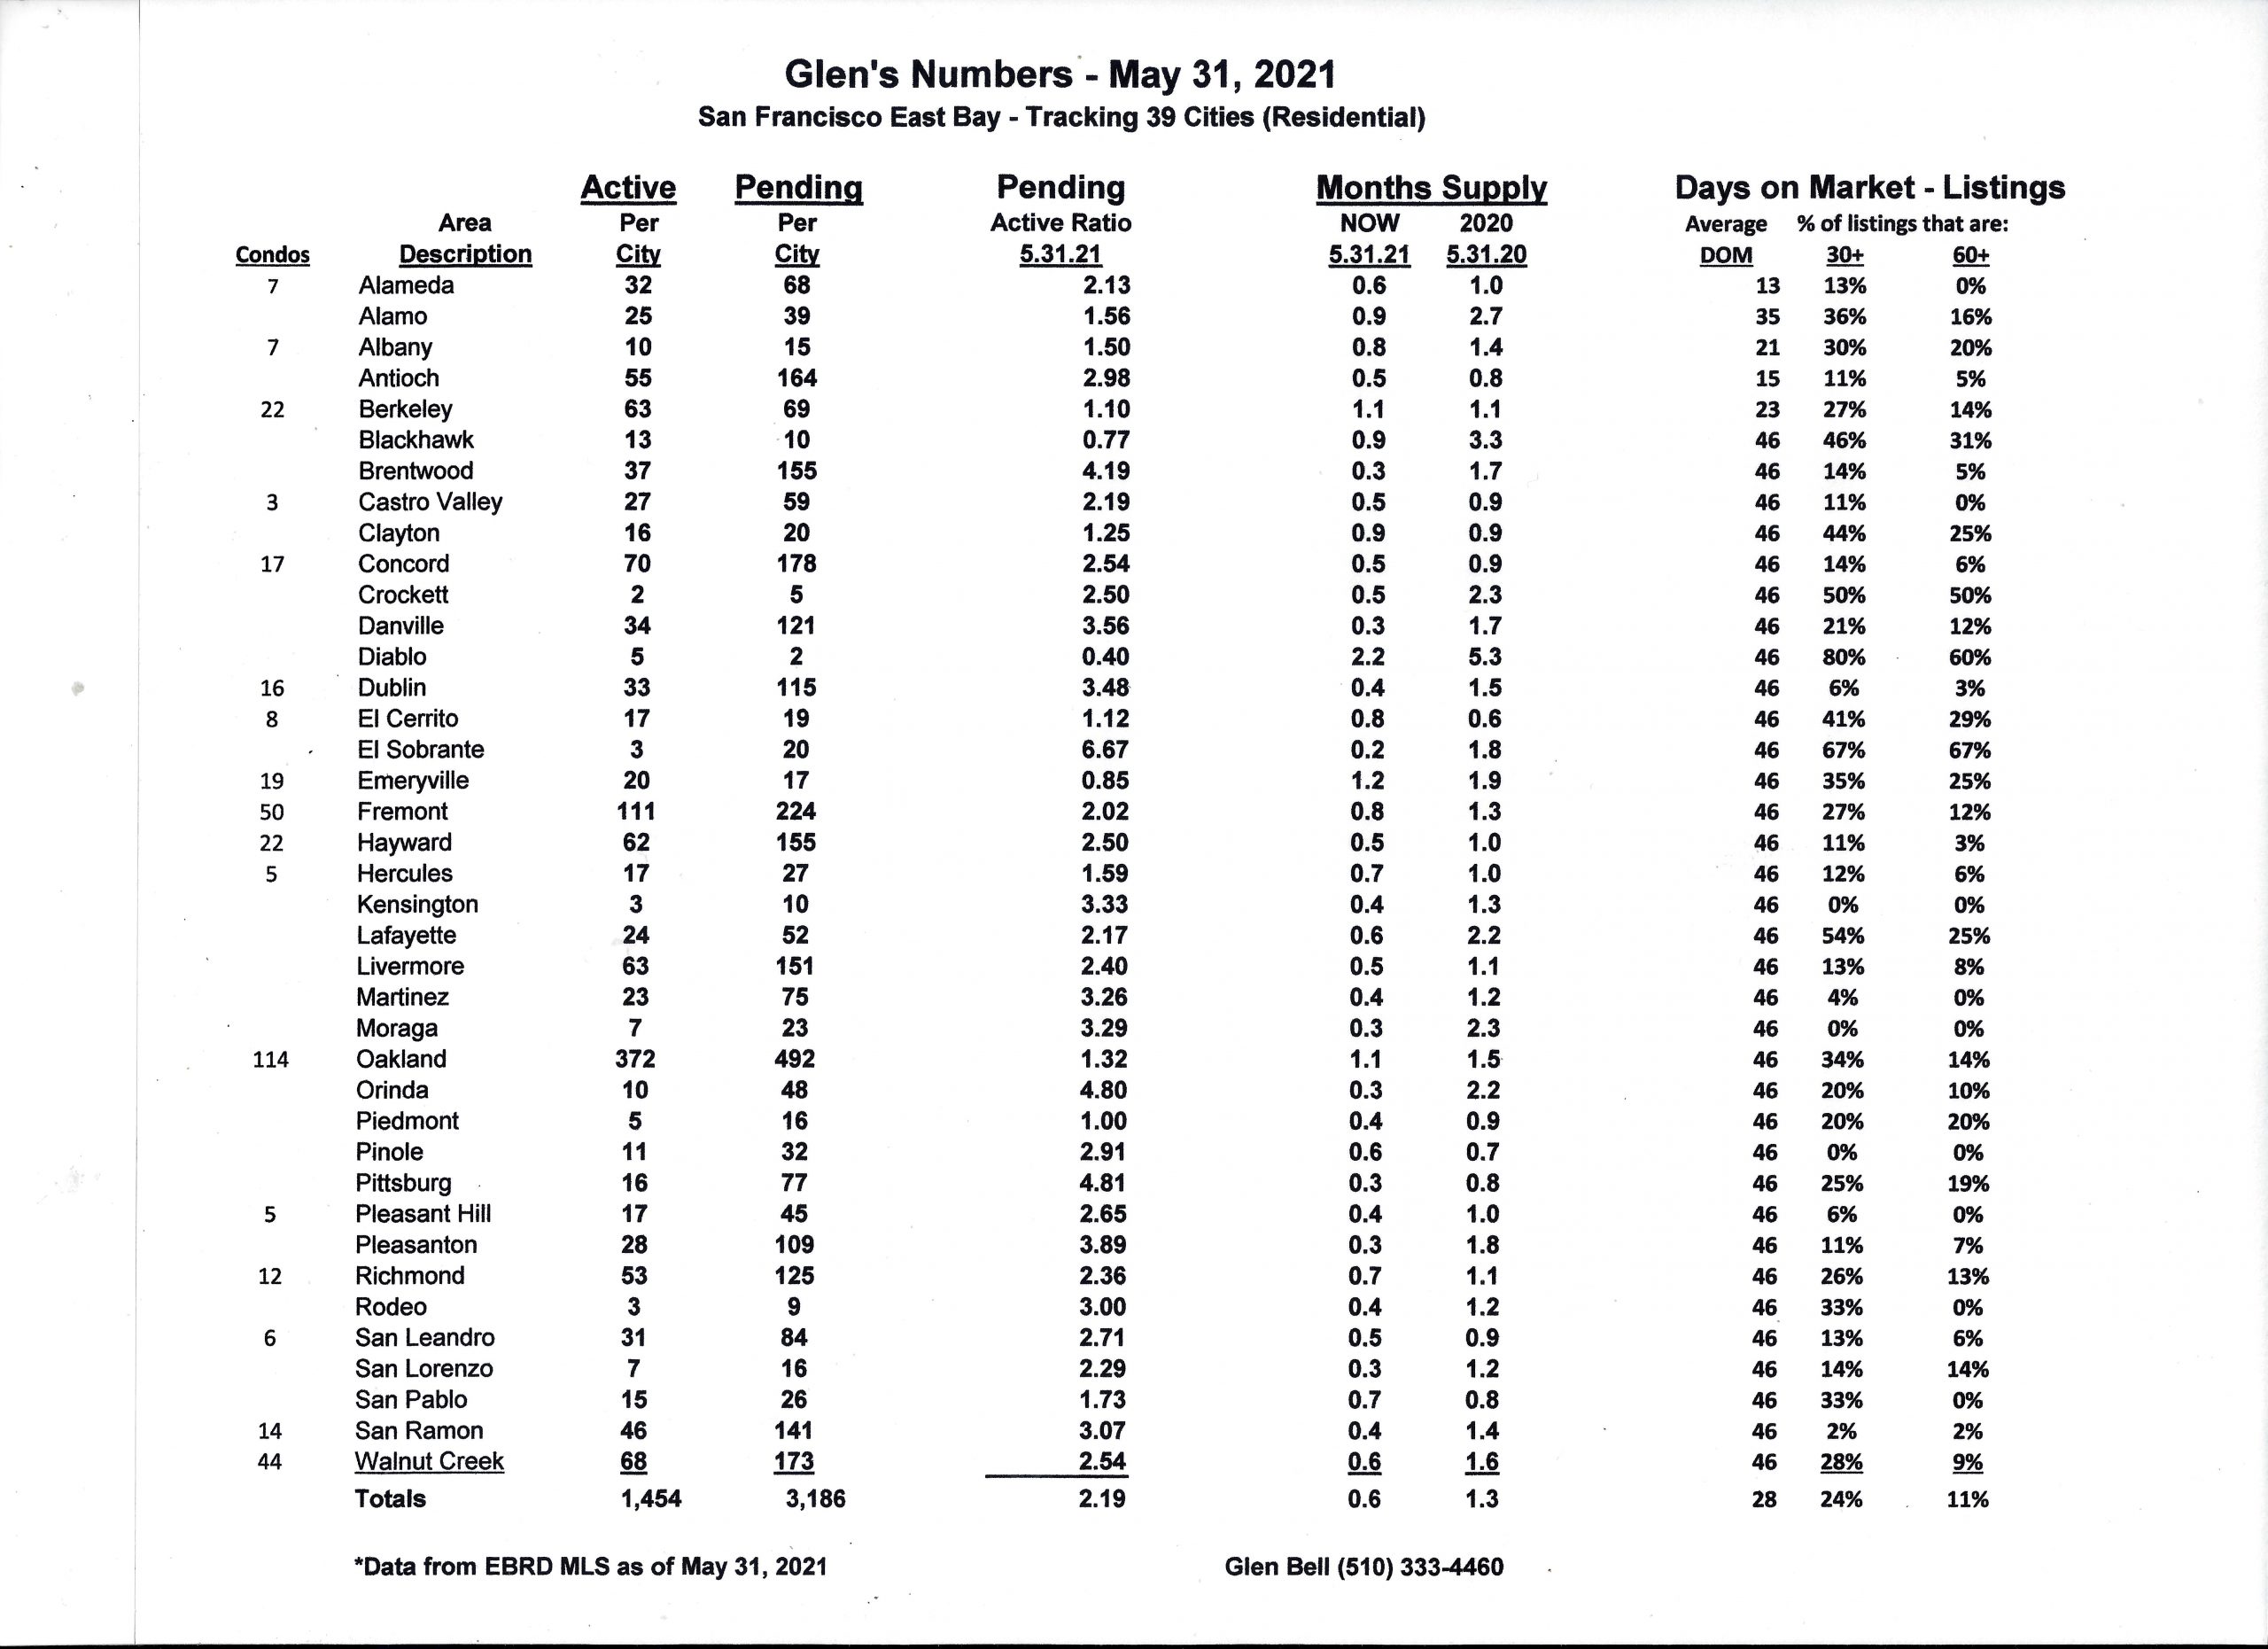
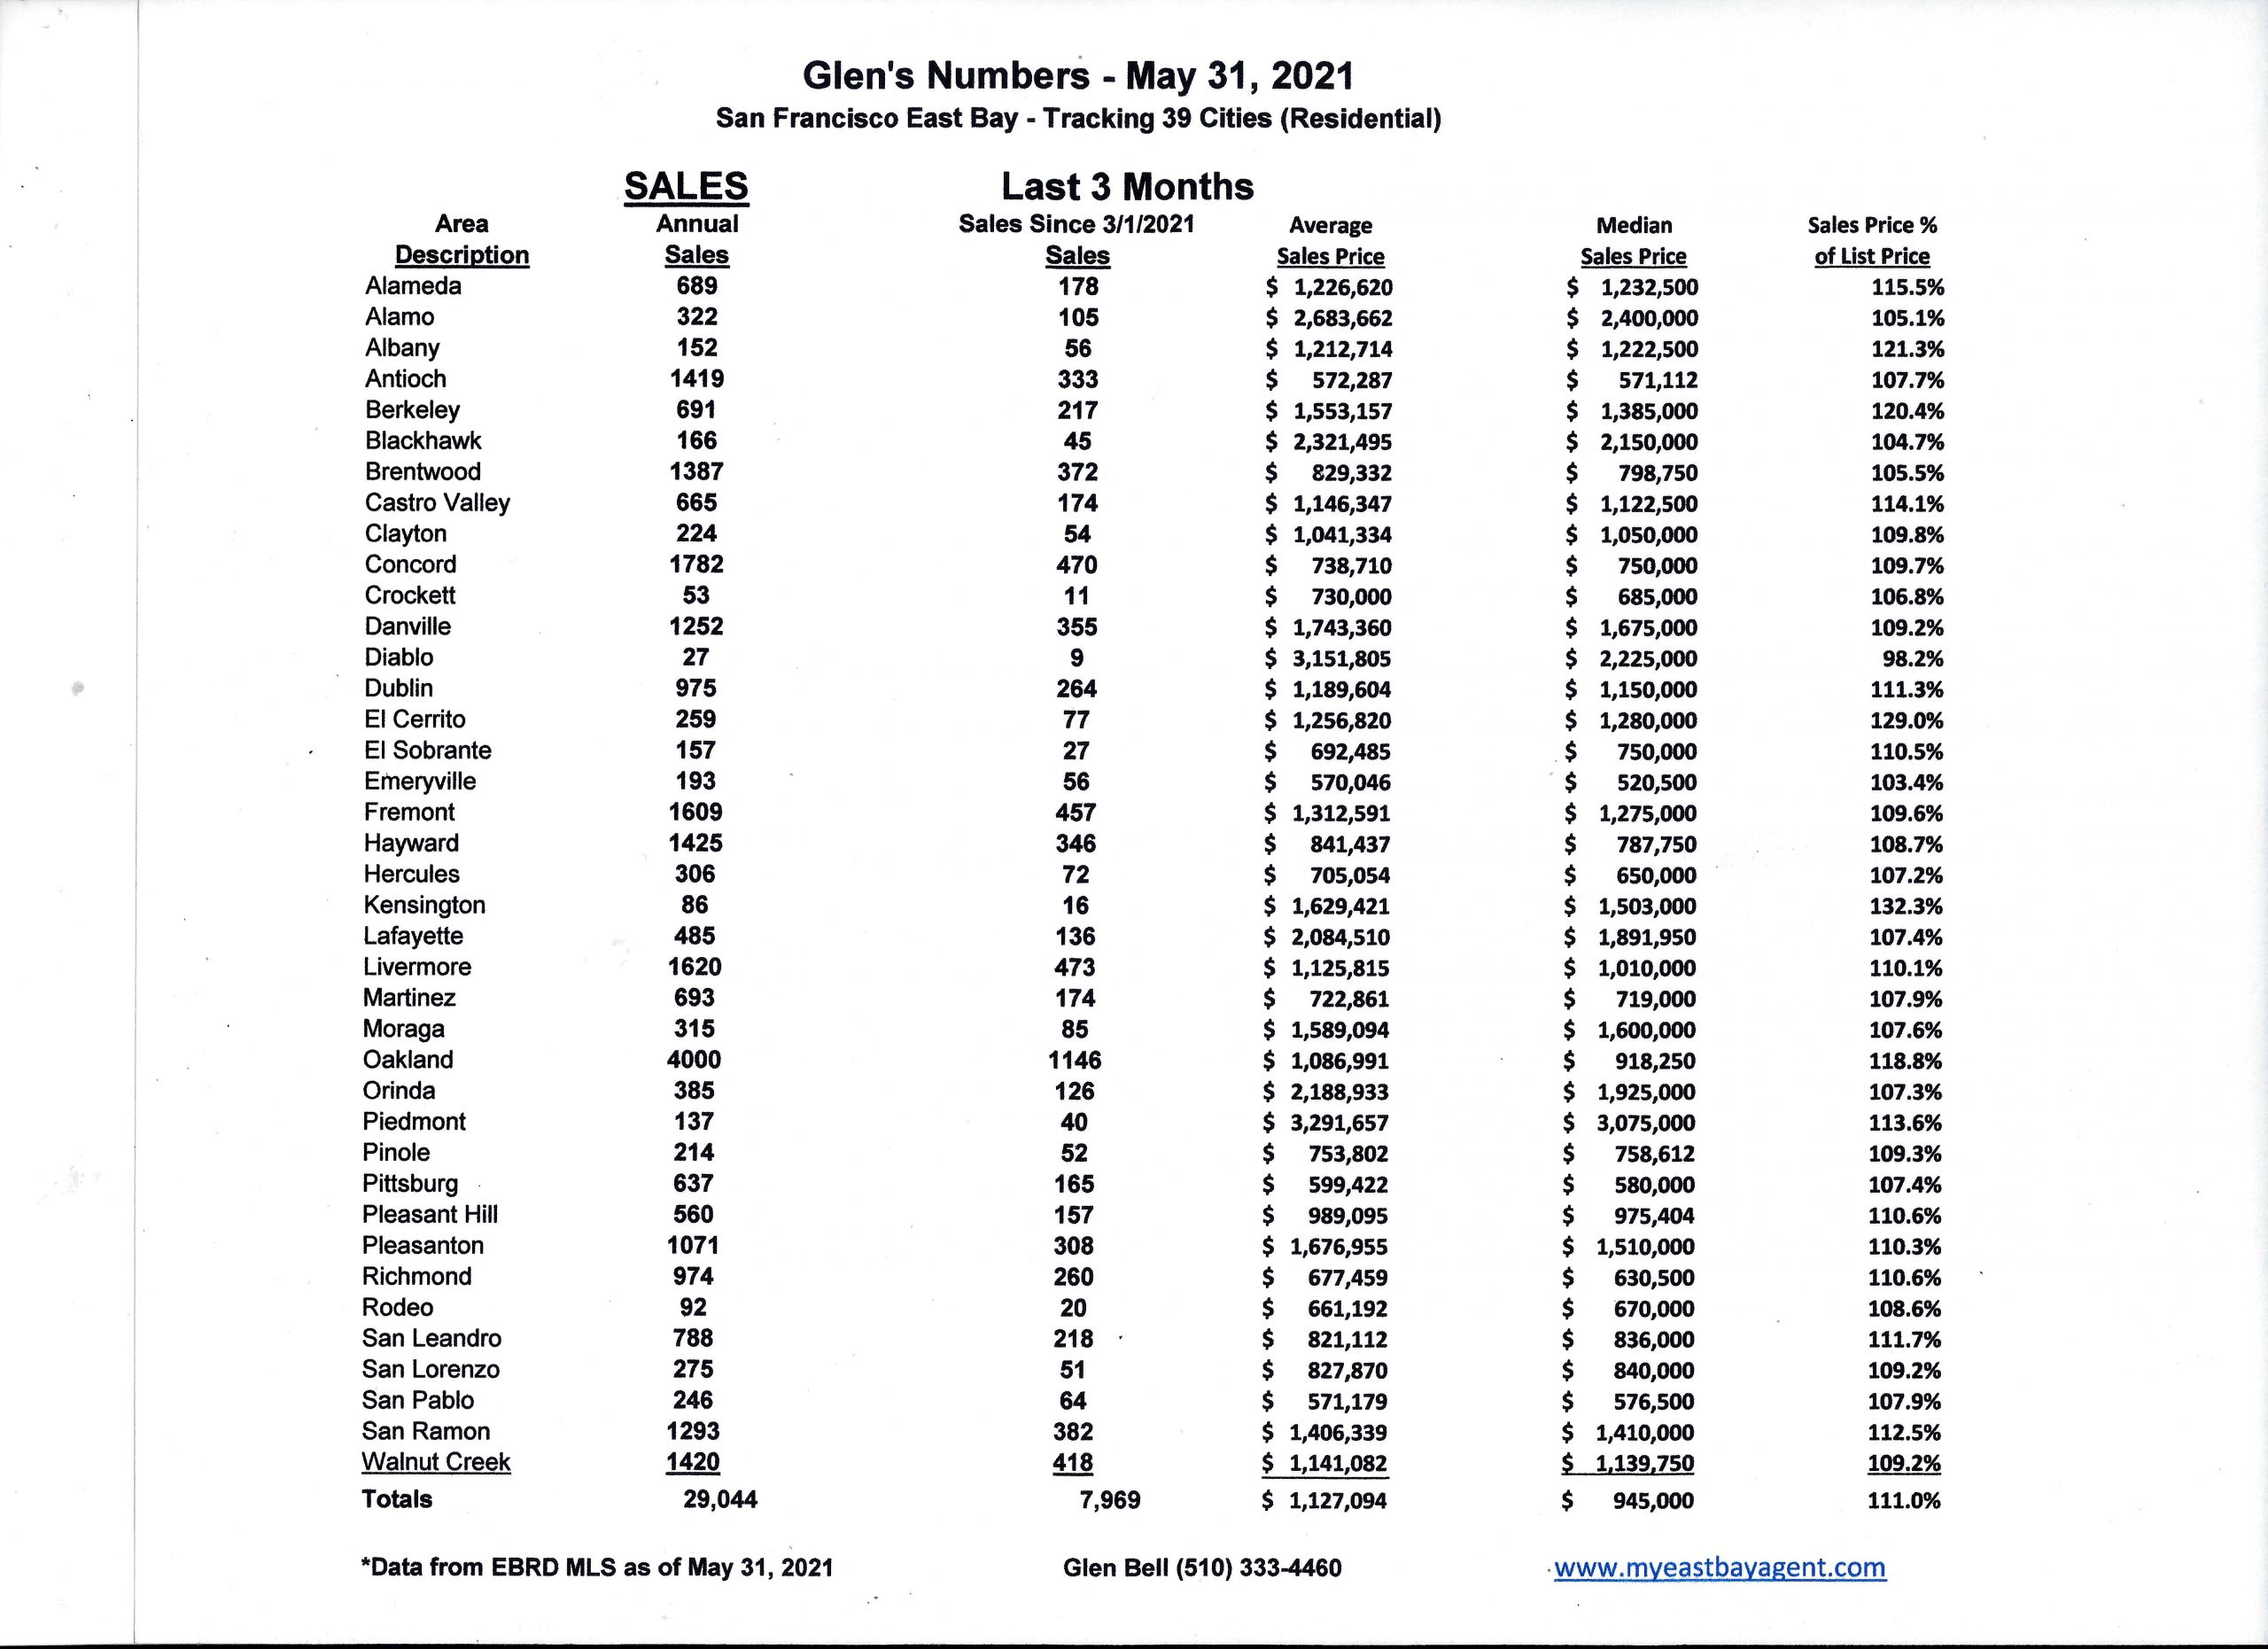
Here are some highlights for the 39 East Bay Cities that I track:
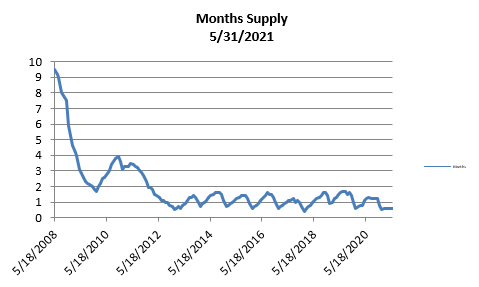
- The month’s supply for the combined 39 city area is 18 days. Historically, a 2 to 3 months’ supply is considered normal in the San Francisco East Bay Area. As you can see from the graph above, this is normally a repetitive pattern over the past four years. Supply is less when compared to last year at this time, of 39 days.
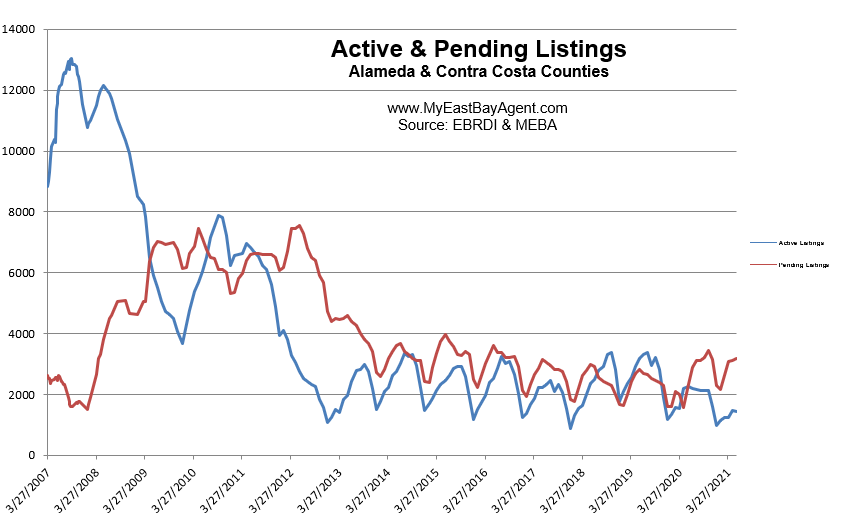
- Our inventory for the East Bay (the 39 cities tracked) is now at 1,454 homes actively for sale. This is fewer than what we saw last year at this time, of 2,275. We’re used to seeing between 3,000 and 6,000 homes in a “normal” market in the San Francisco East Bay Area. Pending sales increased slightly to 3,186, much higher than what we saw last year at this time of 2327.
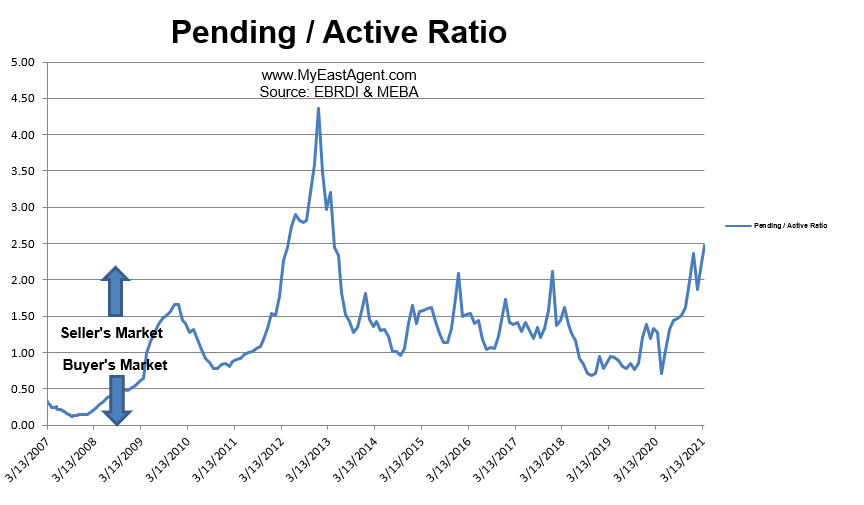
- Our Pending/Active Ratio is 2.19. Last year at this time it was 1.02.
- Sales over the last 3 months, on average, are 11% over the asking price for this area, much higher than what we saw last year at this time, of 3.1%.
Recent News
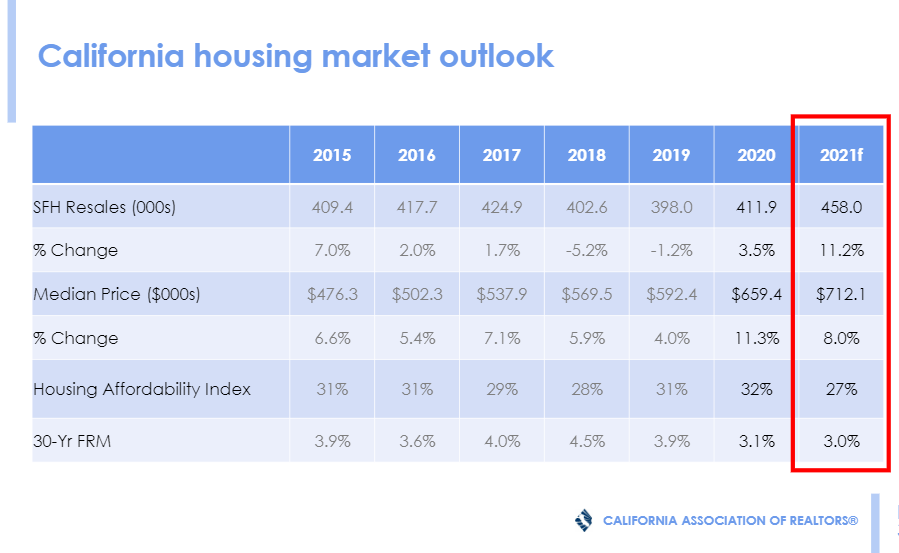
C.A.R. Housing Market Forecast as of April/27/2021
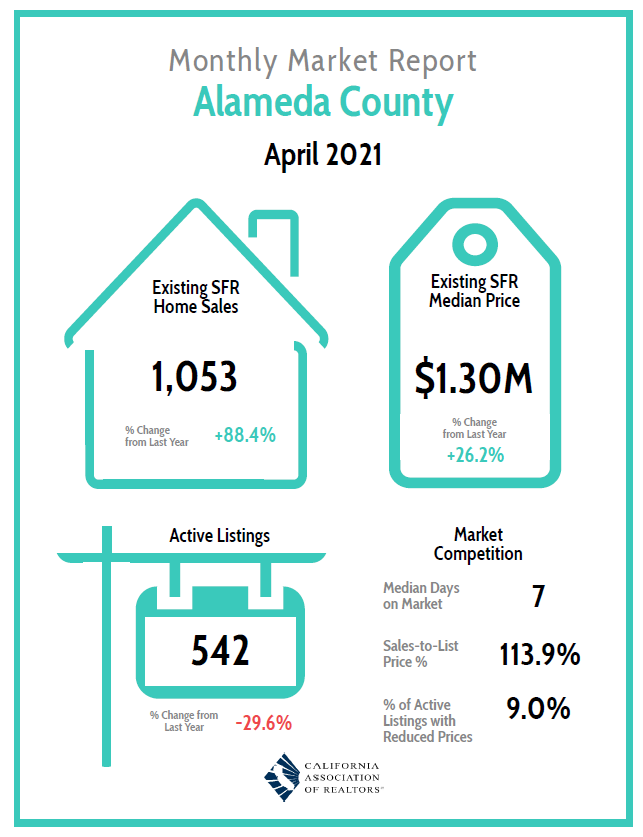
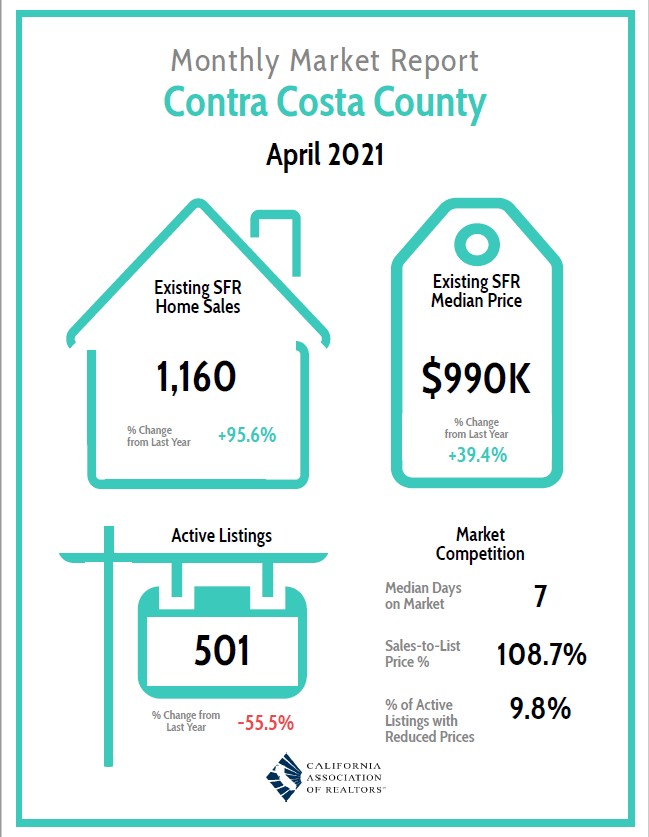
County Market Overview
CAR Market Minute – June 7, 2021
While the outlook for the economy and the market remains bright, both are encountering supply constraints as the reopening continues. Despite a surge in consumer spending and an improving job market, labor and material shortages have become hurdles that the recovery needs to overcome. As such, inflation and slower job growth remain topics of concern when discussing how fast the U.S. can get back to its pre-pandemic levels. Meanwhile, the housing market has had solid performance since the second half of 2020 but is showing signs of moderations in recent weeks. As tight supply continues to apply upward pressure on prices, the market momentum could slow as affordability issues kick in in the second half of the year.
REALTORS® See Some Market Moderations in the Week Ahead: While almost half (48.6%) of those who responded to the weekly survey expected home sales to rise in the coming week, the share has been below 50% for the fourth time in the past five weeks. Meanwhile, more REALTORS® believed that home prices might have already peaked as those who expected prices to go up declined to 58.2%, the lowest level since late January. The consistent moderations since late April suggest that the market momentum could be easing slightly going into the summer season.
Job Growth Improves but Lower than Expected: U.S. employers added 599,000 jobs last month, an increase from a revised 278,000 in April, but the gains were lower than expected. Businesses continue to struggle to fill job openings as potential workers remain on the sidelines. Factors that constrain the labor supply includes workers’ fear to go back to their jobs because of concerns about catching COVID, the disincentive effect of additional unemployment benefits, and childcare constraints as schools have not fully returned to in-person learning. With payrolls still 7.6M below the pre-pandemic level, a full recovery may not be reached until early 2023. The unemployment rate fell to 5.8% in May from 6.1% the prior month.
Rates Inch Up but Remain below 3%: The average 30-year fixed-rate mortgage (FRM) increased slightly in the first week of June but remained below the 3% threshold. Despite market concerns about rising inflation in recent weeks as the economy continues to recover, the average 30-year FRM compiled by Freddie Mac has been at or below 3% for the past seven weeks. The lower-than expected job growth figure released last Friday may have eased some of the market concerns, as the 10-year Treasury has been primarily moving side-ways since then.
Consumers Feel More Pessimistic about Homebuying: As housing affordability deteriorated further and supply shortage remained an issue, homebuyers sentiment declined to the lowest point in 32 months, according to the C.A.R. Housing Sentiment Survey. Only 19% of consumers believe it is a good time to buy a home in May 2021, a sharp drop from 25% in the prior month, and a steep decline from 31% in May 2020. With California setting another record median price in April 2021 and the corresponding mortgage payment increasing more than 30% from a year ago, potential homebuyers are feeling more pessimistic about the homebuying conditions. Meanwhile, 72% of all respondents believe it is a good time to sell, an all-time high since the survey launched in September 2018.
Home Building at Fastest Pace in Areas with Shortest Commute Times: Home building expanded the fastest in places with the shortest commute times, according to an index released by the National Association of Home Builders (NAHB). The Q121 Home Building Geography Index (HBGI) shows that single-family home building was the highest in the longest commute (top two quintiles), with a combined market share of 63.6%. The year-over-year growth rate, however, was the strongest at 22.2% in the shortest commutes (bottom quintile). So, while the longer-commute areas have a much greater market share in single-family home building, the construction growth rates were highest in the areas with shortest commute times.
S.F. condo sales hit 16-year high with ‘ferocious’ buyer demand, price discounts
By J.K. Dineen, SF Chronicle, June 7, 2021
San Francisco’s pandemic-battered condo market bounced back with a vengeance this spring, scoring its busiest three-month period in at least 16 years as vaccinated buyers rushed back into the city to take advantage of pricing that is still significantly below its 2018 highs, according to a new report from the brokerage Compass.
The San Francisco condo, tenancy-in-common and co-op market saw more than 1,300 sales in the three-month period between March and May, up from about 400 sales a year ago.
“I’ve been doing this for 30 years and I’ve never seen the ferocious buyer demand that is going on right now,” said Patrick Carlisle, chief market analyst for Compass.
San Francisco’s condo market weakened considerably during the first year of the pandemic as downtown office towers went dark, theaters shuttered and restaurants closed. Apartment buildings in the downtown neighborhoods saw a 25% drop in rents, as many young tech workers took advantage of work-from-home flexibility to return home to their parents or move into more spacious and affordable cities. Now many of those workers are plotting their return, even if their jobs will remain partially remote, Carlisle said.
The spike in interest in condos may have been in part motivated by their value compared to the roaring single-family home market. While single-family homes in San Francisco jumped about 6% year over year, — to a median price of about $1.8 million — condo prices are still off their highs. High-rise condo prices are down 9.1% from pre-pandemic highs, while mid-rise units are down 9.6% and low-rise homes are 5.2% below what they were. The median two-bedroom condo is about $1.3 million, according to Compass.
Throughout the entire Bay Area, the three-month period saw 3,969 sales of homes and condos of $2 million or more, a 103% increase from the same three-month period in 2019, according to Compass. San Francisco luxury condo and house sales — defined as over $2 million — also hit all-time highs in sales, up 50% and 70%, respectively, from previous peaks. In Contra Costa County, luxury home sales were up 220% from their previous high.
With condos still down almost 10% and single-family homes up 6% or more, “you are starting to see a bigger differential between condo and single-family home prices,” said Carlisle. “It’s likely that people are looking at that and deciding they can get more for their money” in a condo building, he said.
Tishman Speyer Senior Managing Director Carl Shannon said trade at the twisty white Jeanne Gang-designed Mira tower in downtown San Francisco is “vastly improved” over a year ago. So far this year, 50 condos have sold in the building, generating more than $75 million in sales, he said. The 391-unit tower is more than 50% sold.
“2021 has been fantastic for us,” he said. “We have seen the rate of absorption and pricing both improve dramatically. People are beginning to come back to San Francisco in a very real way. Every day and every week, the feeling on the streets downtown is better.”
Tishman Speyer recently broke ground on two new buildings at Mission Rock, across from Oracle Park. One of the buildings is pre-leased to Visa; the other will be apartments.
“I think the vaccine rollout is a huge factor in the condo market,” said Carlisle. “People are feeling better about getting into elevators and walking down hallways. Population density is no longer as much of an issue.”
Glen Bell – (510) 333-4460 jazzlines@sbcglobal.net


