Facebook
 X
X
 Pinterest
 Copy Link

August 31, 2019 – Real Estate Market Numbers
By Glen Bell (510) 333-4460
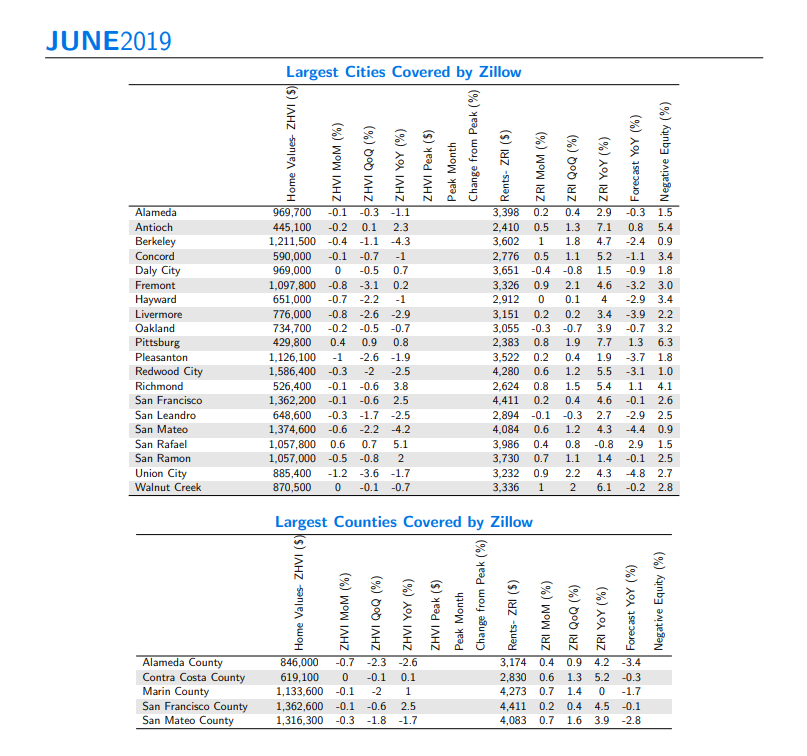
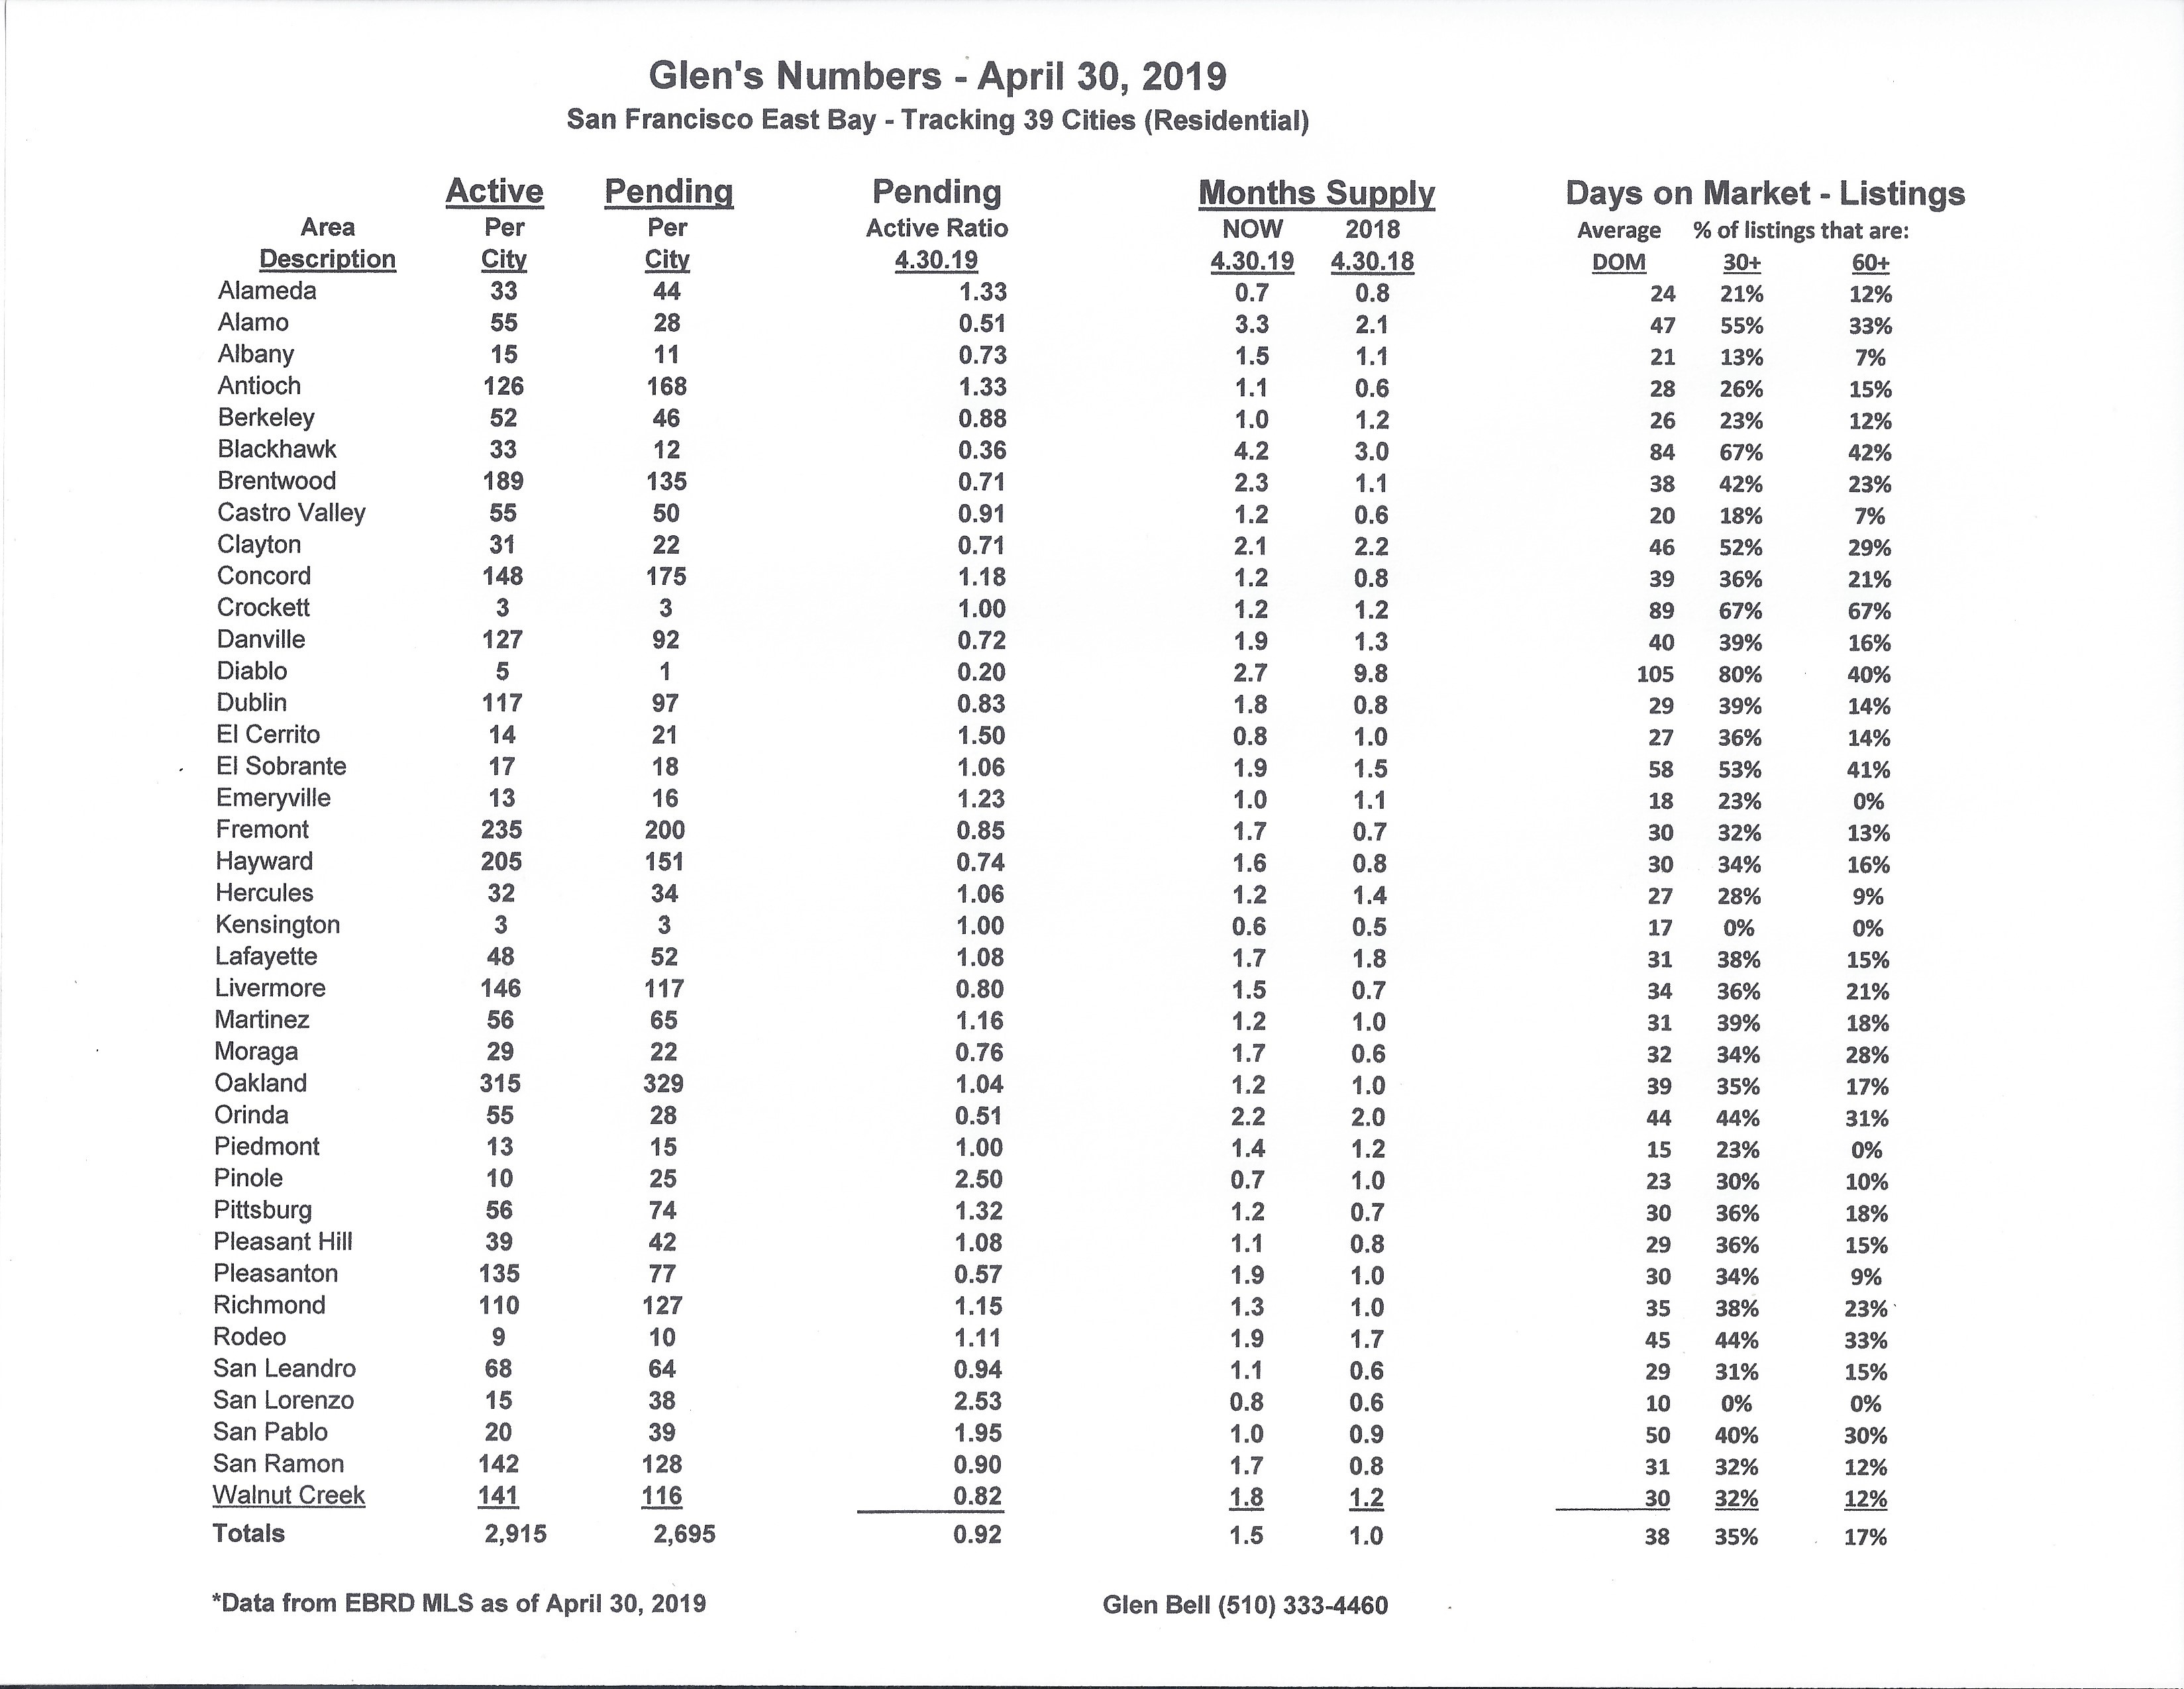
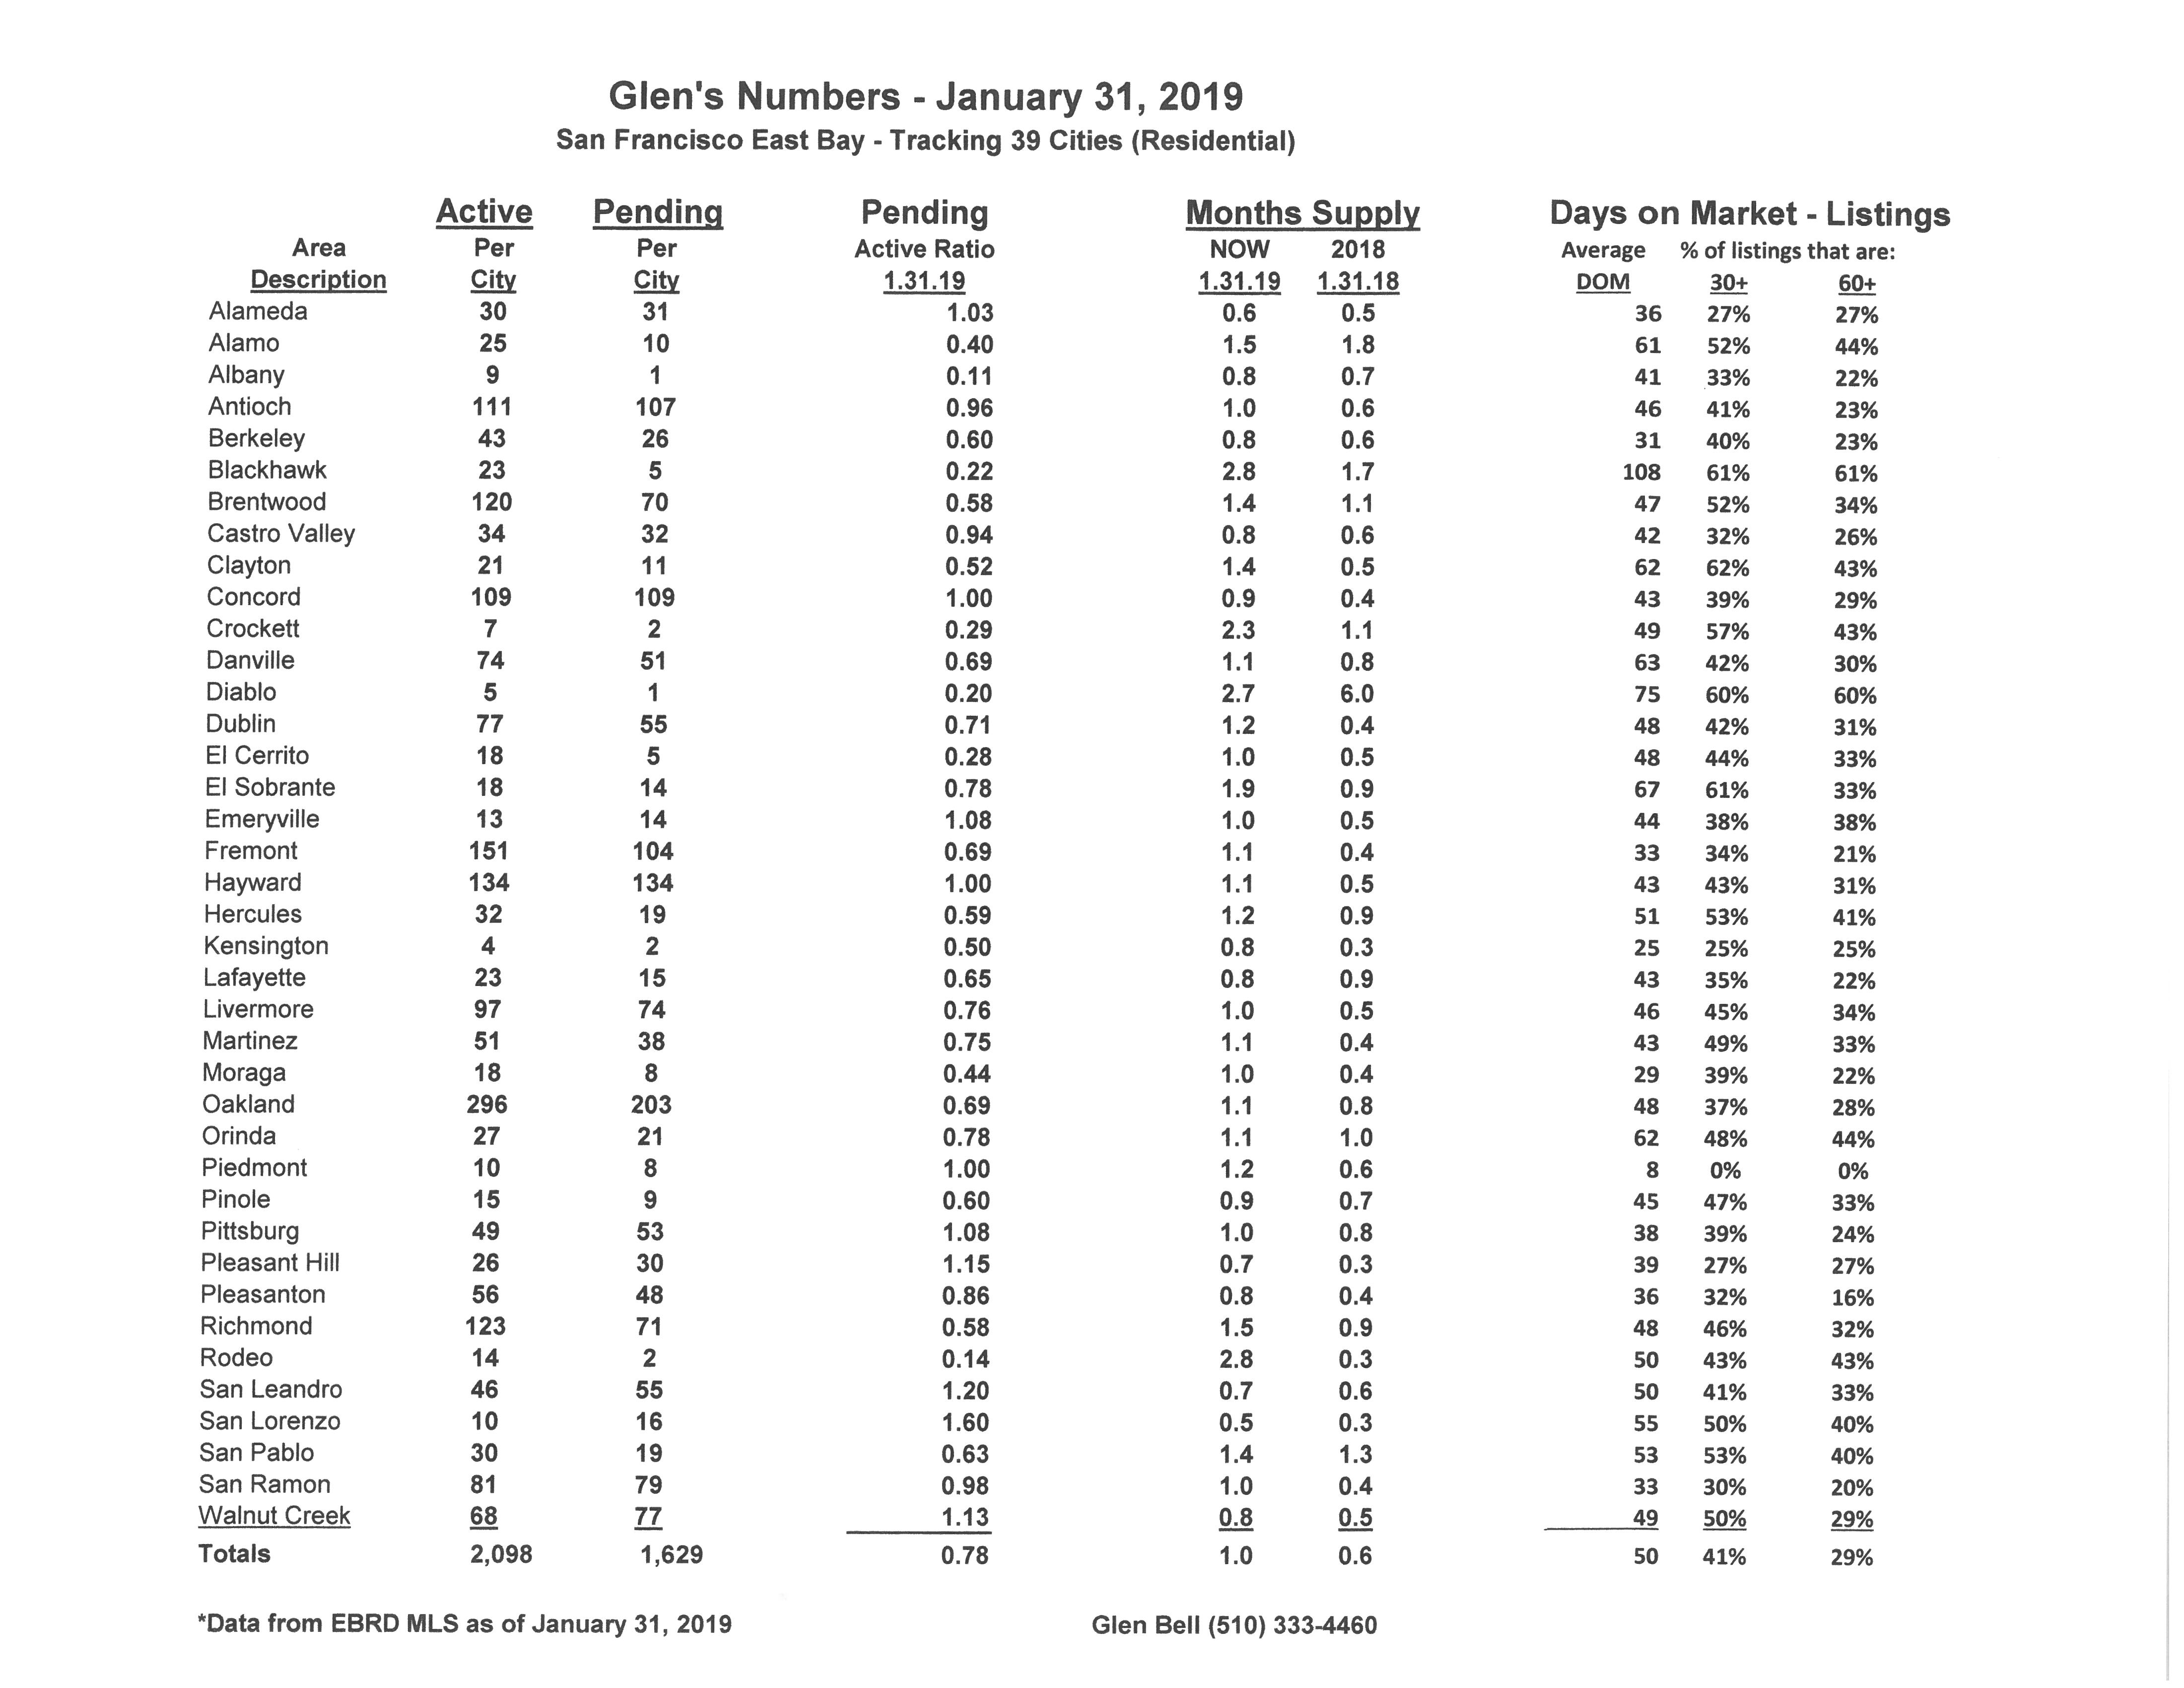
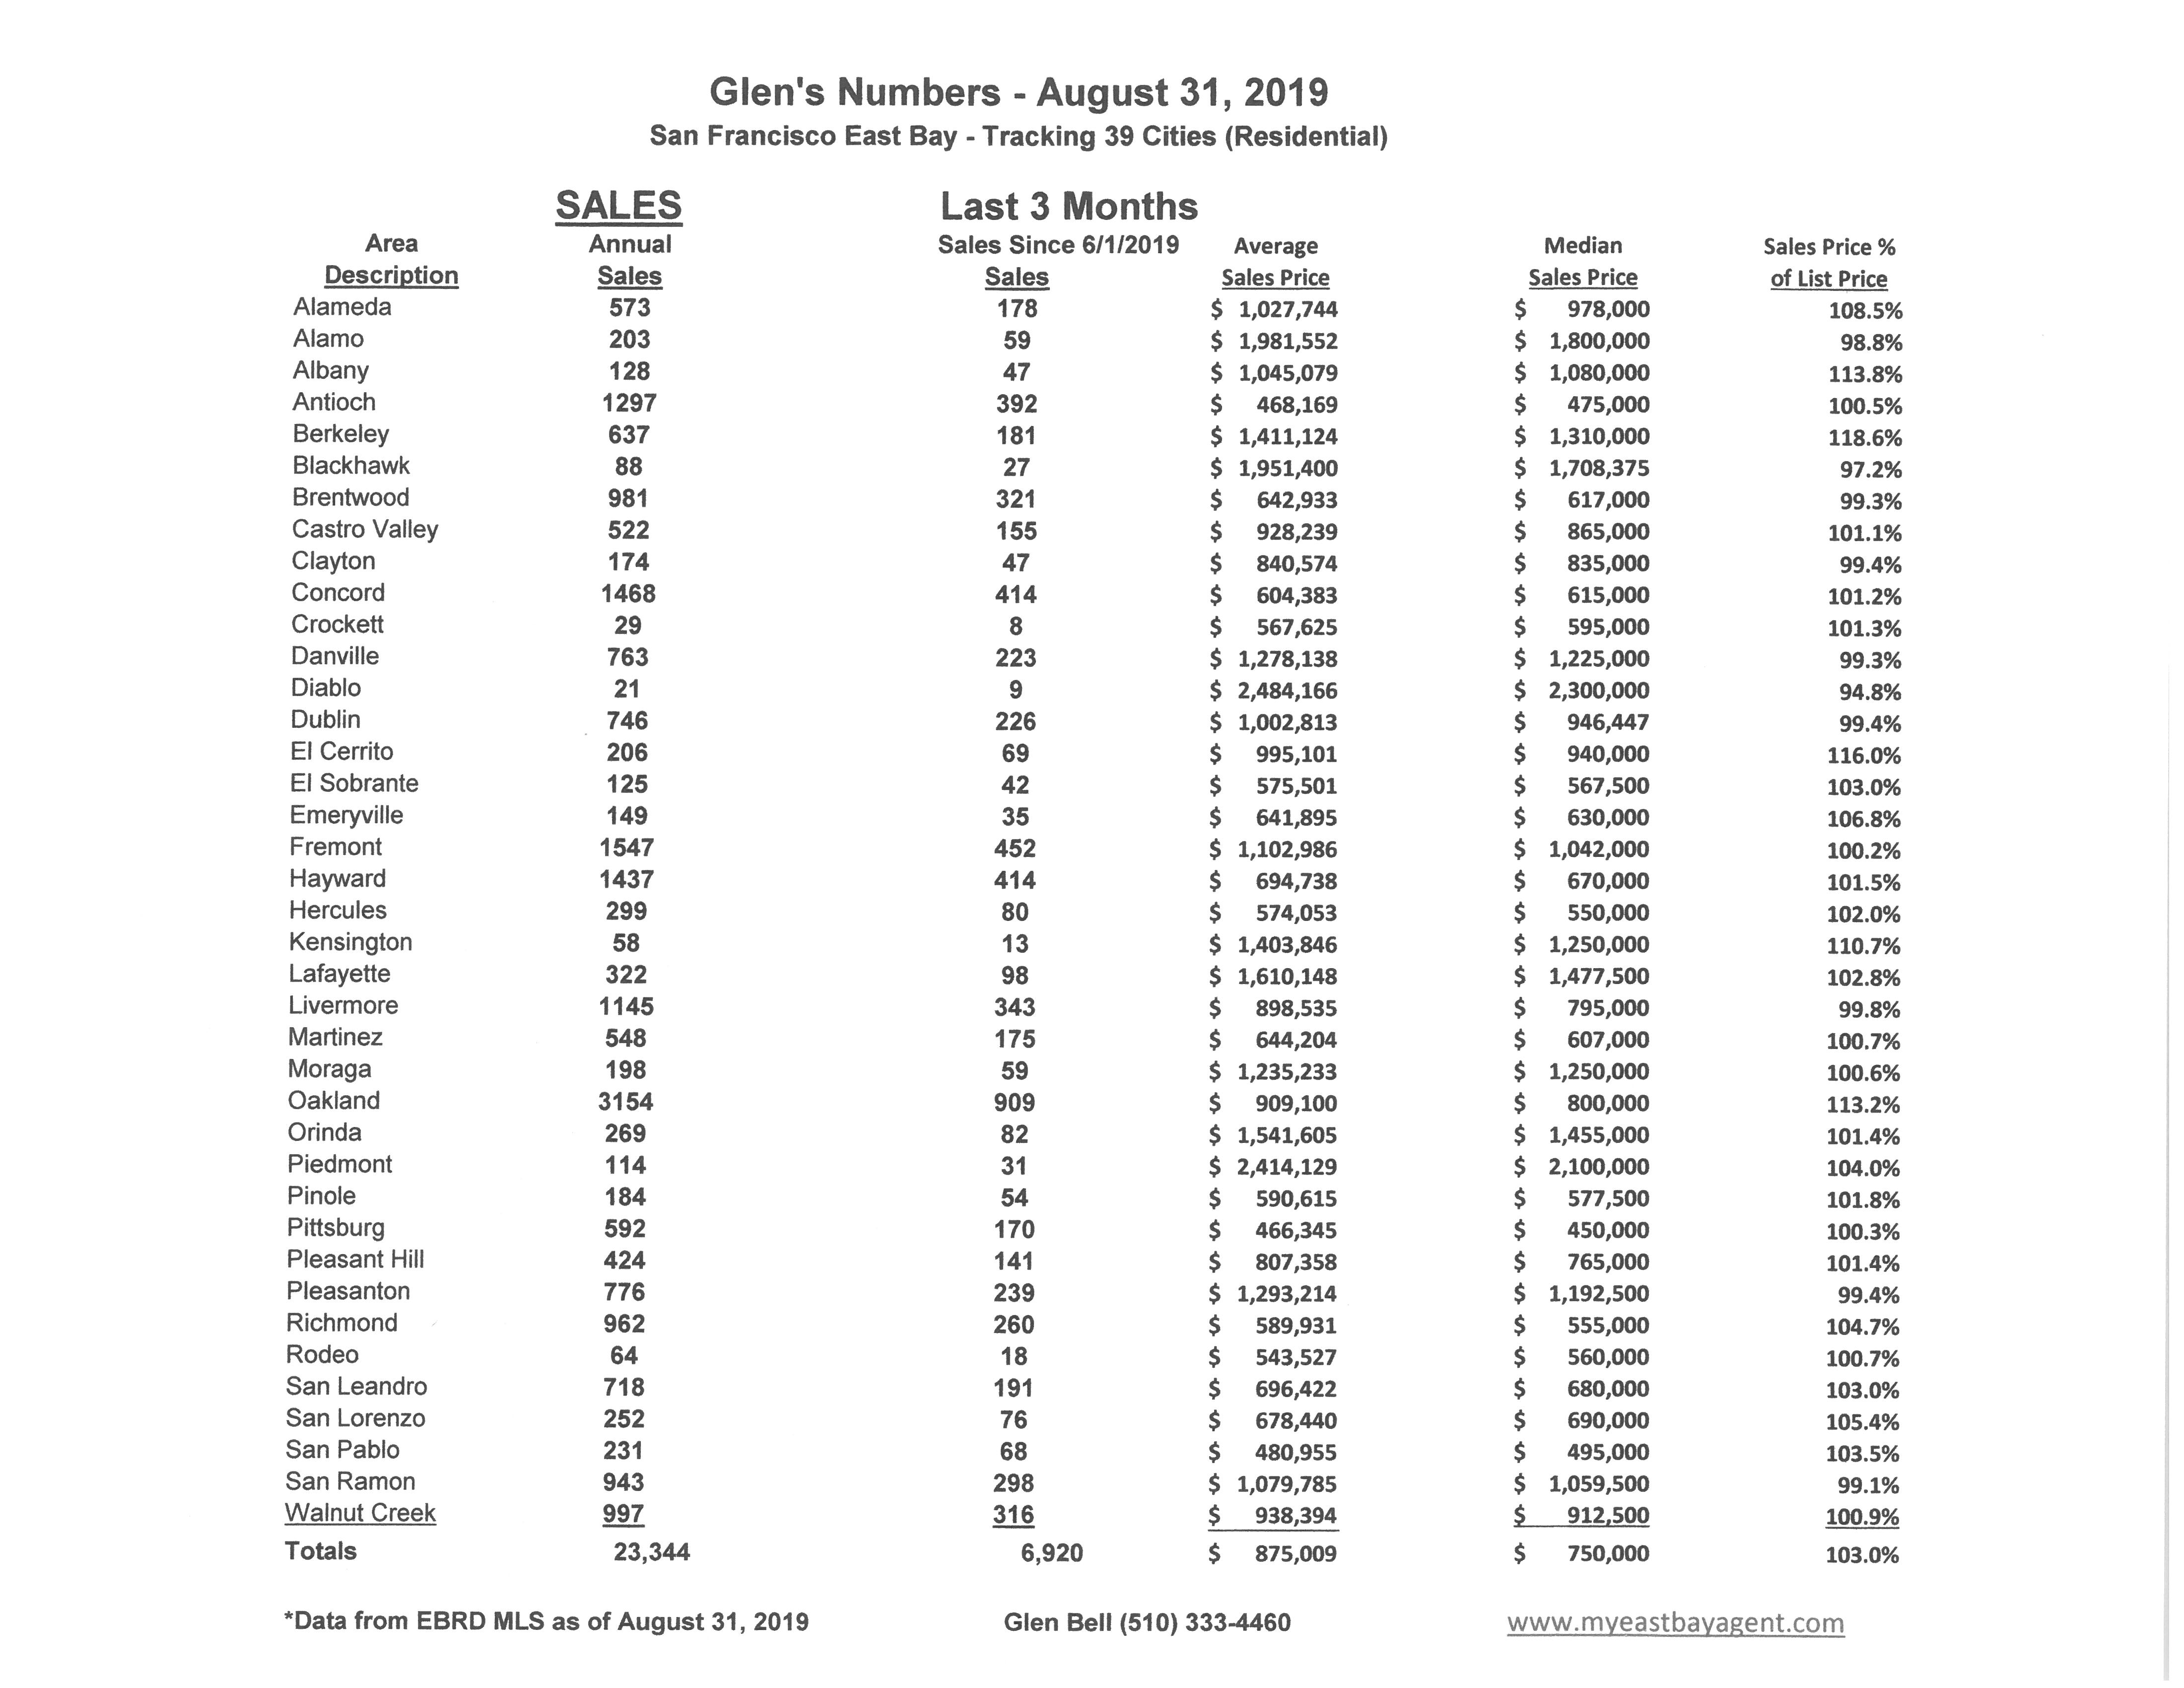
Here are some highlights for the 39 East Bay Cities that I track:
Affordability, increasing inventory, reduced sales, considerations of moving out of the Bay Area, possibility of recession, are all topics of interest in a market in transition. Properties are staying on the market longer, we’re seeing fewer offers than before, more price reductions and some incentives now being offered, in effect, all favoring buyers. Yet indecision has many buyers on the fence with a wait and see attitude despite having more choices. The gap between buyer and seller expectations has increased. A softening of the market has many sellers still holding out for top dollar, while buyers seeing a bit of leverage for the first time in years are now looking to possibly take advantage.
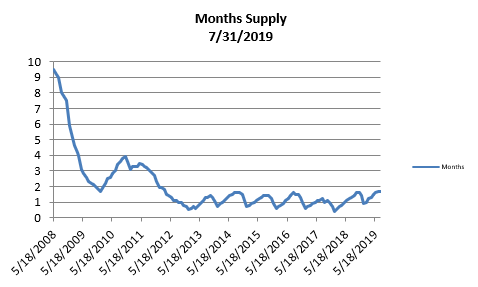
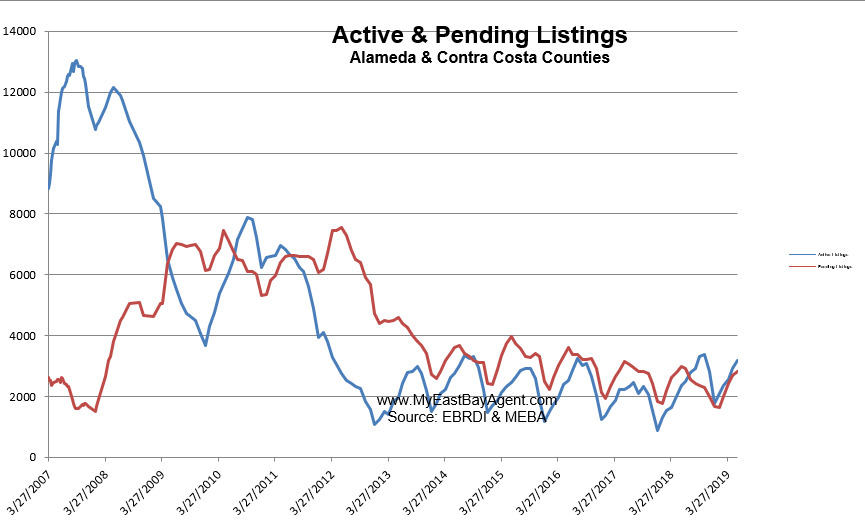
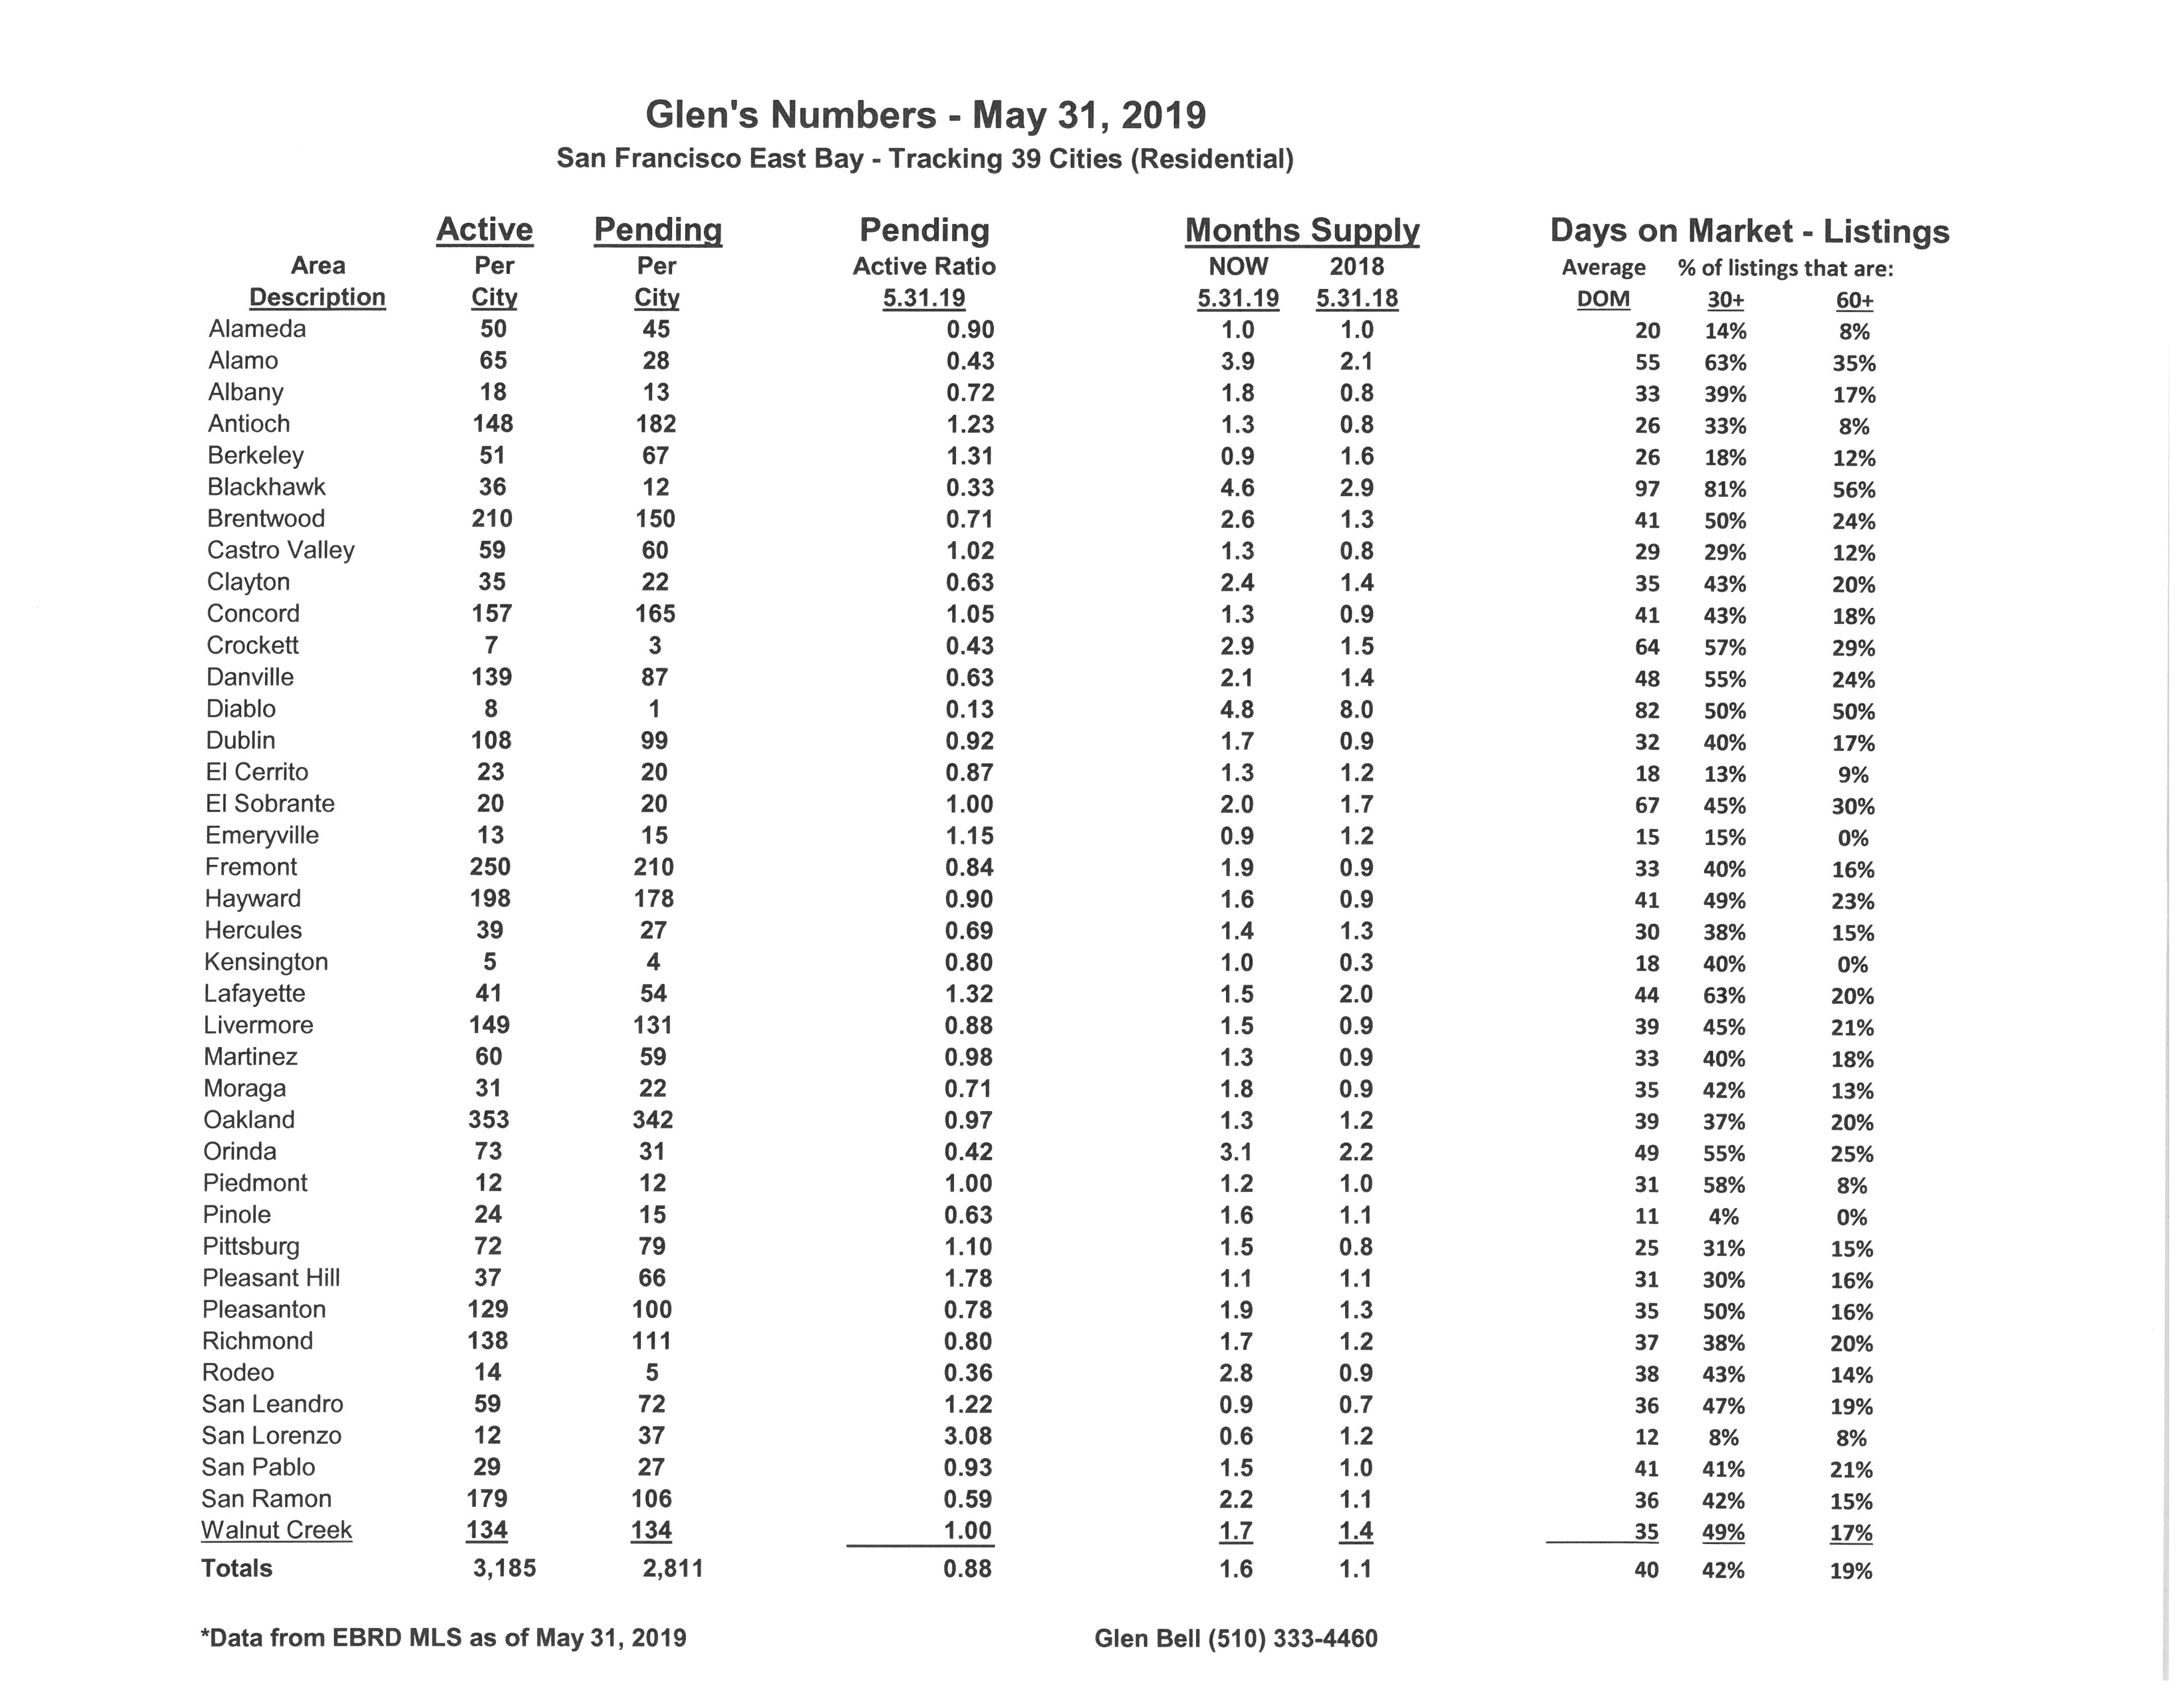
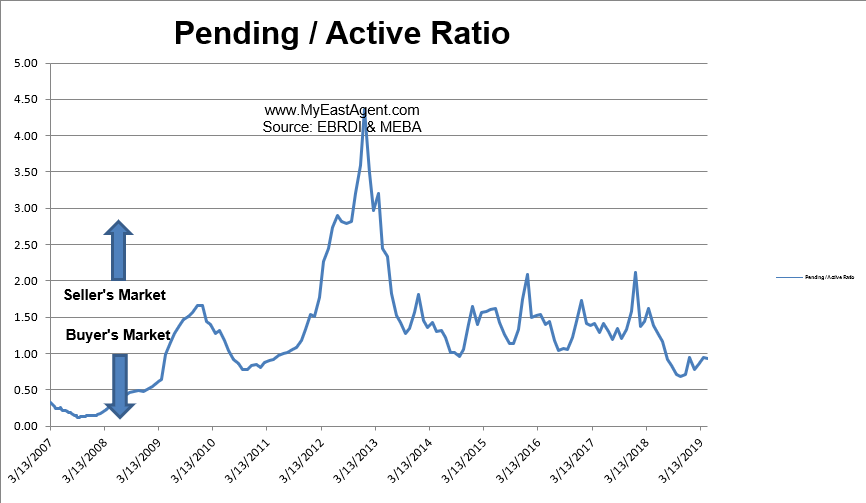
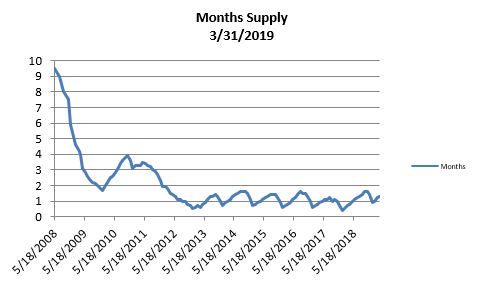
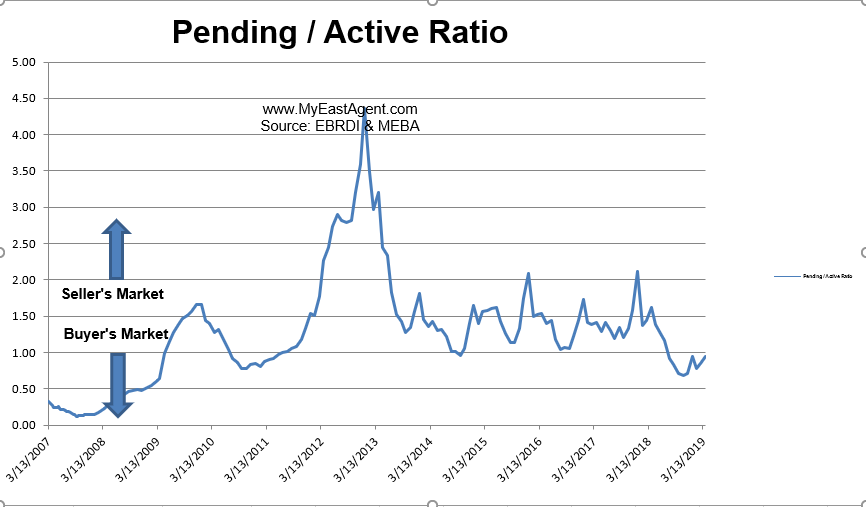
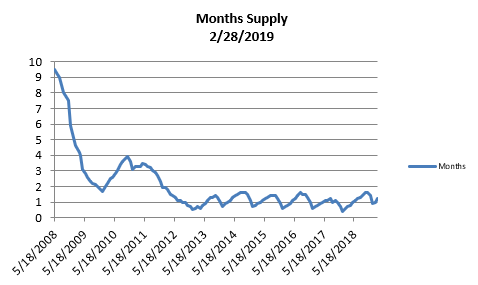
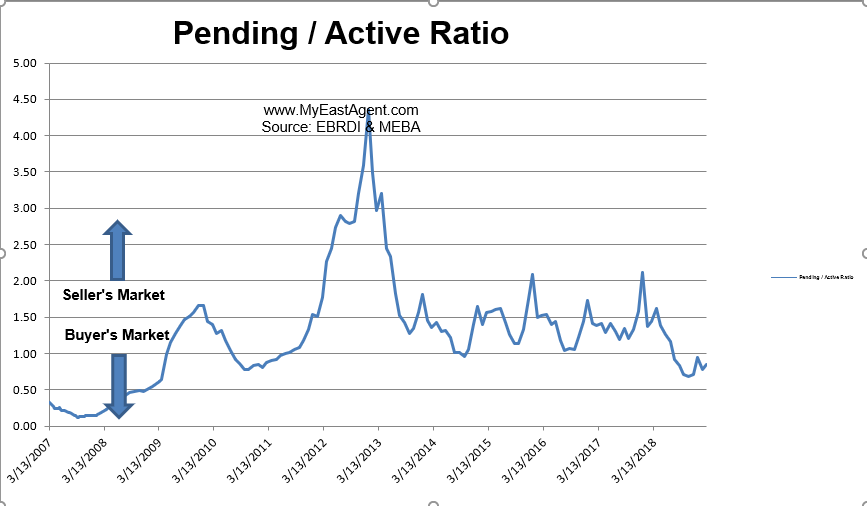
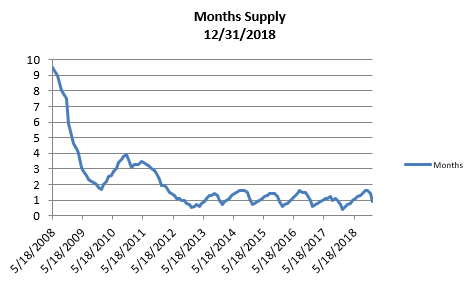
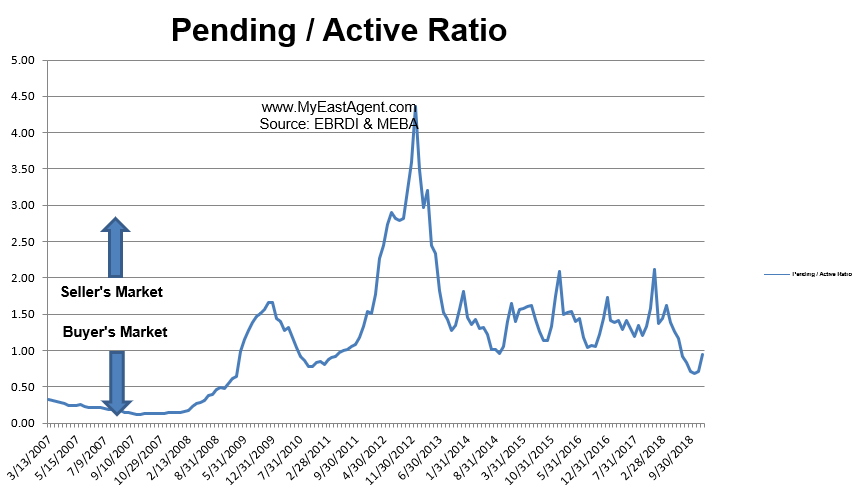
- Here’s where we stand as of the end of August. Typically, we see a dramatic drop in inventory during December followed by a modest steady increase in Spring and Summer. Inventory has increased by 68% since the beginning of the year, now sitting at a 45 day supply of homes for sale, (However, this is slightly higher in comparison to last year’s end of August of a 42 day supply). Pendings, actually decreased slightly despite new inventory coming onto the market, but slightly above last year by 4.3%. The pending/active ratio increased slightly to .85, still below our neutral mark. However, our ratio much the same last year at the end of August at .83. This is the 14th month in a row that the ratio has fallen below 1.00. The pending/active ratio has been a benchmark that we’ve used as a measure of supply and demand to determine whether we’re in a buyer’s or a seller’s market. Typically, a number well above 1, (more inventory with fewer pendings) favors sellers. A number below 1 favors buyers. In short, we have moved from a strong seller’s market since the beginning of last summer towards a more normal and balanced market, and in many cases, now favoring buyers.
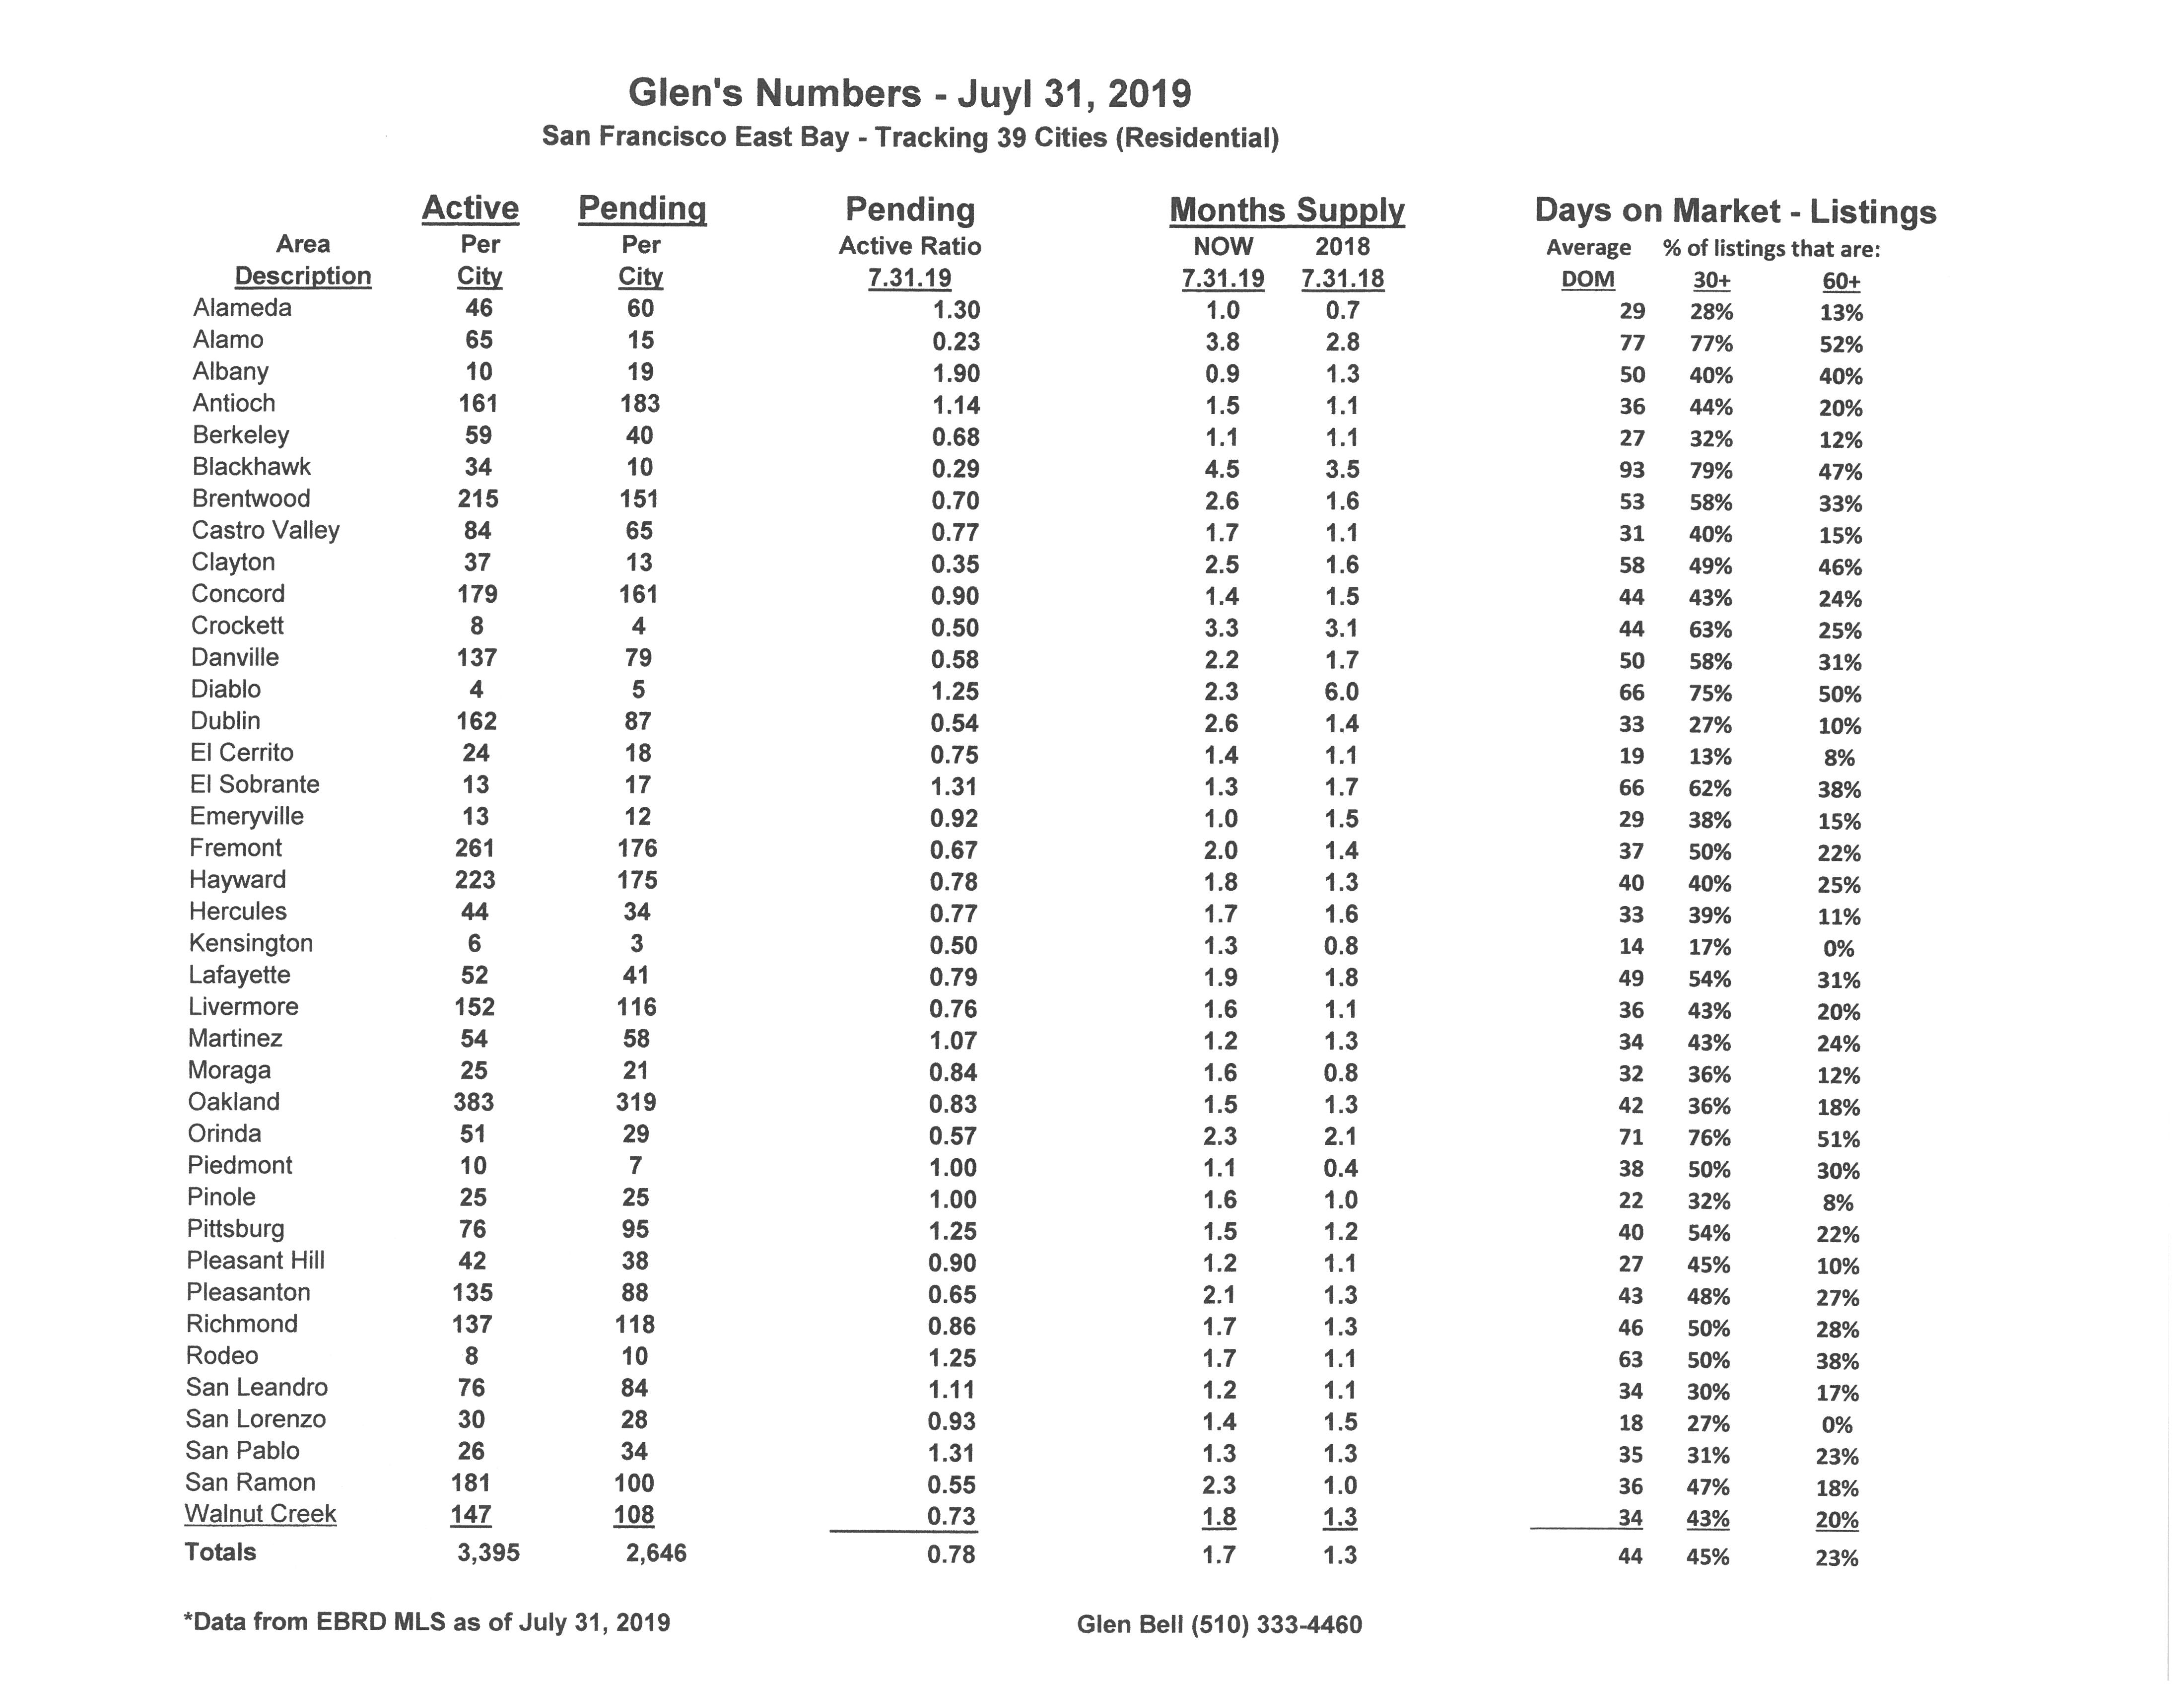
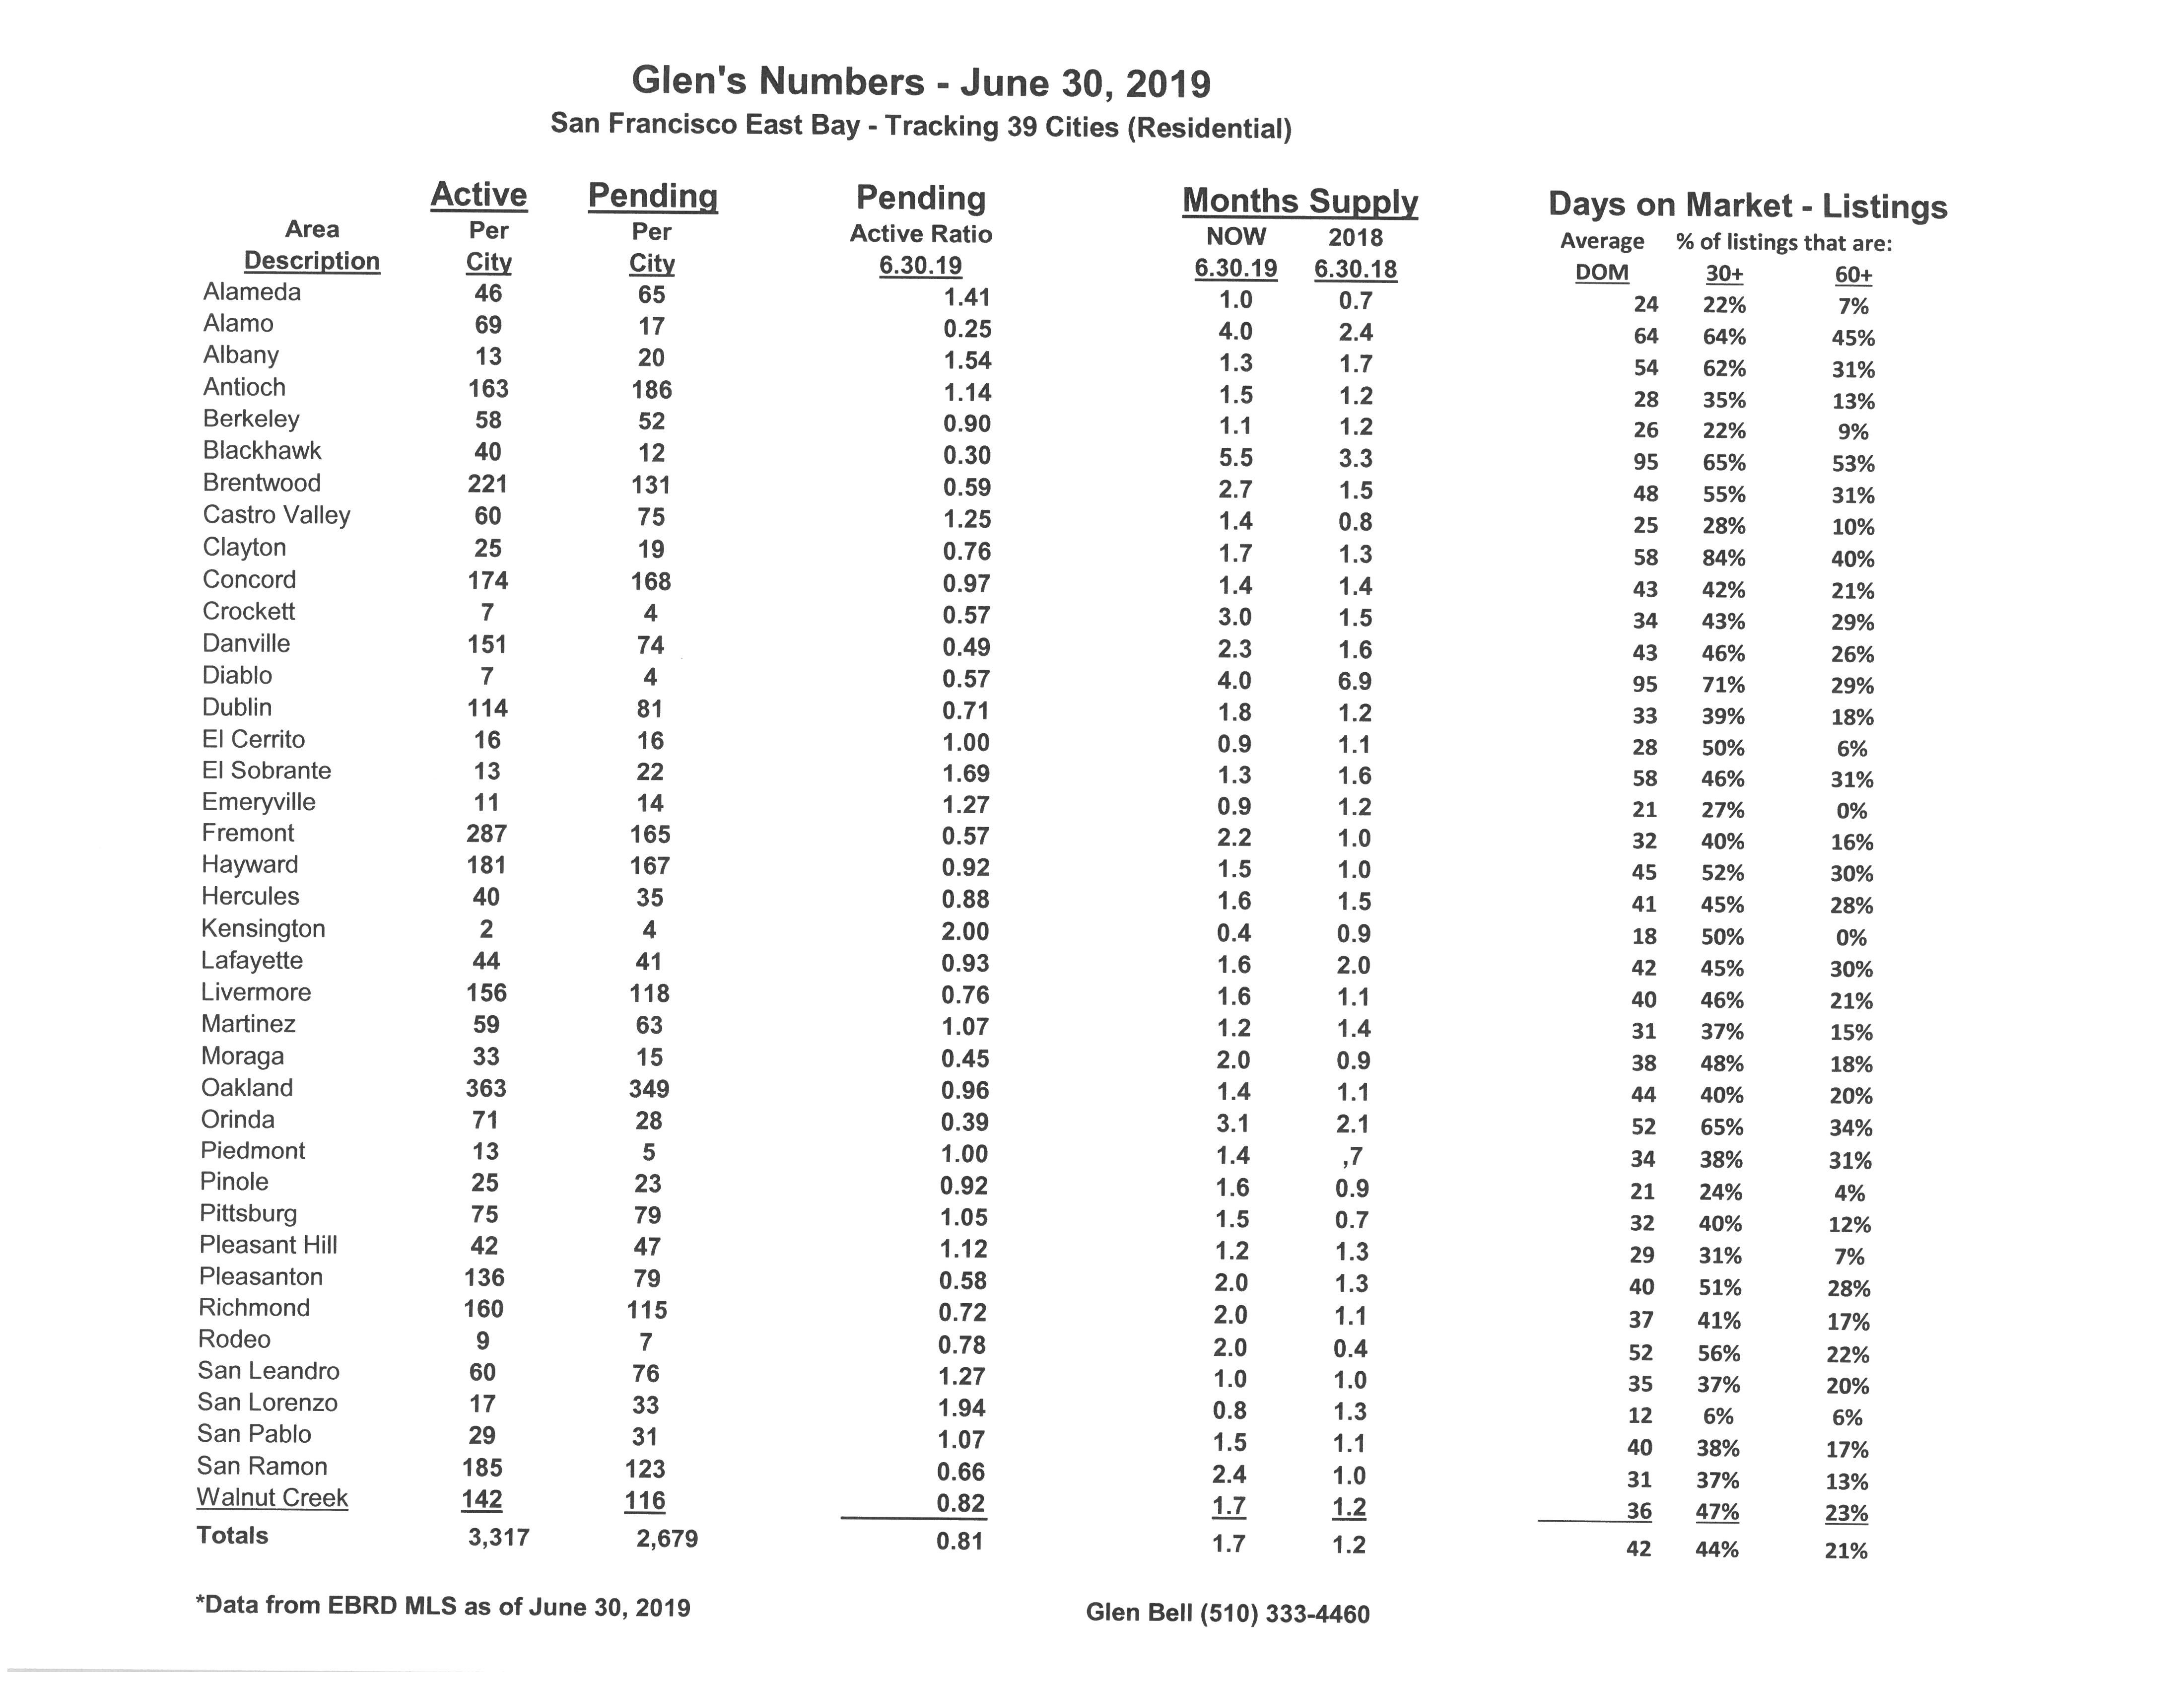
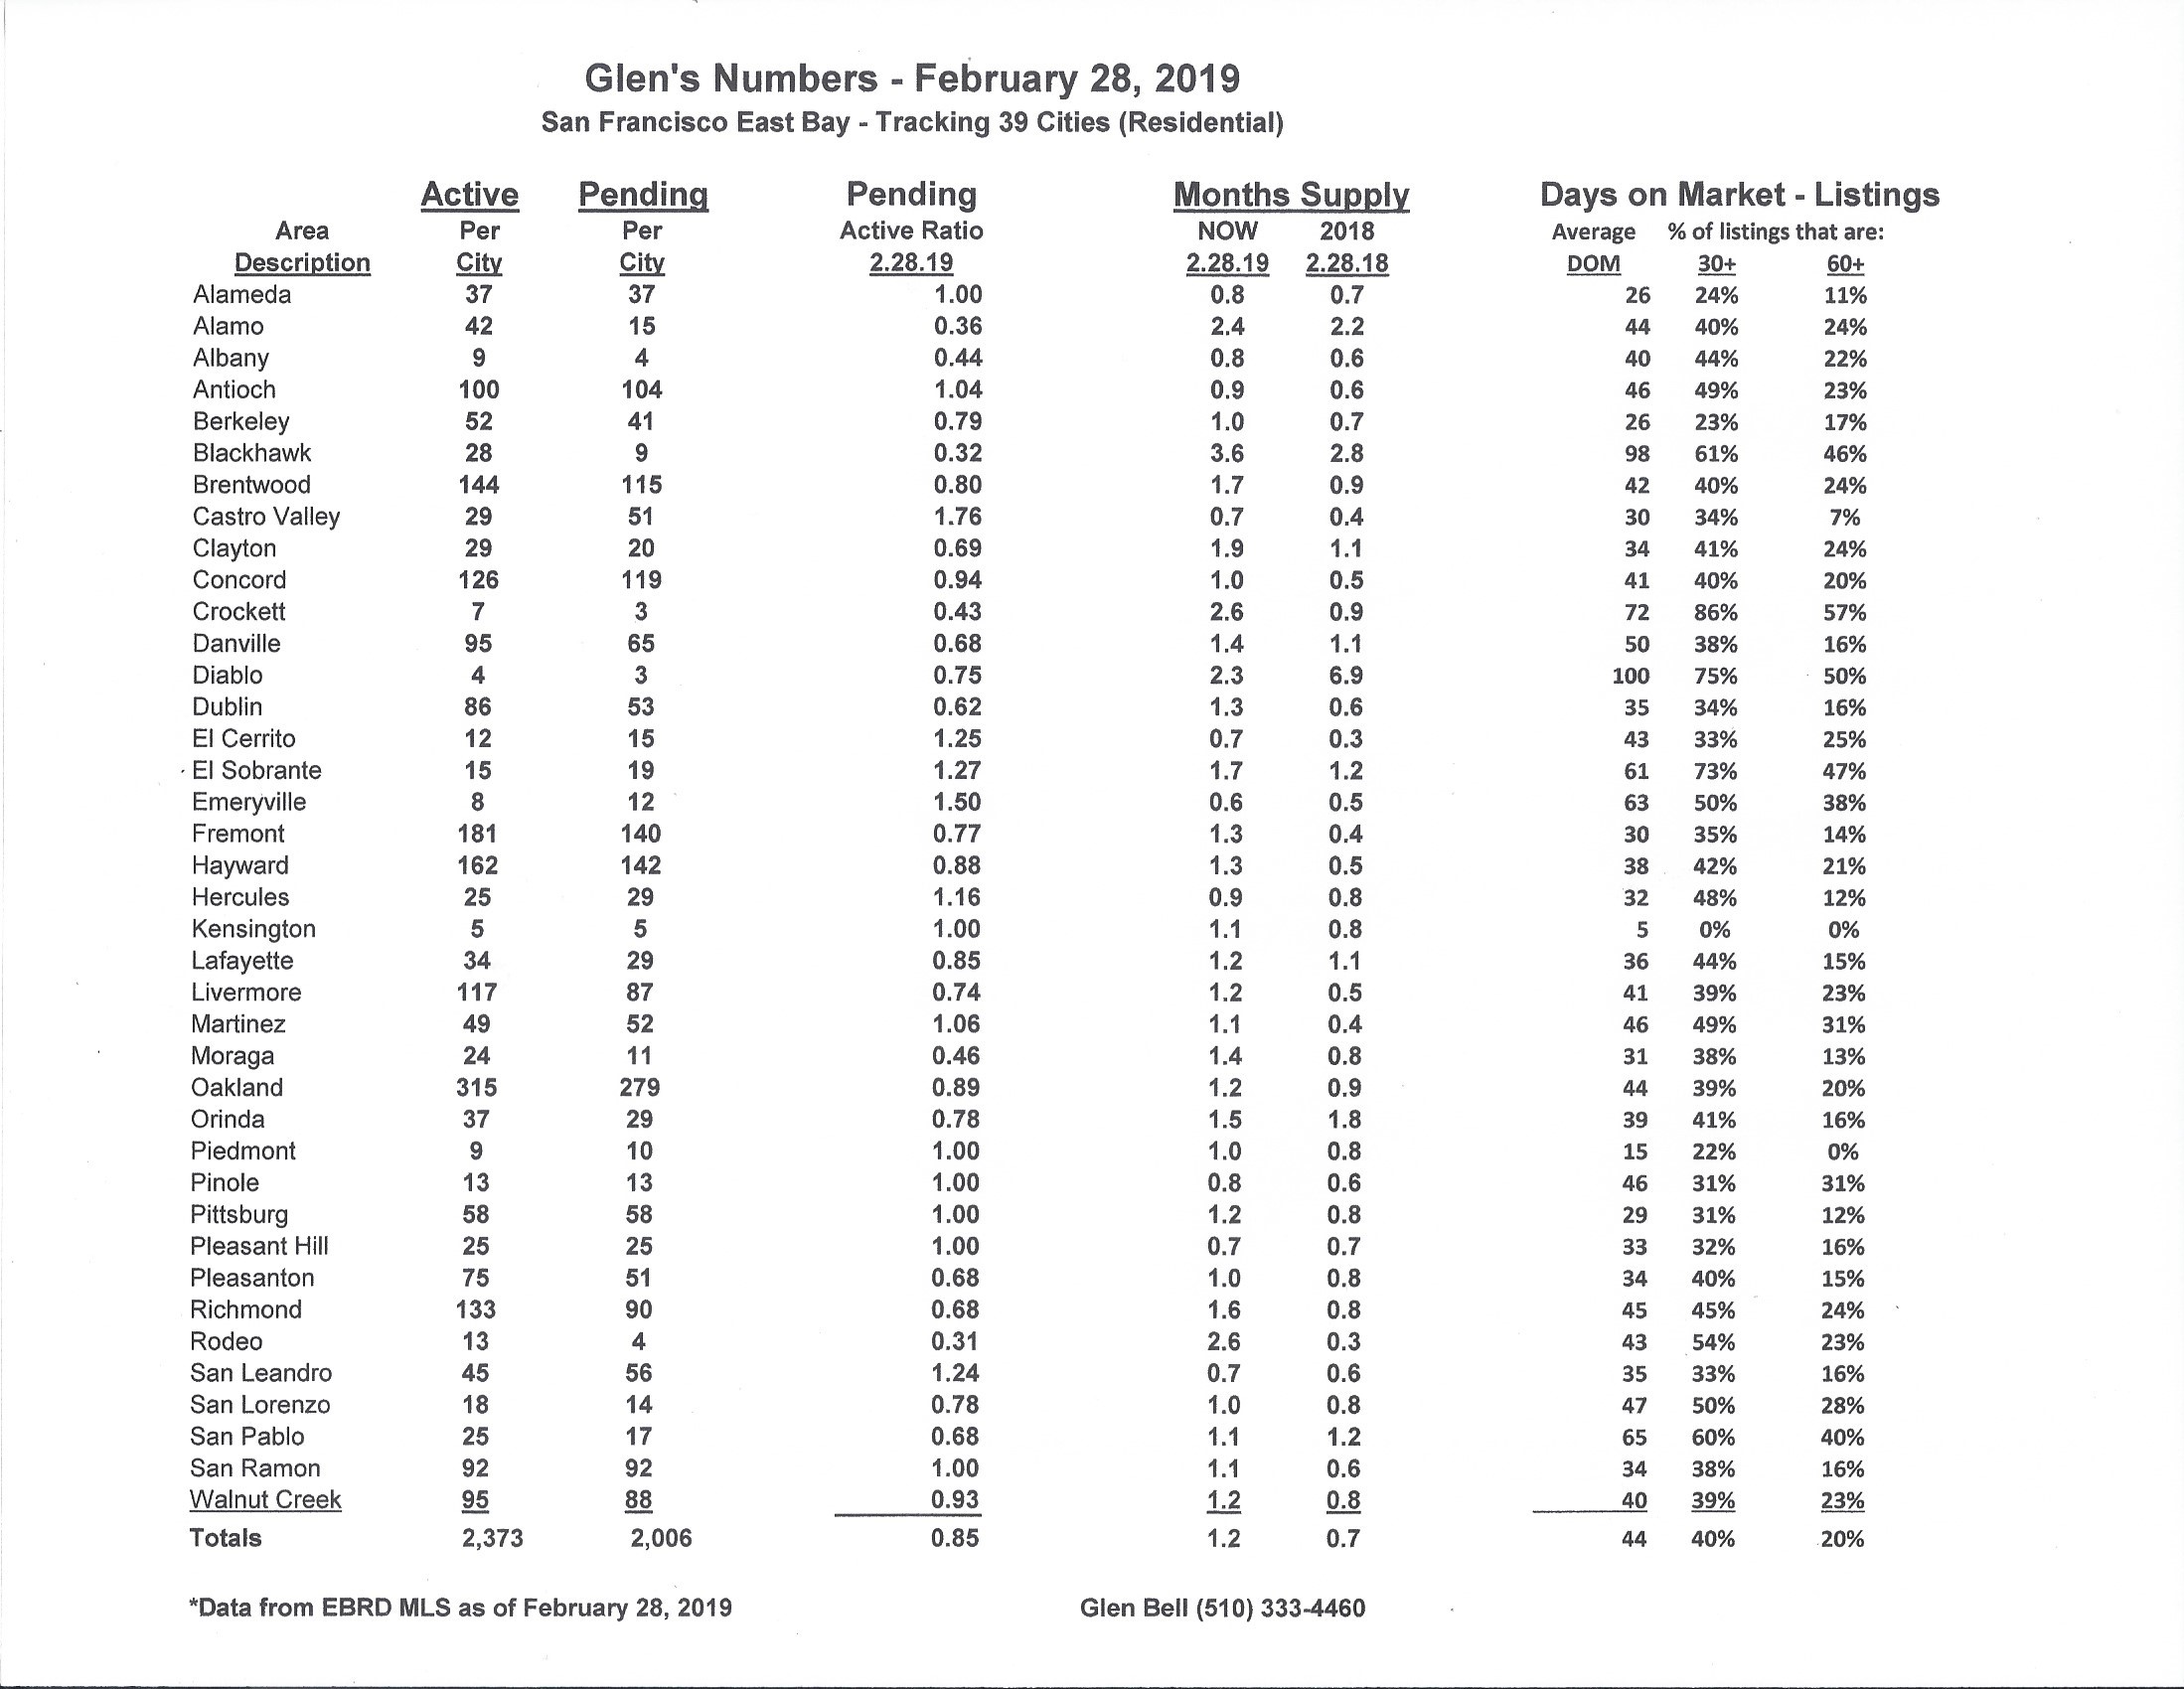
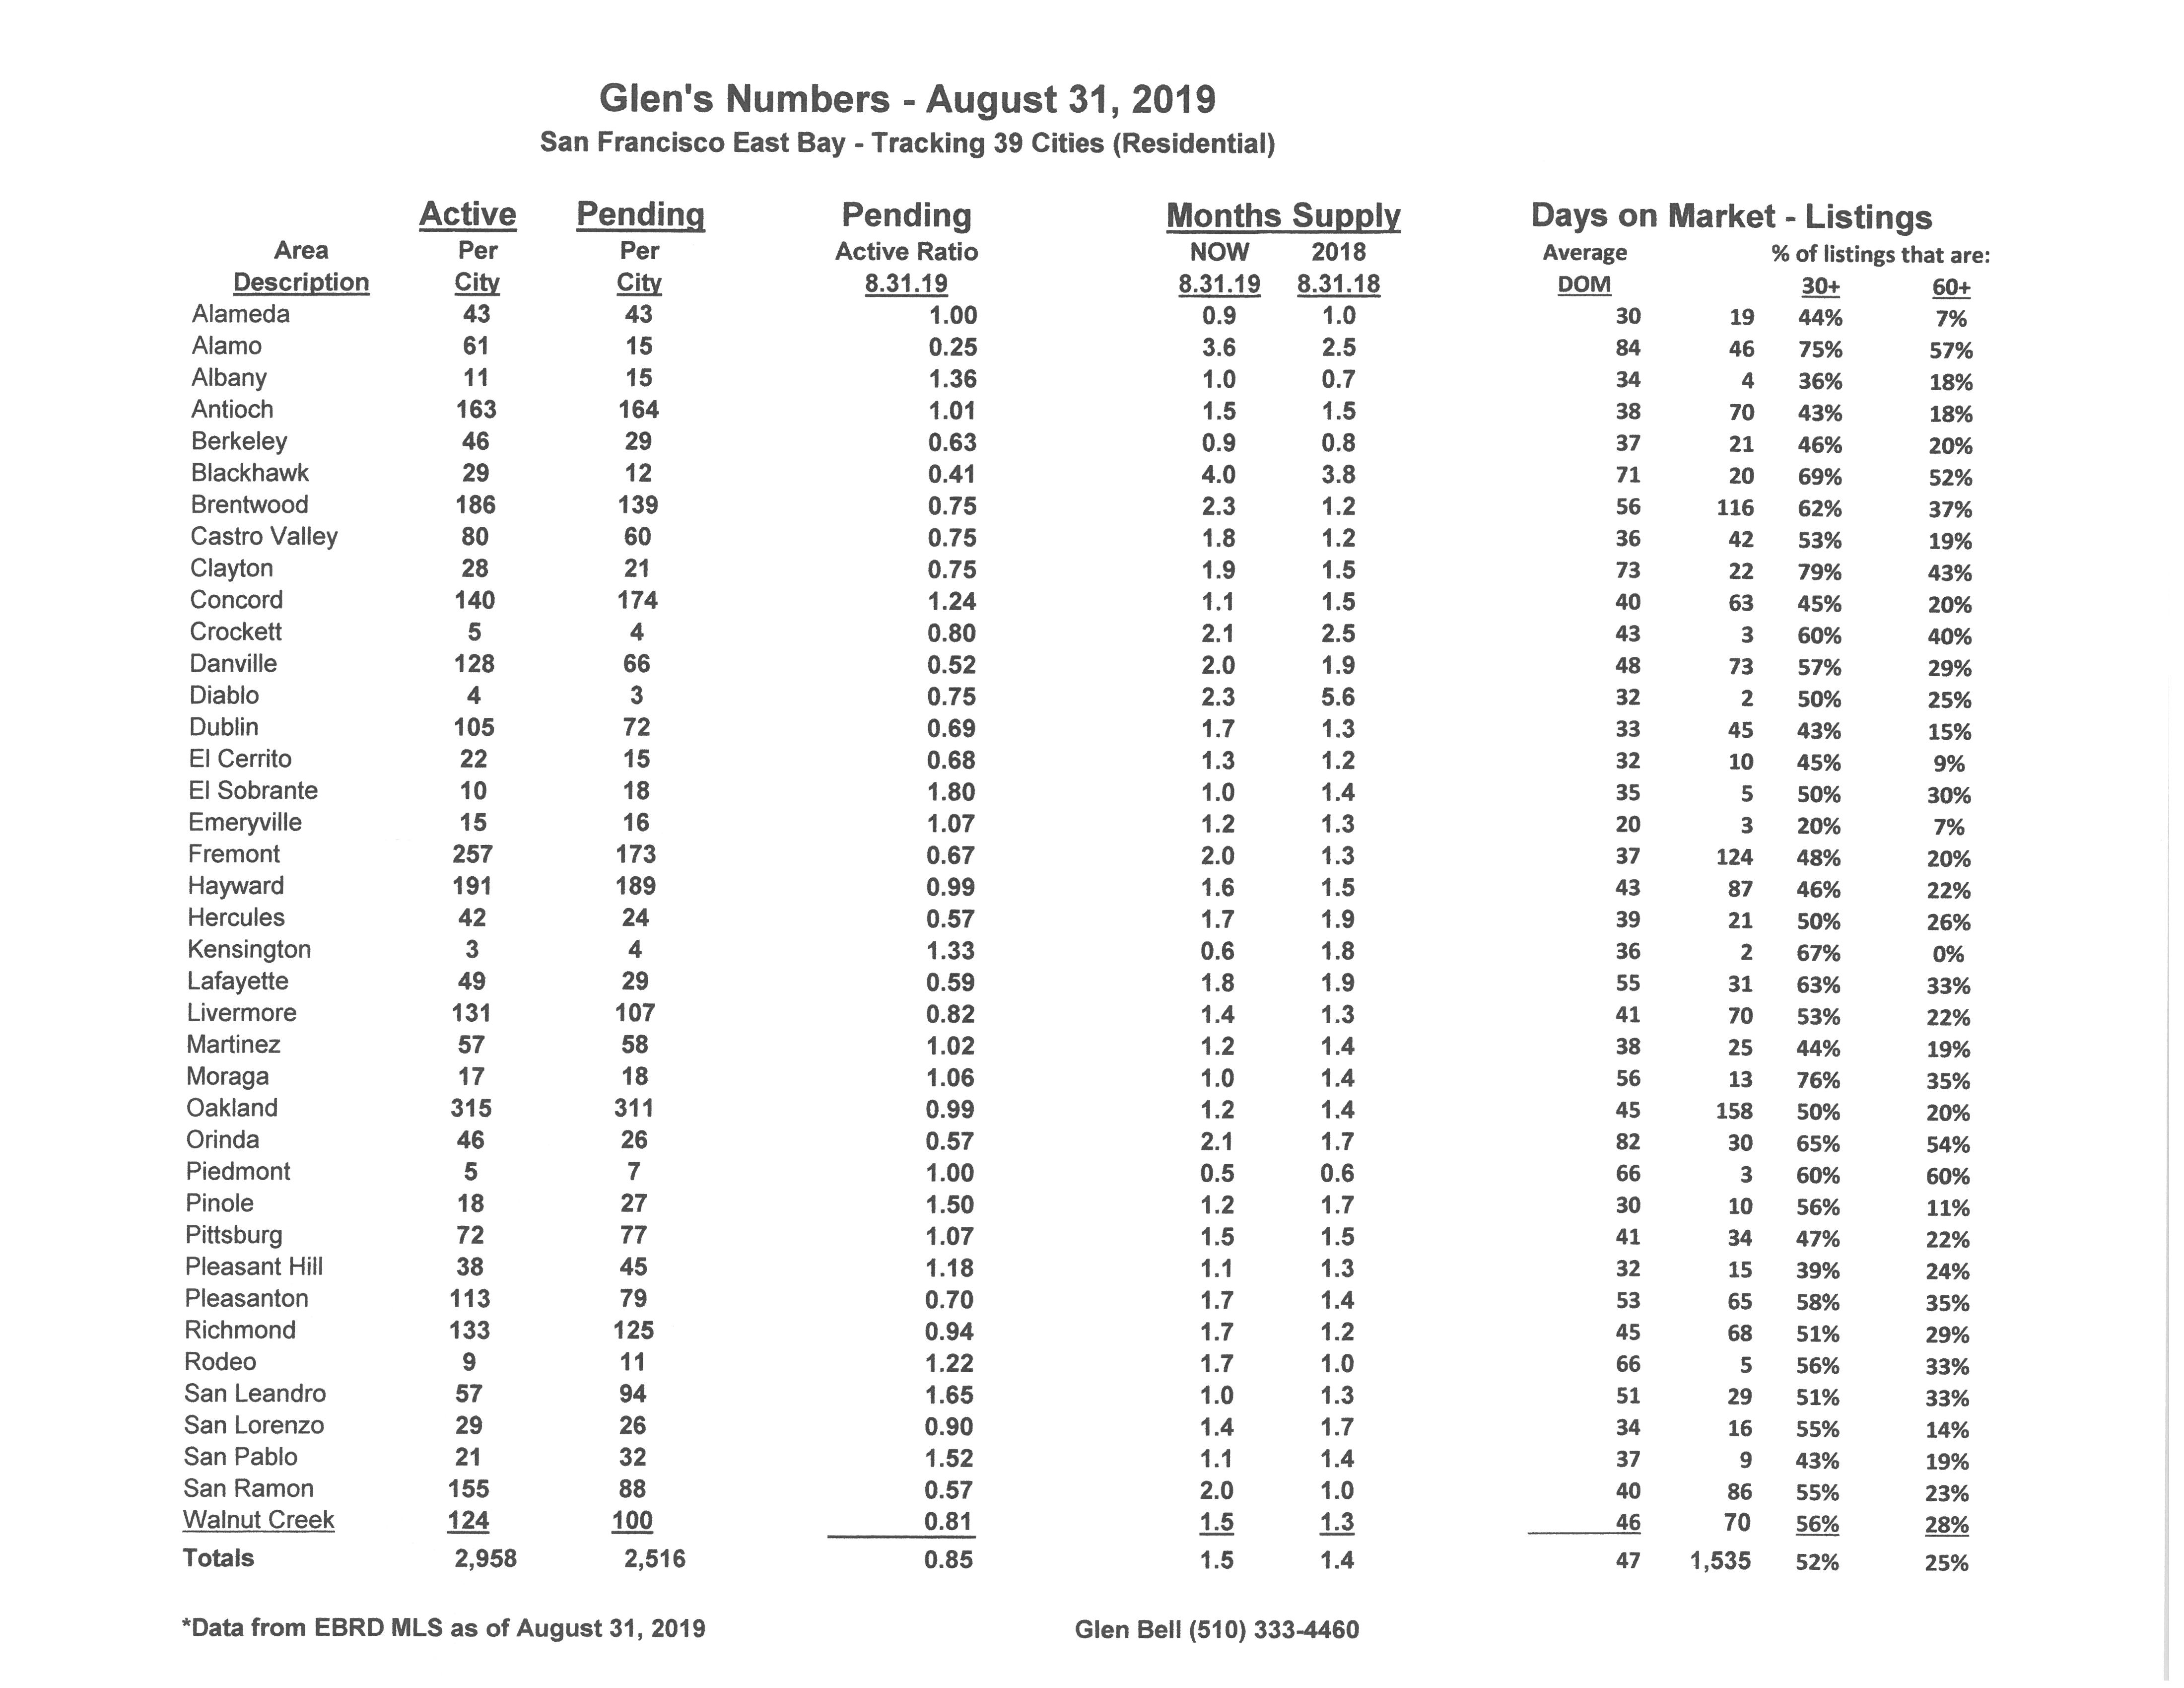
- The percentage of homes “sitting” has increased slightly to 52% of the homes listed now remaining active for 30 days or longer, while 25% have stayed on the market for 60 days or longer. Still there are more homes that are “sitting” this year as compared to last year, (with then 42% remaining active over 30 days and 17% remaining active over 60 days).
- The “distressed” market, (foreclosures and short sales) are no longer a factor representing less than .05% of the market.
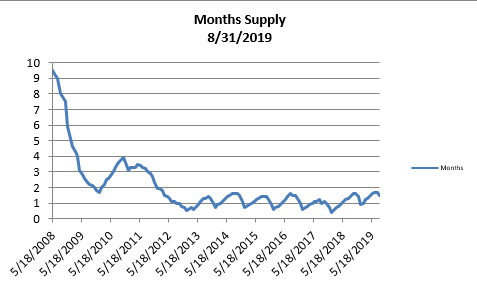
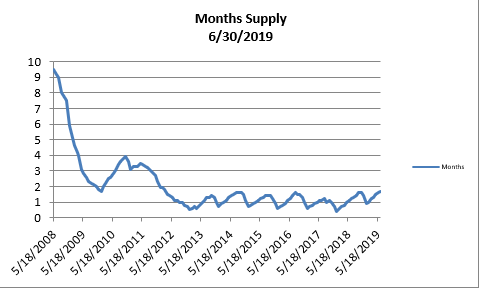
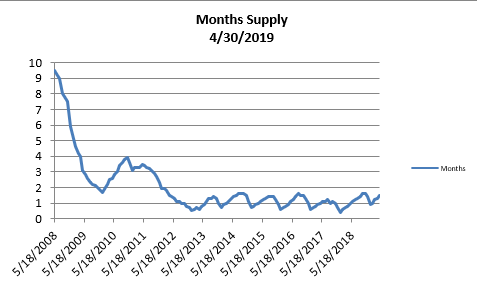
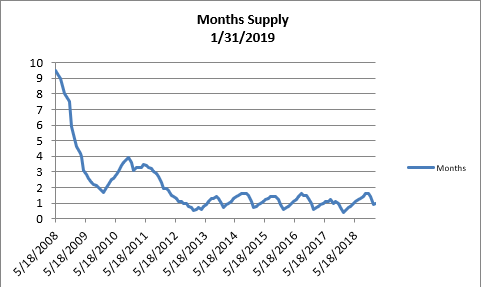
- The month’s supply for the combined 39 city area is 45 days. Historically, a 2 to 3 months’ supply is considered normal in the San Francisco East Bay Area. As you can see from the graph above, this is normally a repetitive pattern over the past four years. We are higher when compared to last year at this time, of 42 days.

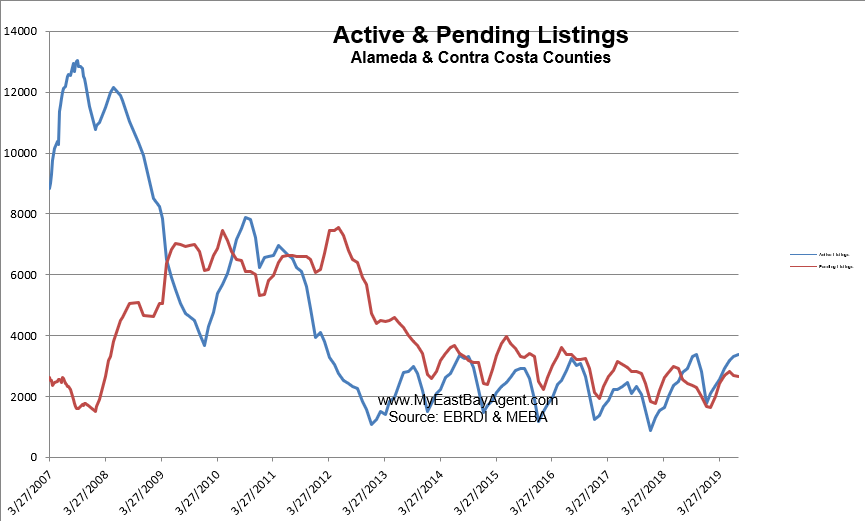
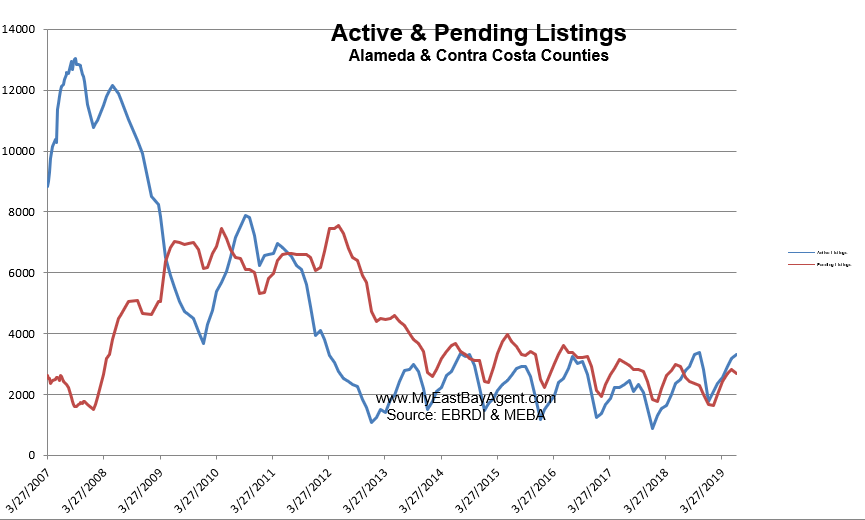
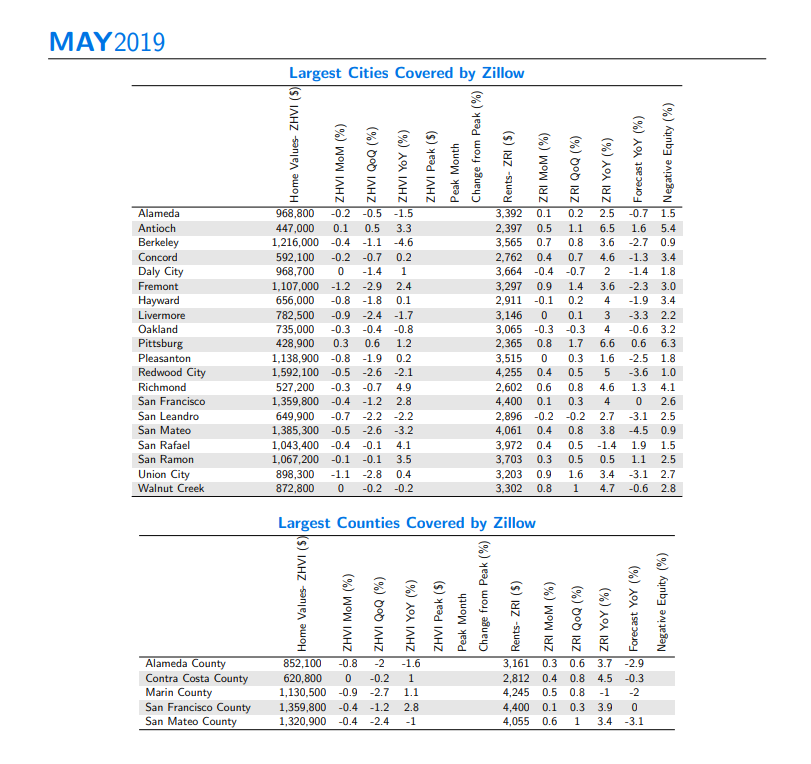
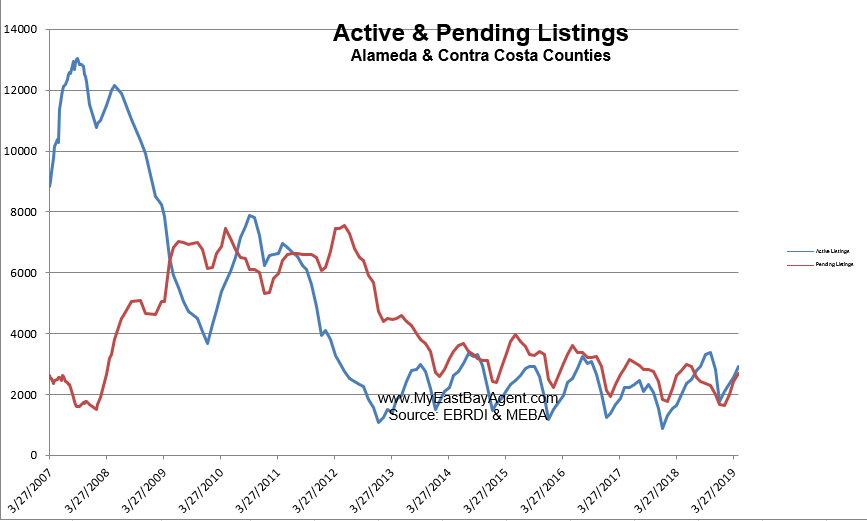
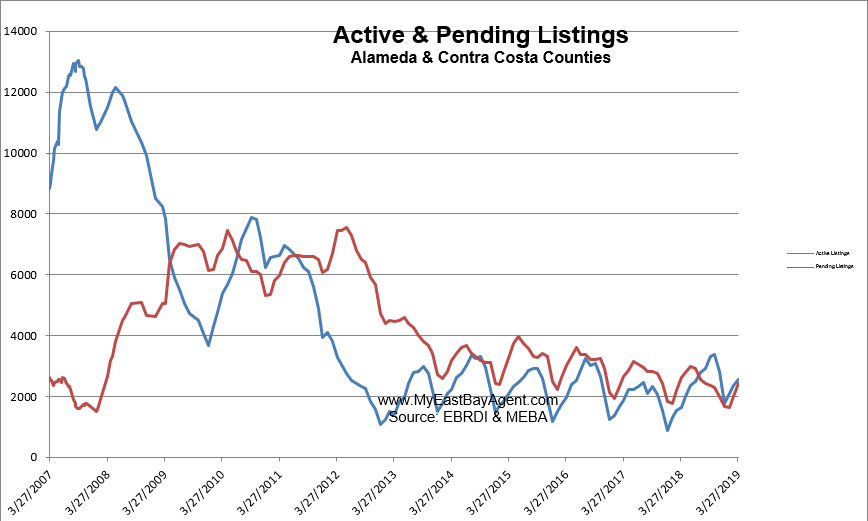
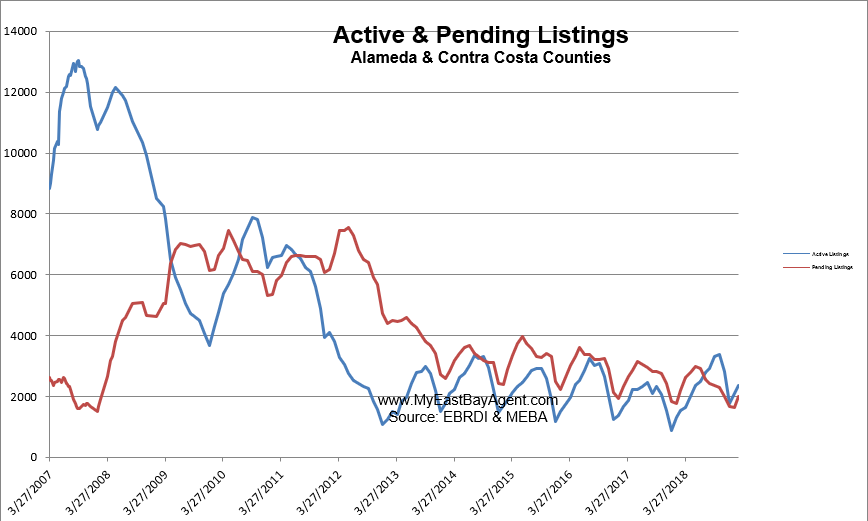
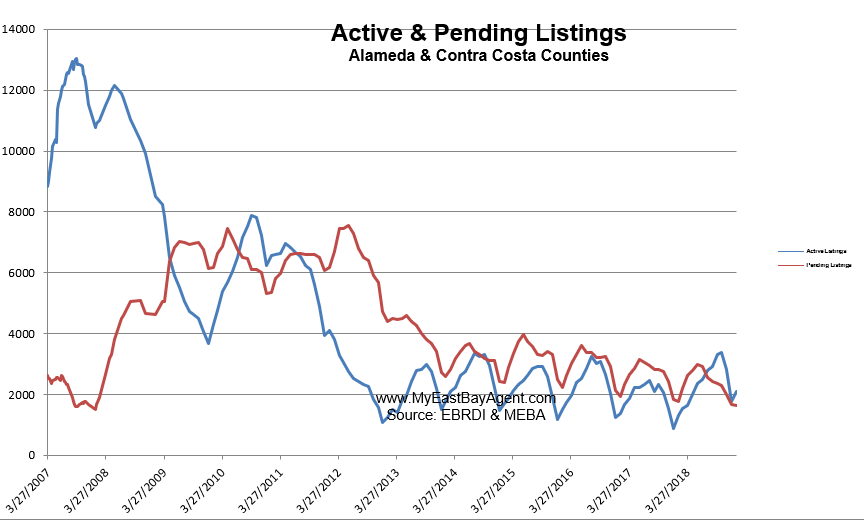
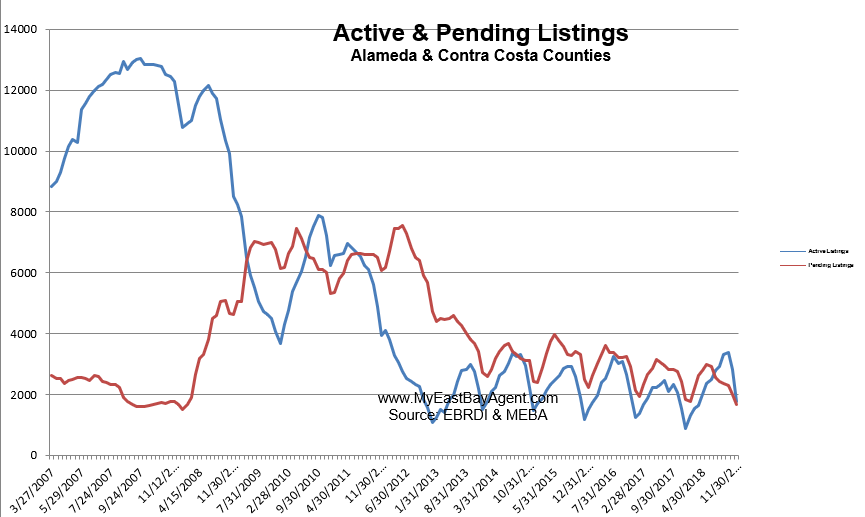
- Our inventory for the East Bay (the 39 cities tracked) is now at 2,958 homes actively for sale. This is close to what we saw last year at this time, of 2,914. We’re used to seeing between 3,000 and 6,000 homes in a “normal” market in the San Francisco East Bay Area. Pending sales decreased to 2,516, slightly more than what we saw last year at this time of 2,413, or 4.1% lower.
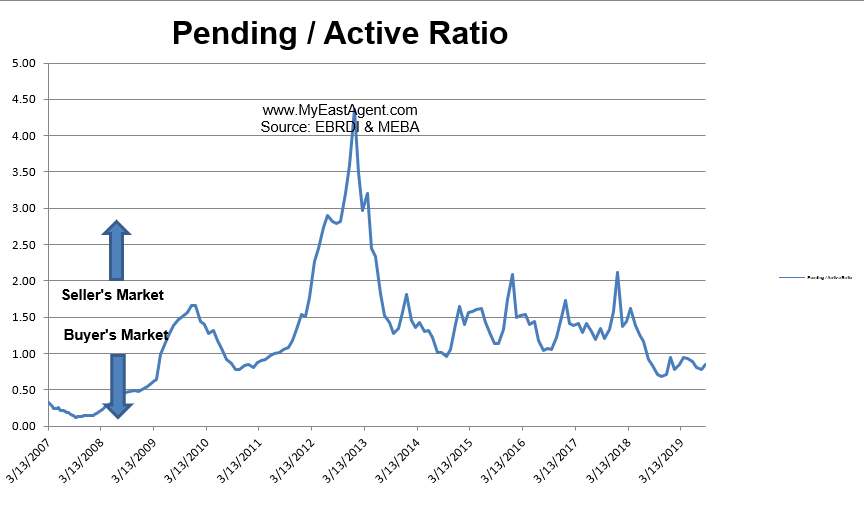
- Our Pending/Active Ratio is .85. Last year at this time it was .83
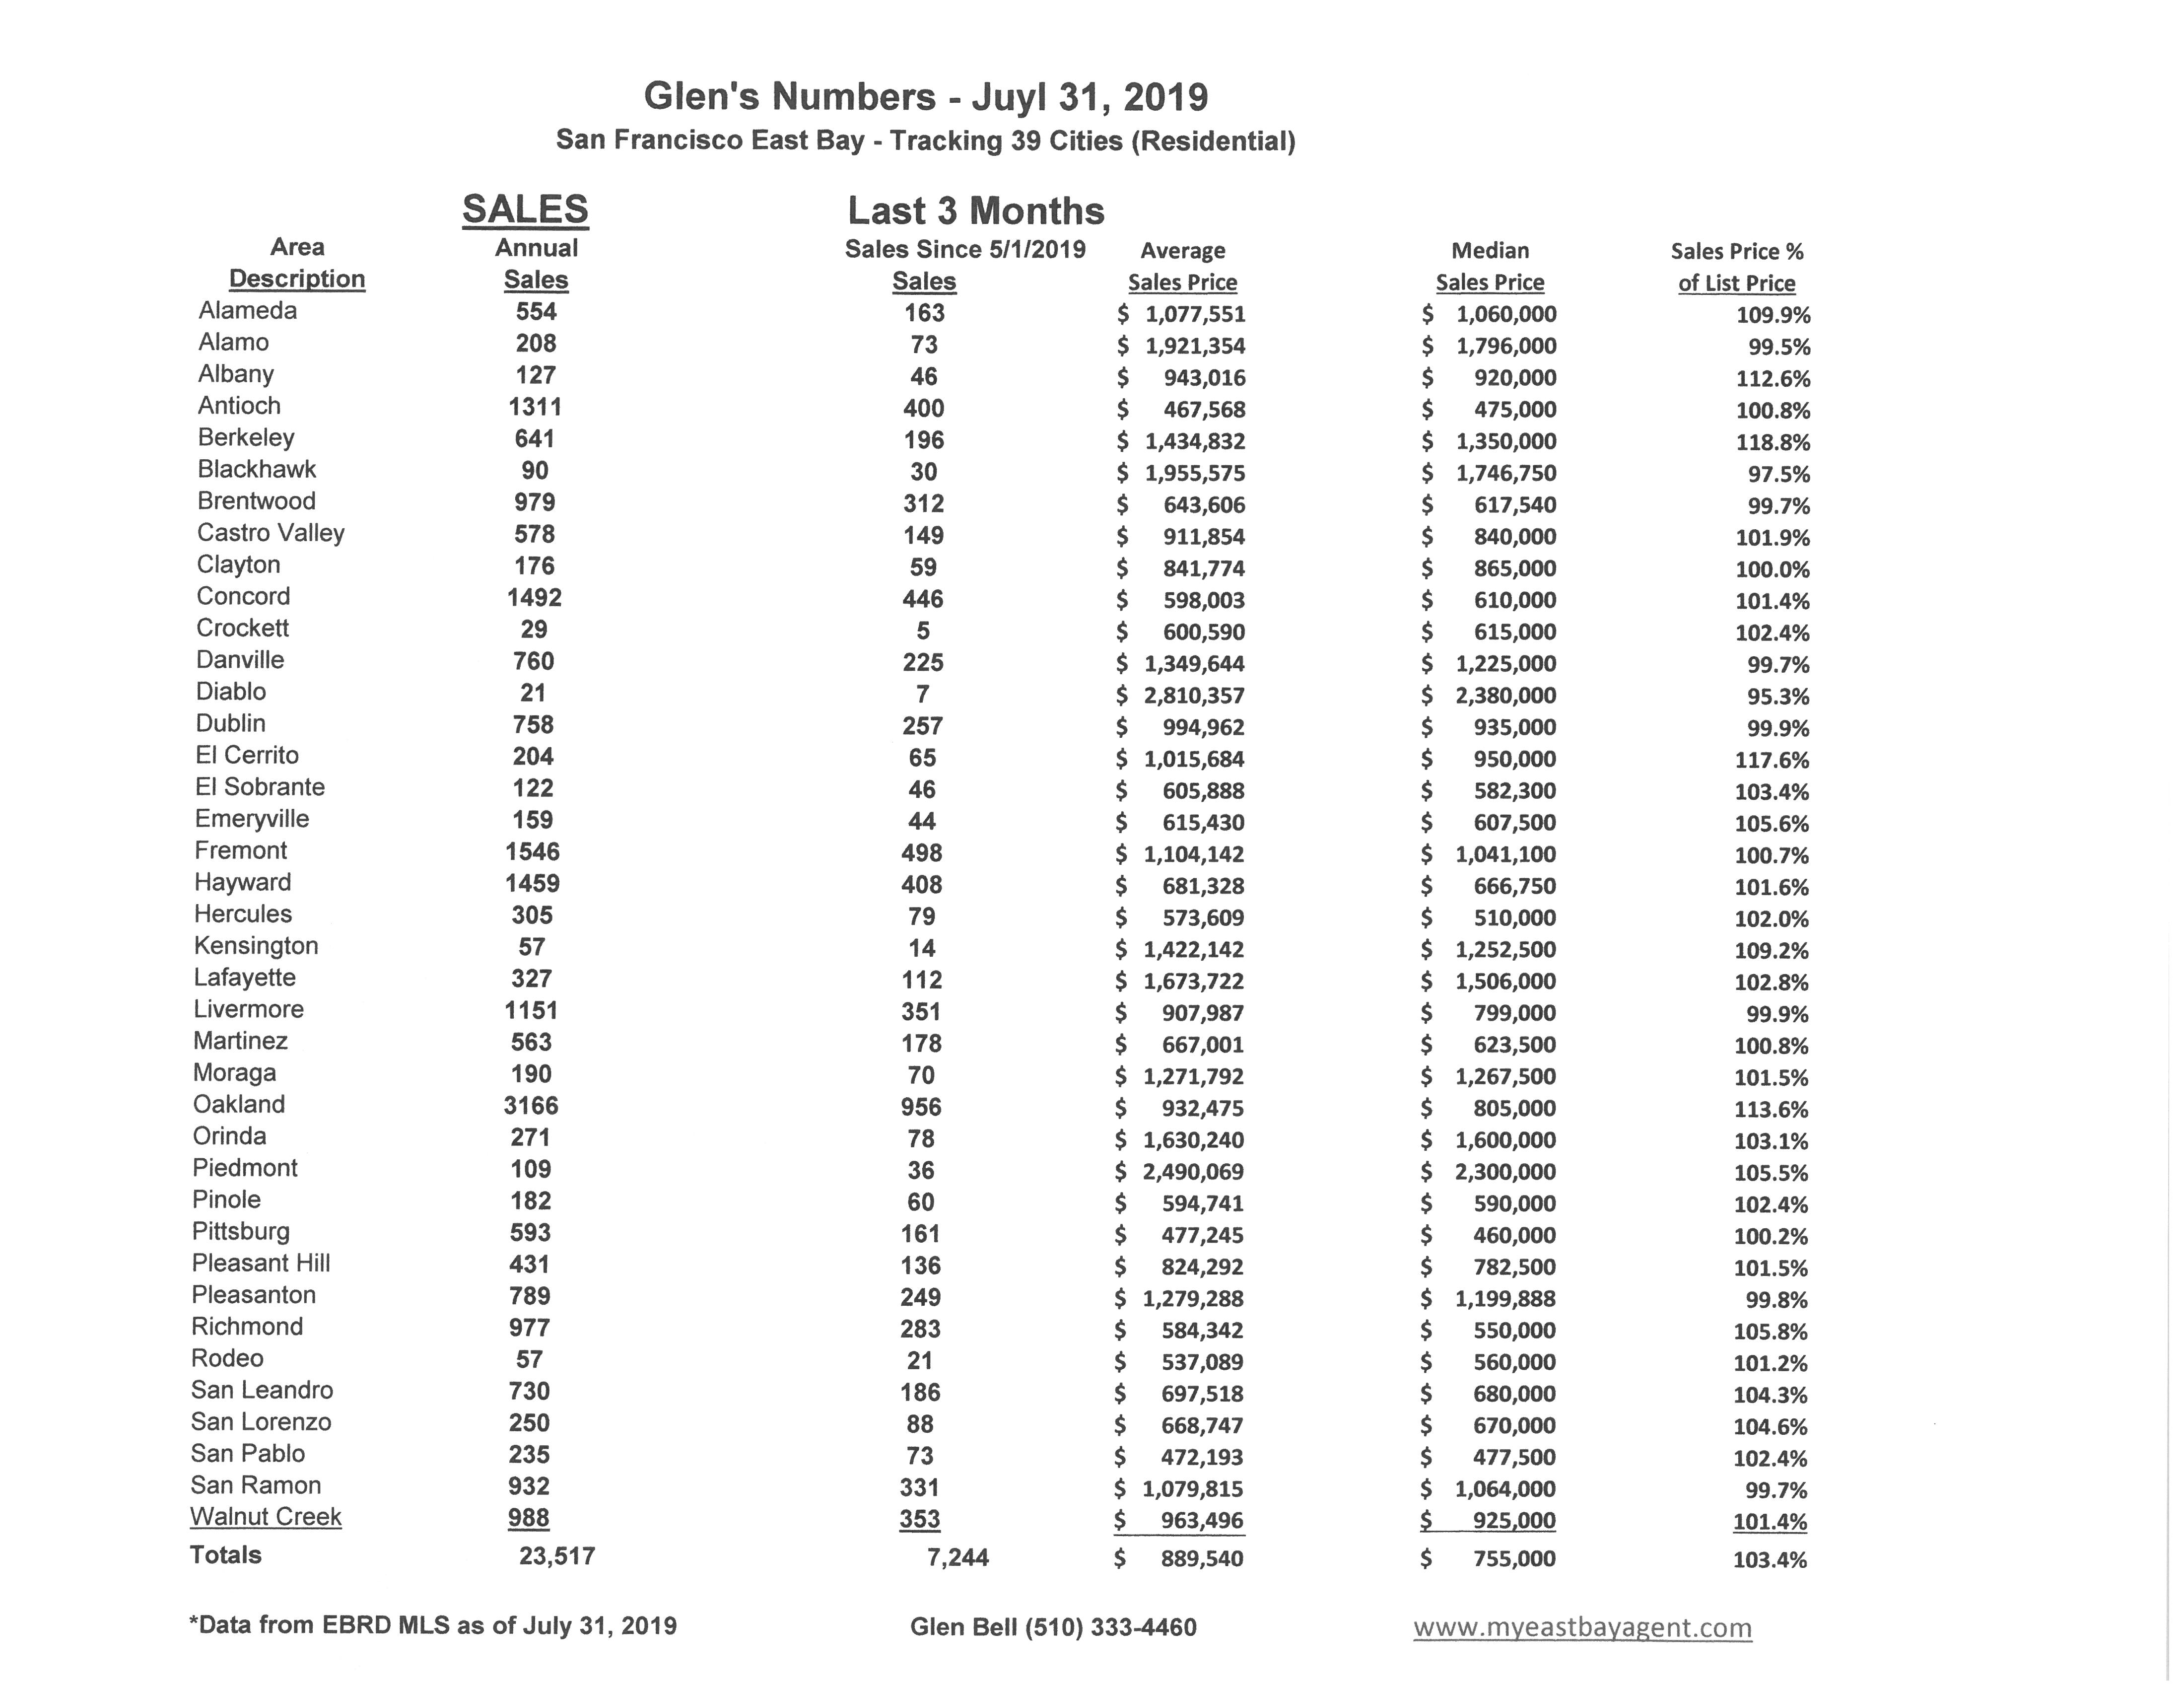
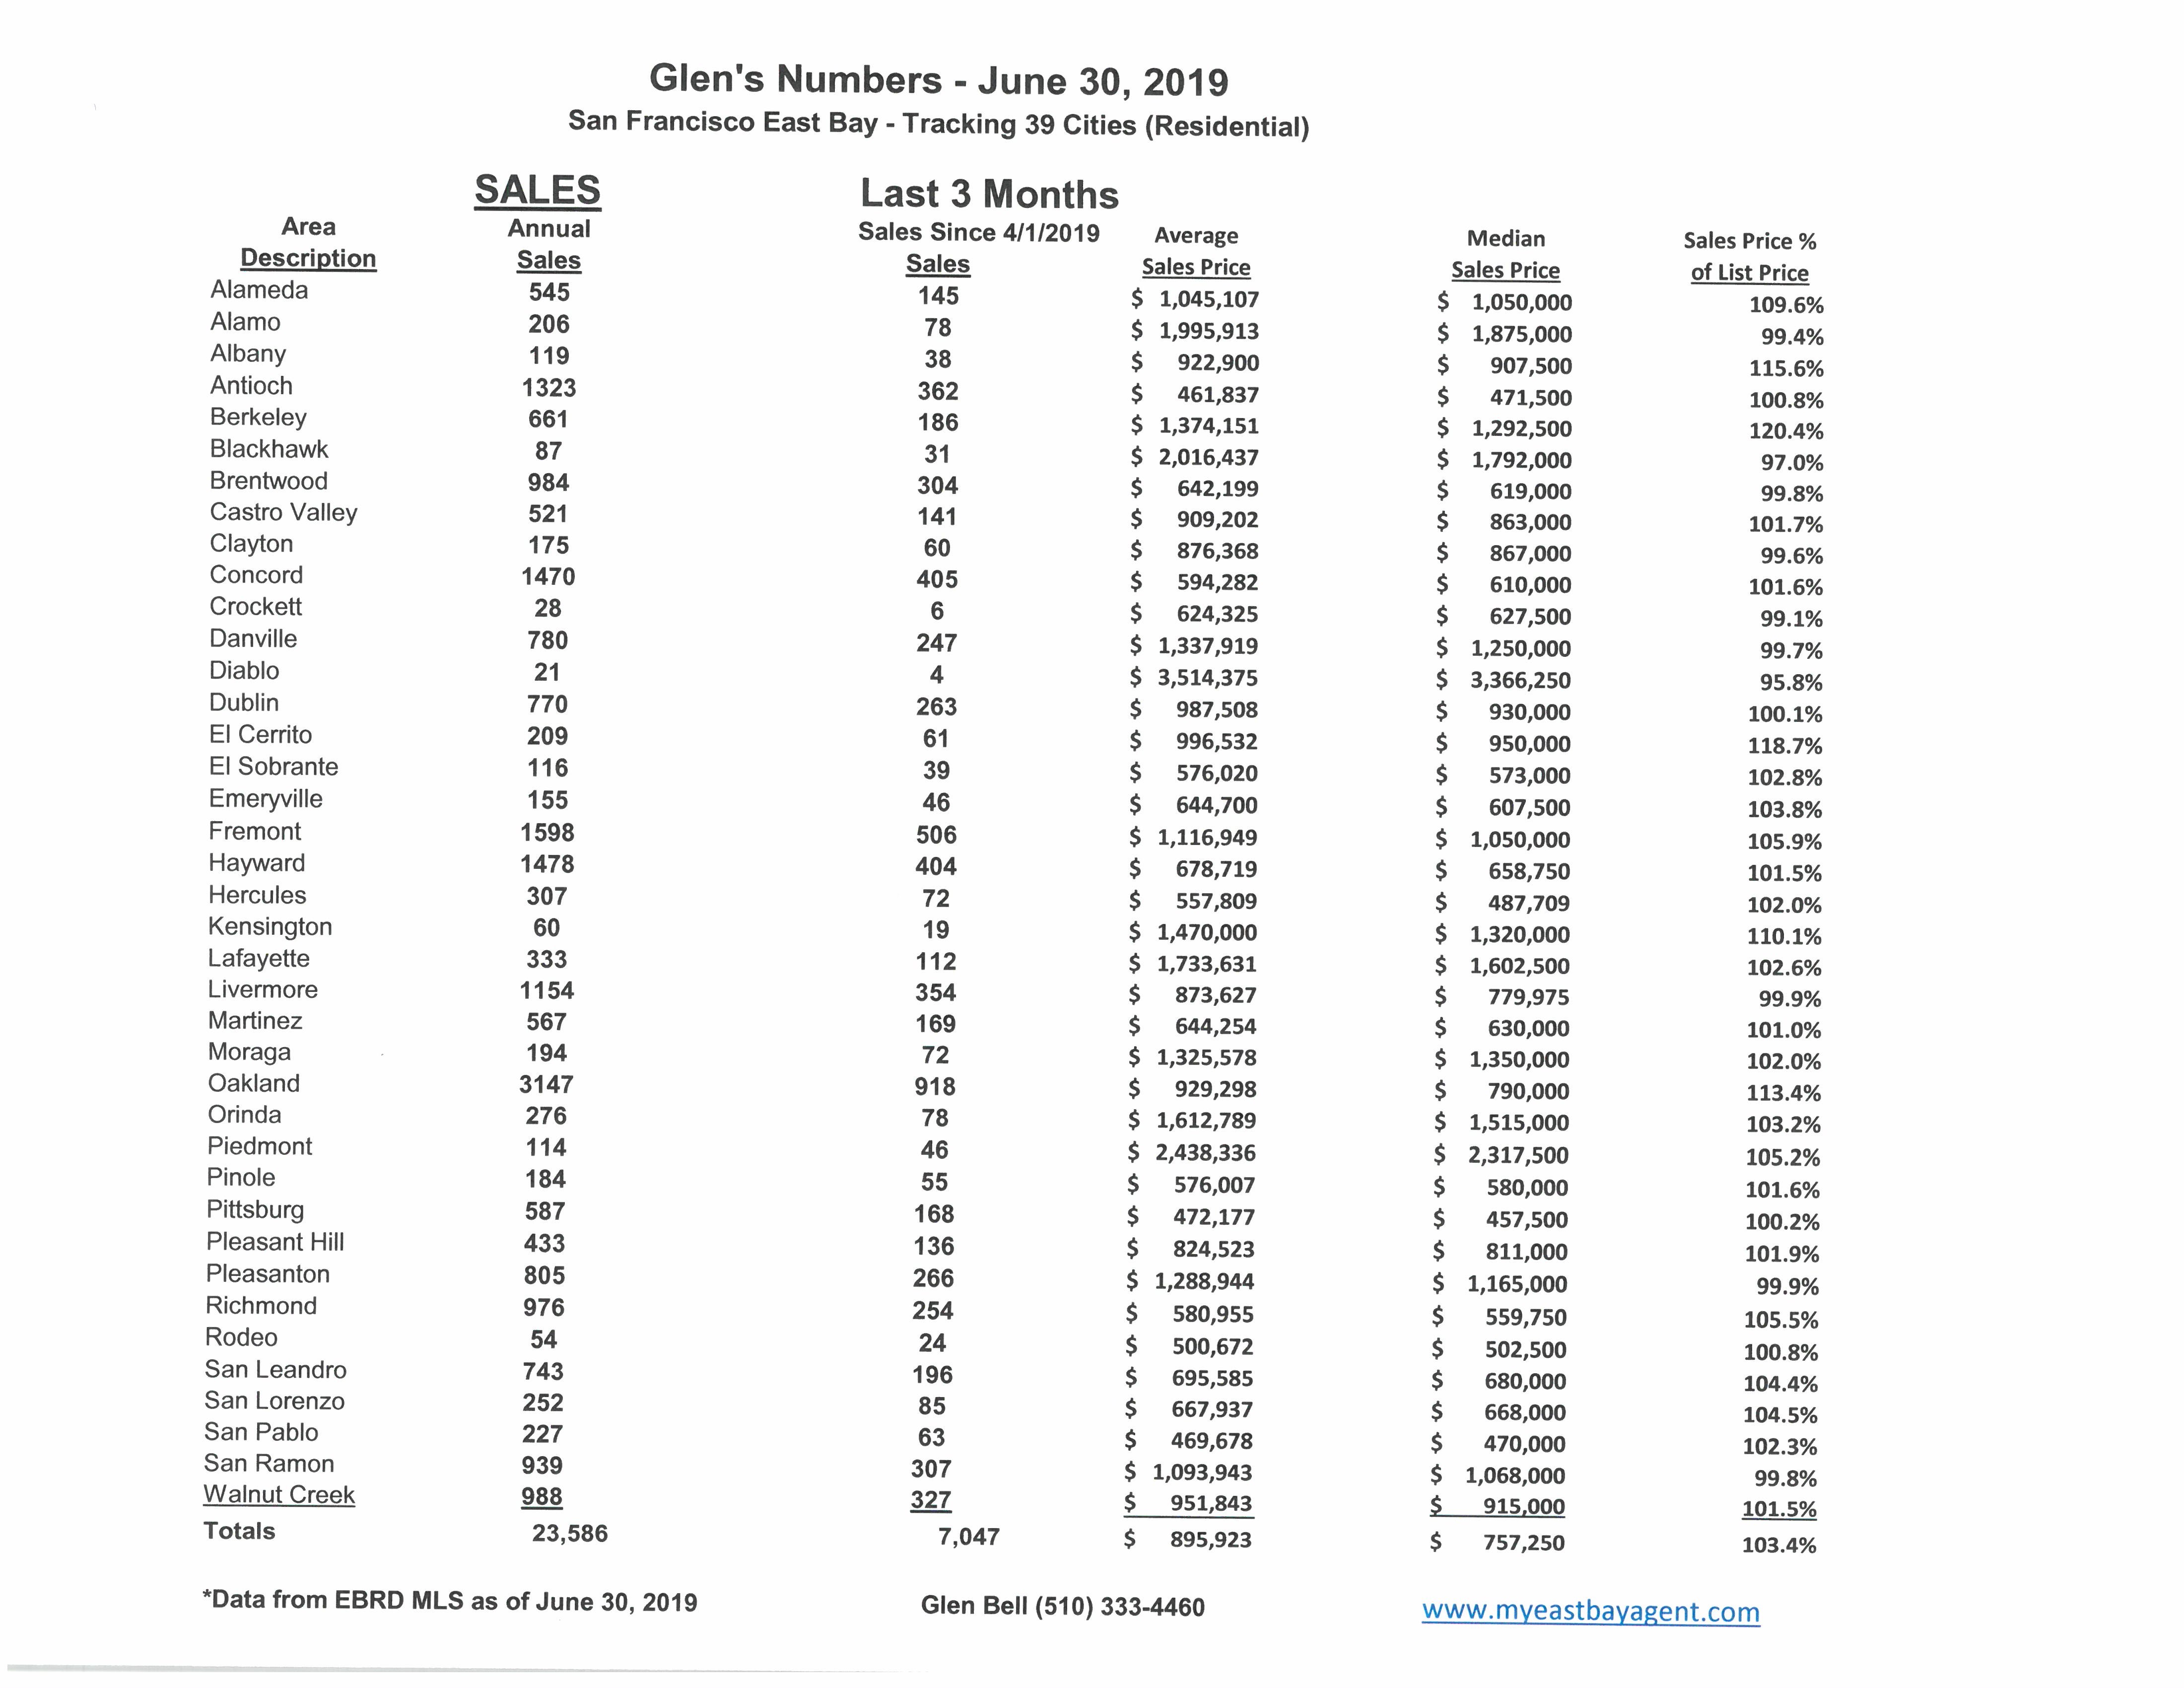
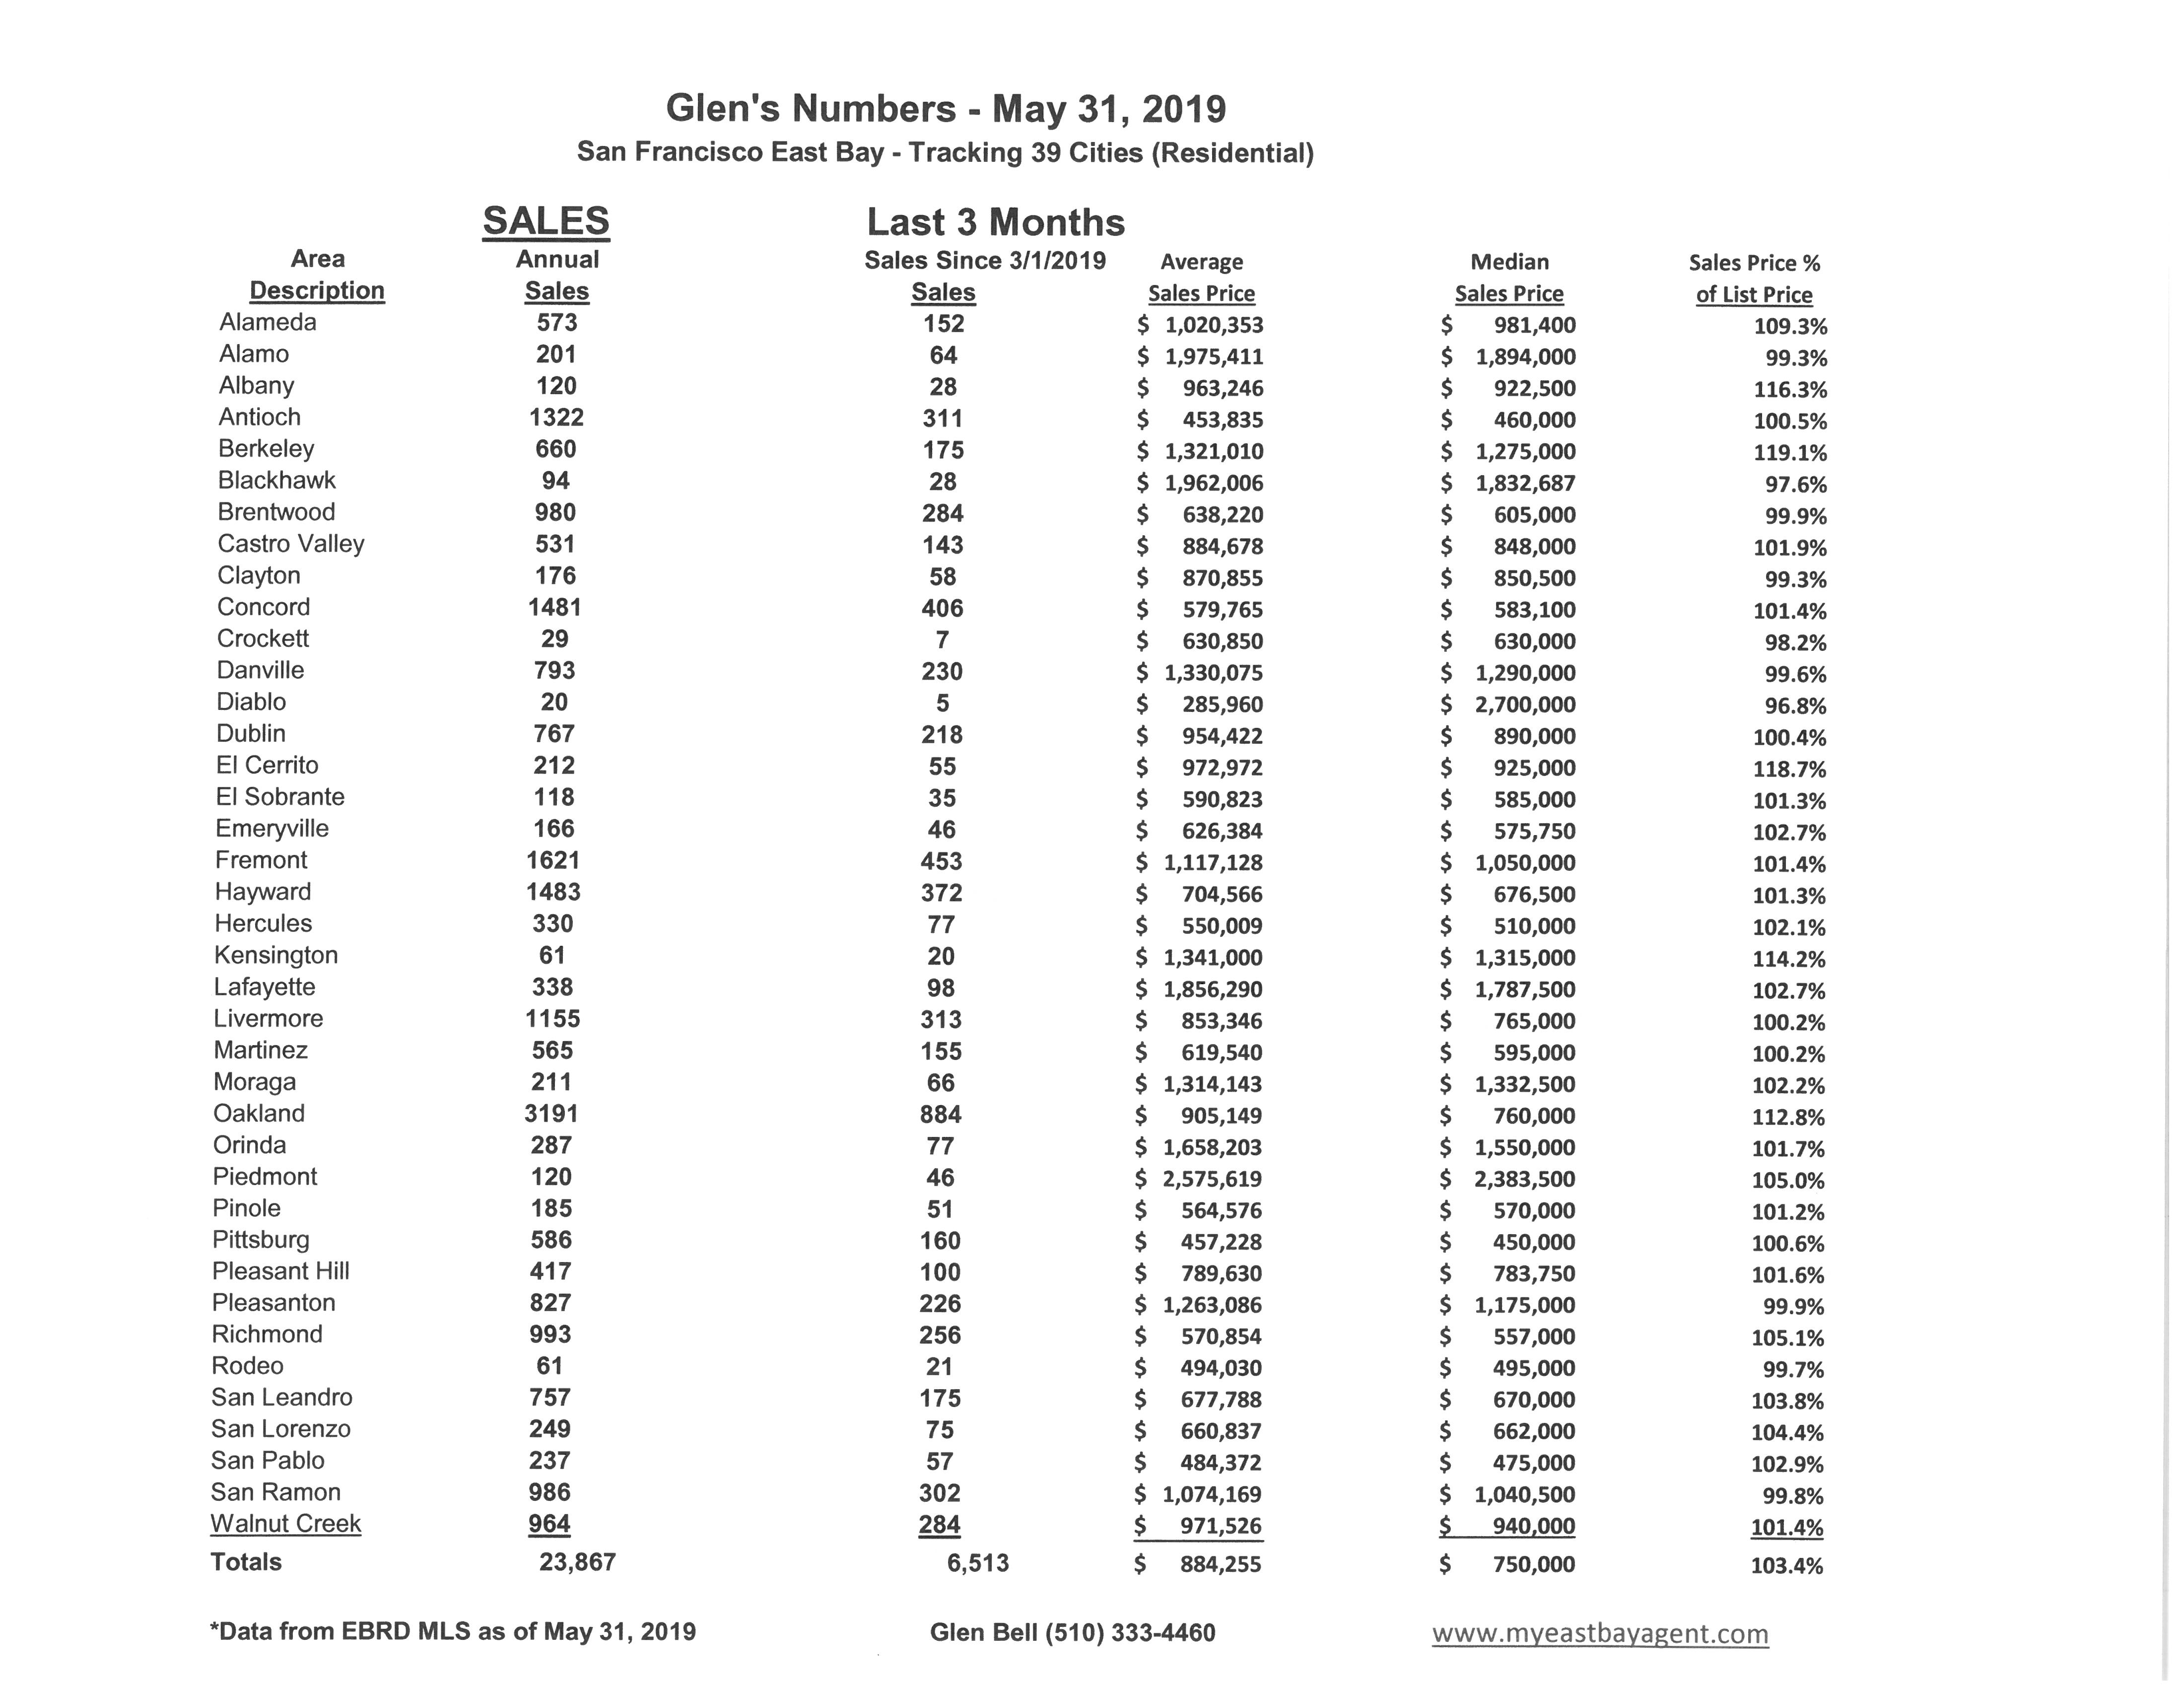
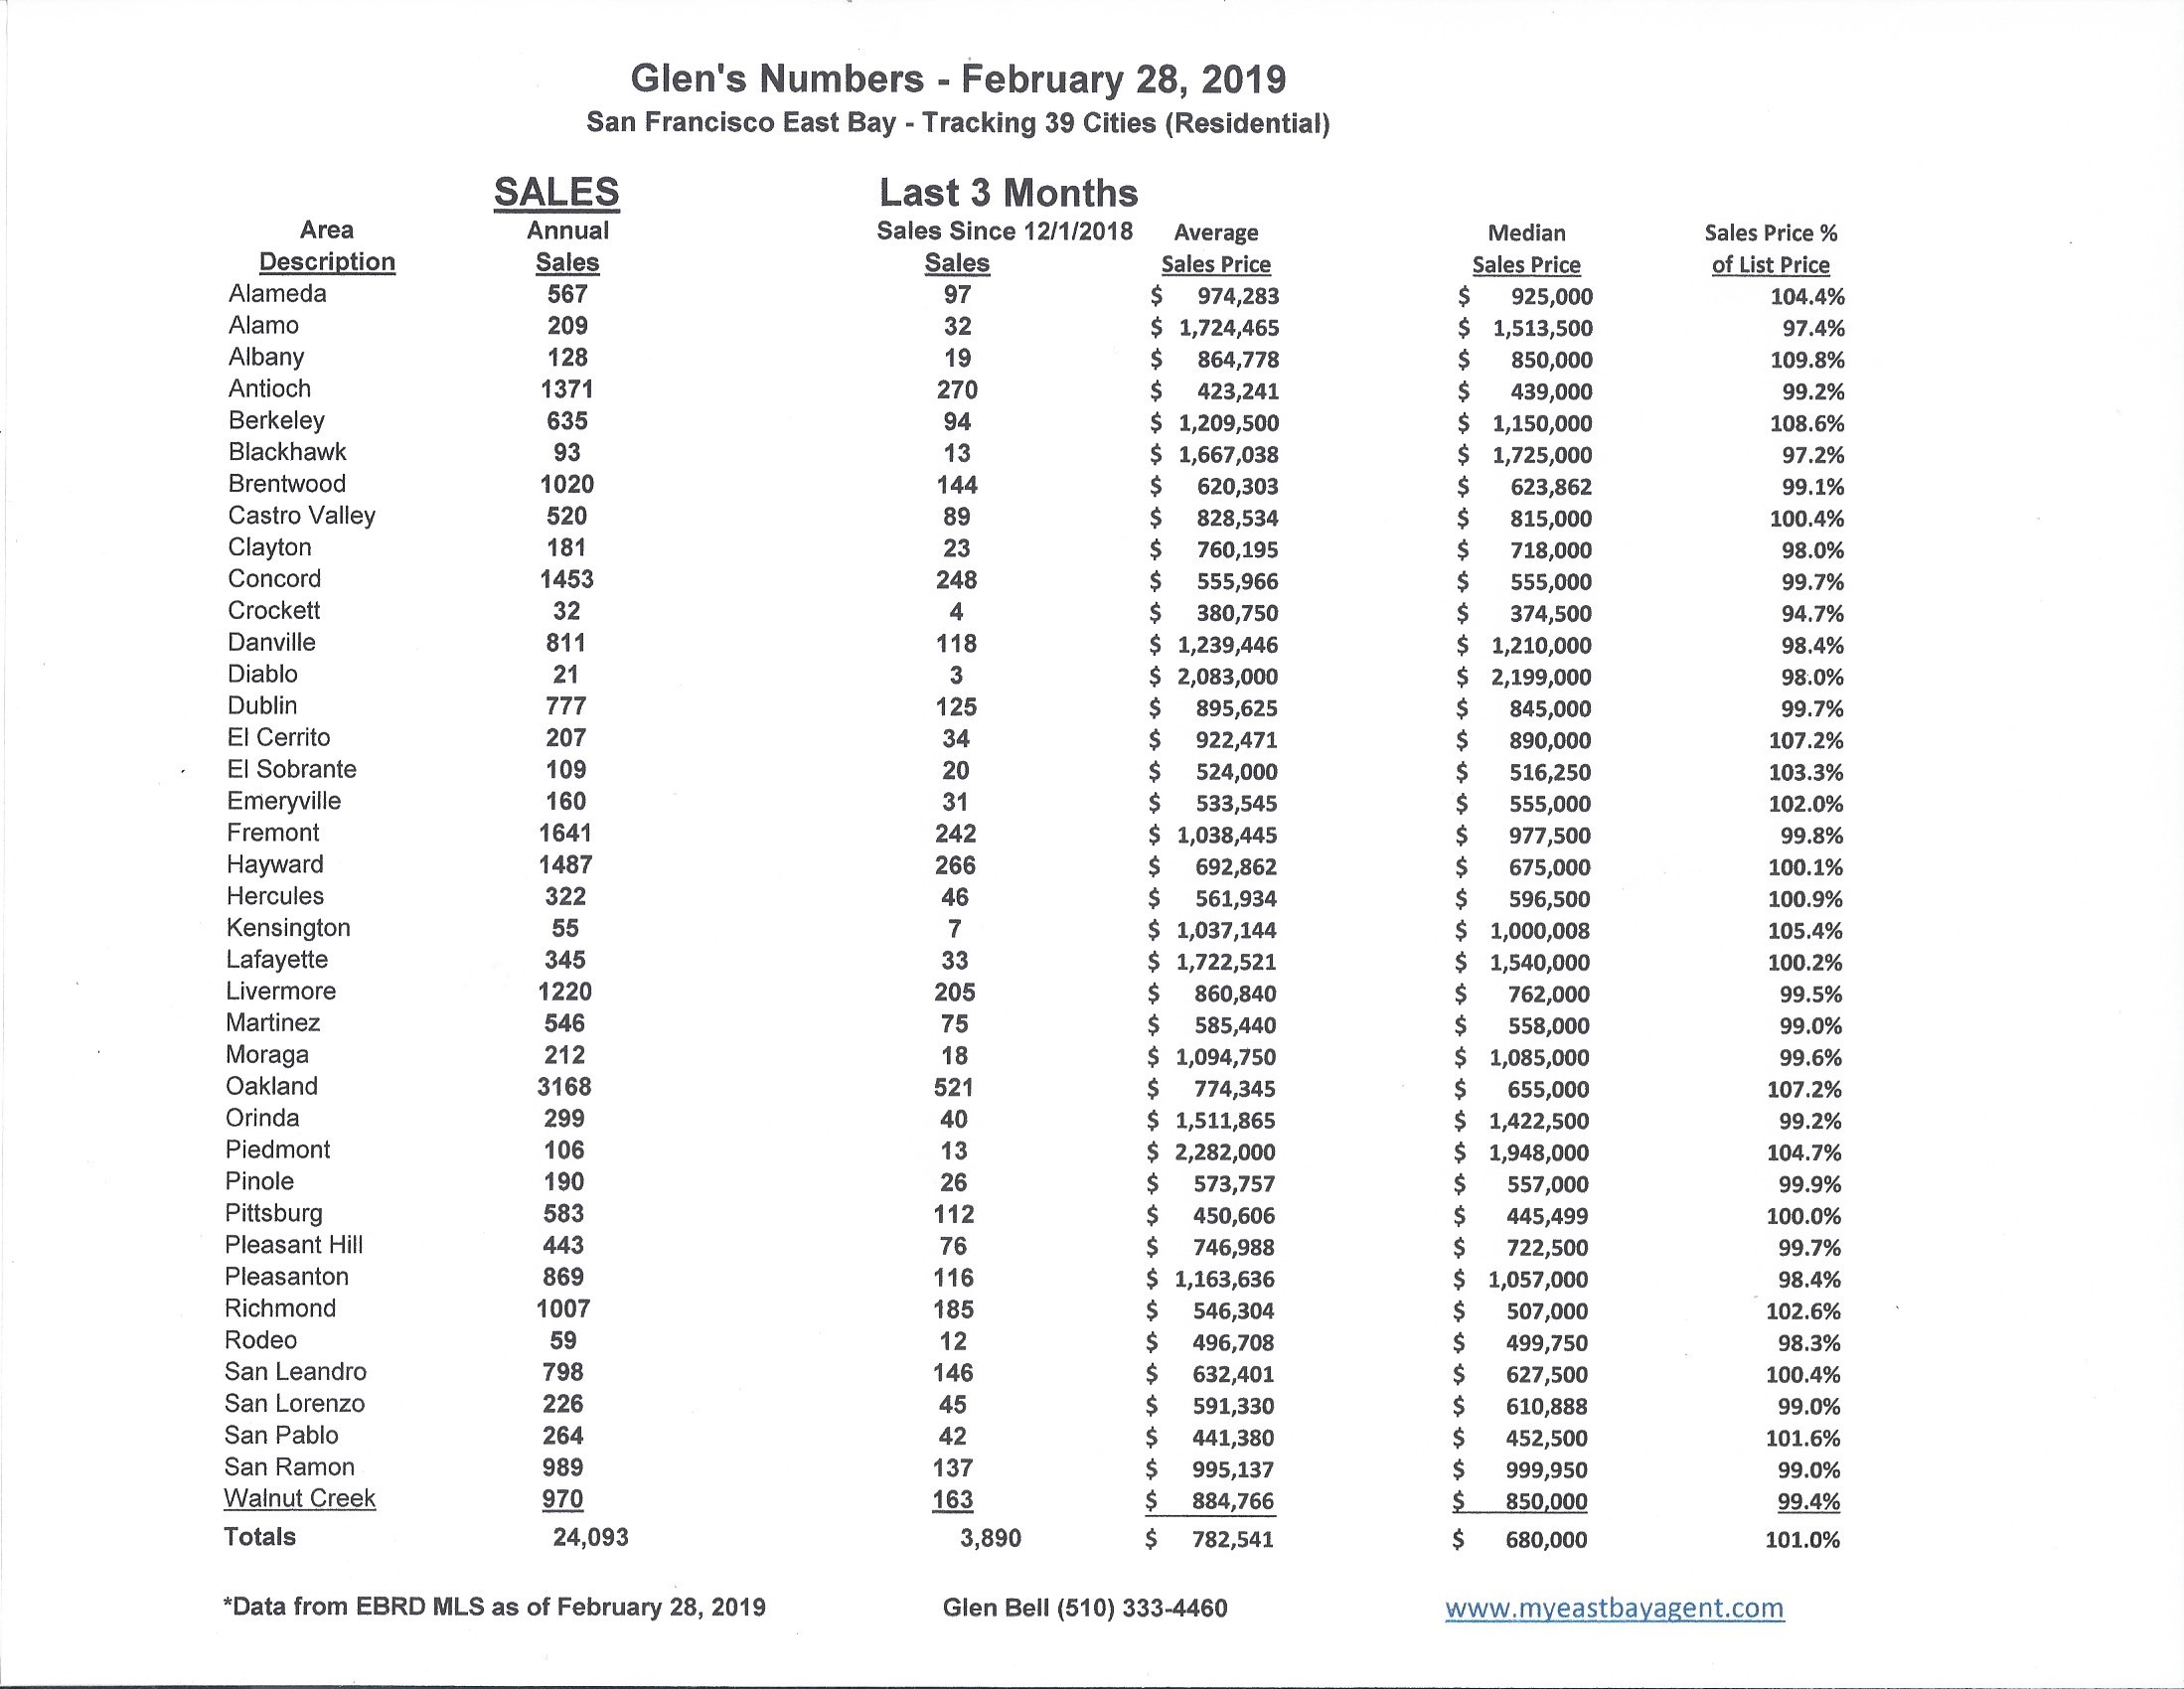
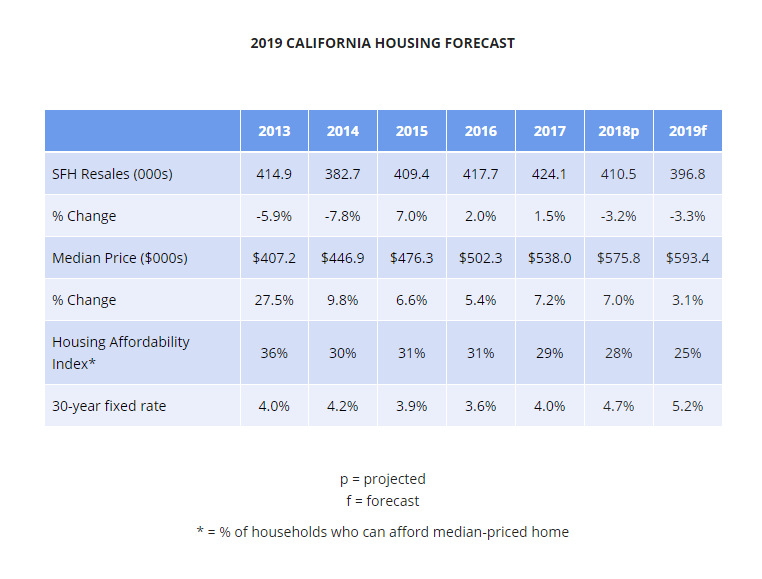
- Sales over the last 3 months, on average, are 3% over the asking price for this area, lower than what we saw last year at this time, of 4.9%.
Recent News
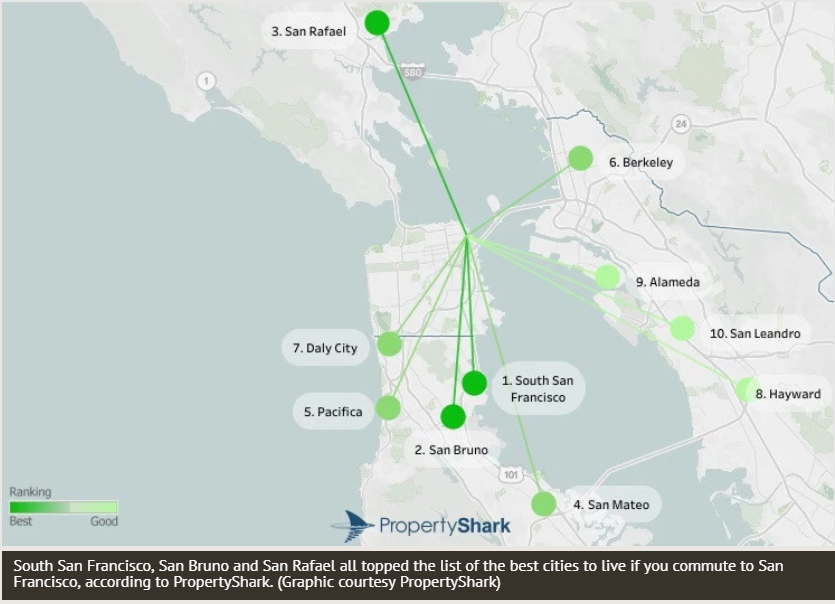
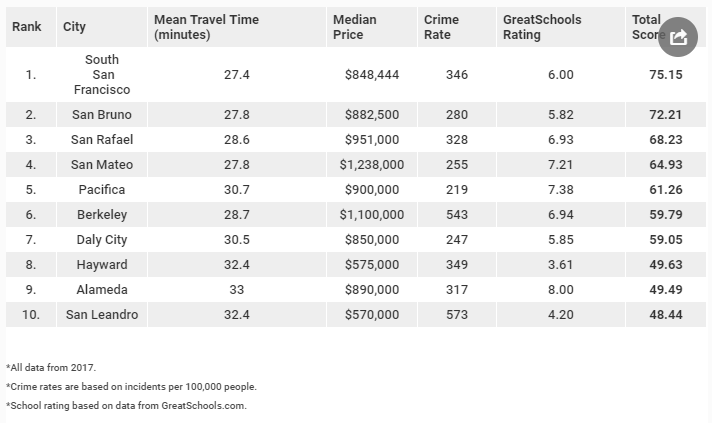
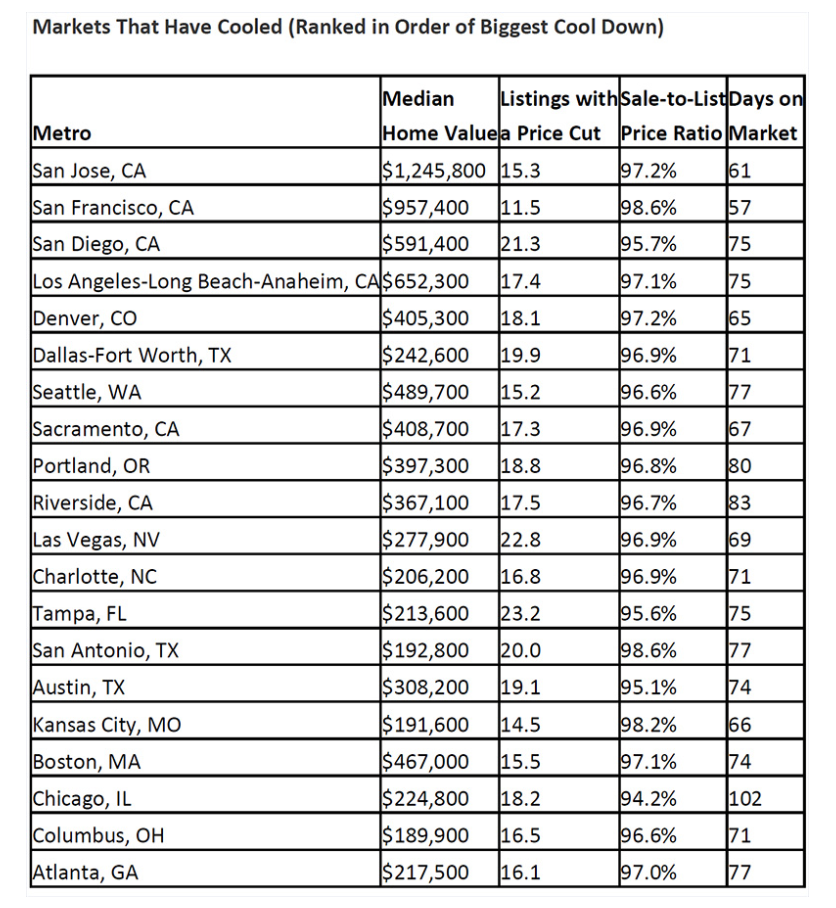
Bay Area home market, getting looser, is still tight
Bay Area buyers most likely to pay over price
By Louis Hansen, Bay Area News Group, September 9, 2019
Despite falling prices and sluggish sales, Bay Area home buyers can’t expect to sniff out too many bargains.
Name almost any city in the nine-county region — say, San Jose, Oakland, San Francisco or Concord — and it’s where buyers are most likely in the country to pay over list price, waive contingencies, buy quickly and generate a windfall for long-time homeowners, according to a new study from Redfin.
The hottest spots for sellers include San Carlos, Mountain View, Daly City, Palo Alto and Belmont on the Peninsula, and Contra Costa Centre (a transit community near Walnut Creek), San Lorenzo, Alameda, San Leandro, Pleasant Hill and Albany in the East Bay, according to the national brokerage. The cities ranked at least 92 out of 100 in Redfin’s competition index. Nearly 70 Bay Area cities have markets rated at 90 or above, a mark the company ranks as most competitive in the country.
The national real estate firm ranked more than 1,000 cities across the U.S. The company considered information reported from Redfin agents and other listing and sales data to figure the amount of time a property spent on the market, how many offers were made, whether buyers waived contingencies to the sale and other factors.
The Bay Area housing market has downshifted from last year’s peak but is still making millionaires of long-time homeowners and frustrating buyers with near-record prices. Bidding wars have cooled in the region, but relative to the rest of the country, the Bay Area is still among the hardest places to buy into.
Redfin chief economist Daryl Fairweather compared the region’s market to a weather report: Bay Area real estate temperatures may have slipped from 100 to 90 degrees, while the rest of the country has inched up from 50 to 55 degrees.
A year ago, the Bay Area was also the most competitive real estate market in the country, along with Seattle, San Diego and Denver, said Redfin lead economist Taylor Marr. But higher interest rates last fall and a general slowdown have pushed other western cities toward a market with more choices and some lower prices for buyers.
The Bay Area, however, has remained resilient. The nine-county region added nearly 5,000 jobs in July, led by hiring in Santa Clara County, and also strong employment growth in San Francisco and the East Bay, according to state economists. The region was responsible for 4 in 10 of the state’s new jobs in the first half of 2019.
“The jobs are there,” Marr said. “It’s still a competitive market.”
He added that while the effect of tech IPOs on the market is hard to measure, the new wealth unleashed can stabilize and bring higher prices to the market in the long term.
Agents say the market has cooled — but not enough to slow down multiple offers in desirable cities. San Carlos, for example, had just 11 homes newly listed for sale in July, a roughly two weeks supply to satisfy buyers.
Redfin manager Julie Zubiate said San Carlos has a thriving downtown and good schools — two amenities popular with tech workers with young families.
The markets in San Mateo and Santa Clara counties popular with tech workers have shifted in the past 12 months. A property that once received nearly 20 offers might attract 5 to 10 today, Zubiate said. “It’s cooled a tiny bit.”
Sophia Niu, a Keller Williams agent specializing in Alameda, said competition in the island city has pushed inventory down to about 30 homes on the market — about 2 to 4 weeks worth of sales, she said. Well-priced, single-family homes offered at around $1 million typically draw between 5 to 7 bids, she said.
Although Alameda sales have slowed from last year’s peak, she said, “right now, the market is still strong.”
Alameda has become more attractive to San Francisco residents tired of paying high rents for small apartments. Niu even saw a bumper sticker around town recently: “Alameda: Where hipsters
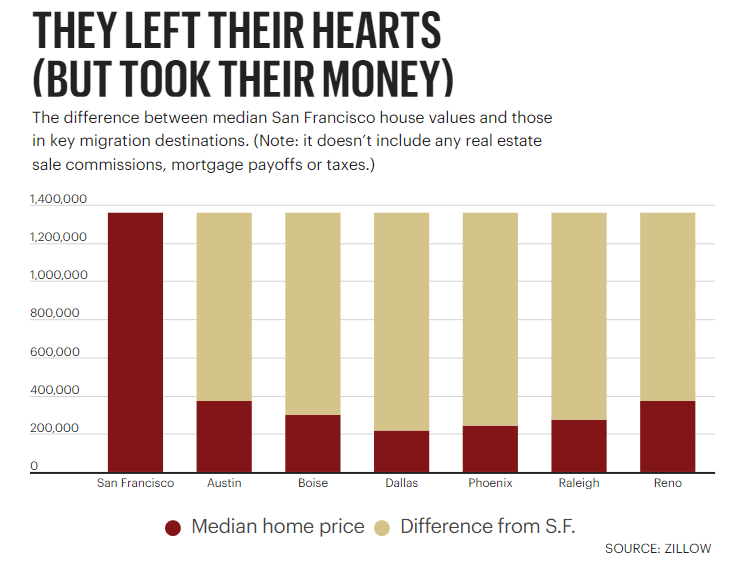
Bay Area exodus: Thousands more fleeing region than arriving from other states
Contra Costa County residents are particularly likely to leave the Bay Area behind, for places like Texas and Oregon
By Emily Deruy, Bay Area News Group, September 1, 2019
Even with its lucrative tech jobs and some of the best weather in the country, thousands more people have fled the Bay Area’s high housing costs and jammed roads than have moved into the region from other parts of the United States in recent years.
According to new data from the U.S. Census Bureau, the five-county Bay Area lost a net total of nearly 35,400 people between 2013-17, not counting births and new arrivals from other countries.
“It is a troubling sign of the affordability crisis of the region,” said Jeff Bellisario, director of the Bay Area Council Economic Institute.
But, Bellisario said, when factoring in international immigration, there are still more people arriving than leaving. According to the state’s Department of Finance, he noted, some 44,729 people immigrated from other countries to the region between July 2017 and July 2018.
And while Carl Guardino, CEO of the Silicon Valley Leadership Group, a business advocacy group, thinks the Bay Area is fortunate to attract talented immigrants, he’s also concerned by the data.
“All too often,” Guardino said, “we’re seeing folks like me, who were born and raised here, who simply want to be able to have a home at least somewhat close to where we work, leave.”
According to the latest Silicon Valley Index, a report from Joint Venture Silicon Valley that examined tech sector migration trends, some 30 percent of tech talent aged 25-44 who moved to Santa Clara County in 2017 came from outside California, with many coming from other countries like India and China.
For Rachel Massaro, vice president and director of research with Joint Venture’s Silicon Valley Institute for Regional Studies, the data raises concerns about the Bay Area’s education system and untapped potential.
“Not only are we not educating people here well enough to compete for those high-level jobs,” Massaro said, “but we’re also especially not educating women well enough in those particular fields of need in Silicon Valley.”
Alameda County saw the most outward migration, with almost 13,000 more people leaving than arriving, according to the new census data. Santa Clara County came in second, bleeding a total of almost 8,200 people. San Francisco saw the lowest net losses at just 1,385 people over those five years.
As in the past, Texas and Oregon remained popular locations for those leaving the Bay Area, according to the data released this week. A net total of more than 4,000 people moved to the Lone Star State, while more than 3,600 decamped to Oregon. Nevada, Washington and Arizona were popular choices, as were Idaho, Tennessee and North Carolina.
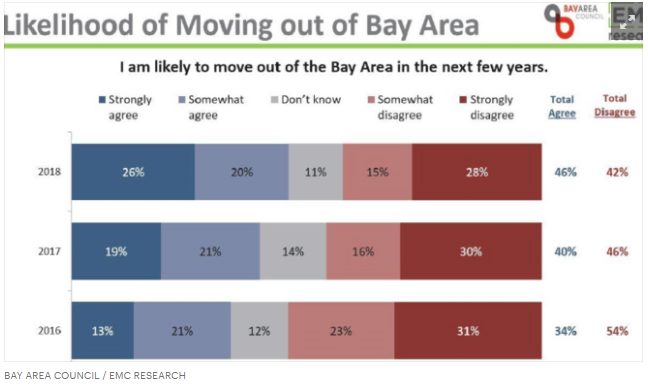
A poll conducted earlier this year for this news organization and the Silicon Valley Leadership Group found that 44 percent of those surveyed said they were likely to move away from the Bay Area within a few years, pointing to housing and living costs as key factors prompting them to leave.
“We are hollowing out our middle class,” Guardino said.
While local home prices began softening in March after seven years of rising prices, the Bay Area remains among the priciest housing markets in the country, with median home prices above $1 million in San Francisco, San Mateo and Santa Clara counties.
Still, even as thousands of Bay Area residents pack up and head out, thousands of people move in. New Yorkers, especially, still find the Bay Area attractive, with a net total of more than 3,600 people moving from the Empire State to the Bay Area. People from Illinois, New Jersey, Pennsylvania and elsewhere were also still moving to the Bay Area in significant numbers.
When higher-skilled, higher-paid workers from such places move in and lower-wage workers move away, Bellisario said, “that adds to some of the income inequality we have across the region here.”
People also relocated within the Bay Area.
People from San Francisco County were most likely to move to Alameda County, home to Oakland.
Residents of Alameda County were most likely to go to Contra Costa County, with residents of that county unlikely to relocate within the Bay Area and more likely to head for cheaper parts of California or other states like Texas, Nevada and Washington.
Many people, Massaro and Bellisario said, are choosing San Joaquin County and Sacramento.
Residents of San Mateo County were more likely to move to the East Bay than to San Francisco or the South Bay, while Santa Clara County residents moved to all four of the other Bay Area counties.
According to the Silicon Valley Index, many local tech workers are heading to other burgeoning tech centers like Austin and Portland. Seven percent of the new tech talent that moved to Seattle in 2017 came from California, according to the report.
Guardino is not surprised.
While the Bay Area is still attractive to companies because of its talent pool, fed in part by world-class universities, the housing shortage and traffic are its “Achilles’ heel,” he said. Competitor regions, he added “are growing stronger because of these issues.”
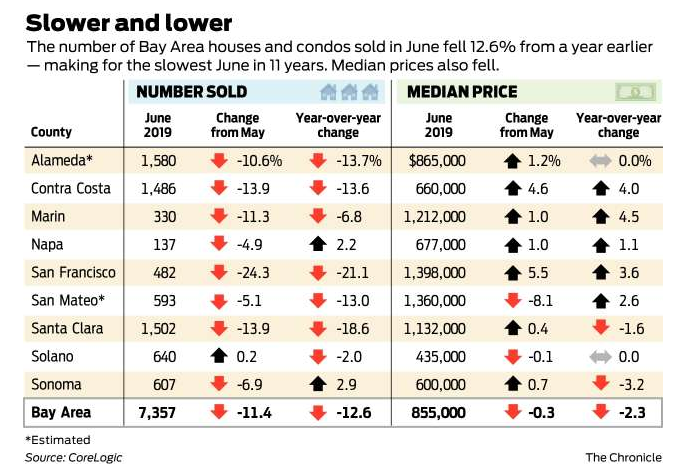
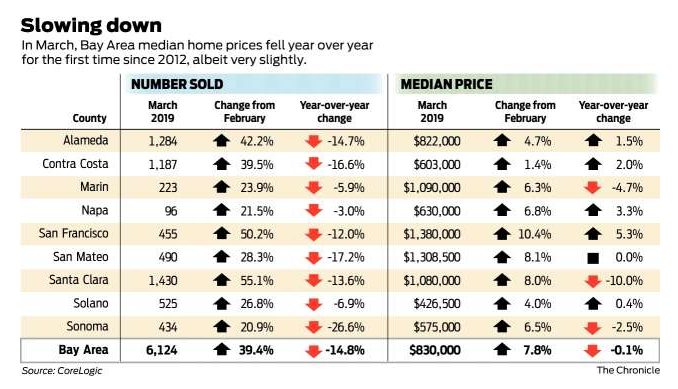
Bay Area homes got slightly more affordable in July as prices and mortgage rates fall
By Kathleen Pender, SF Chronicle, August 29, 2019
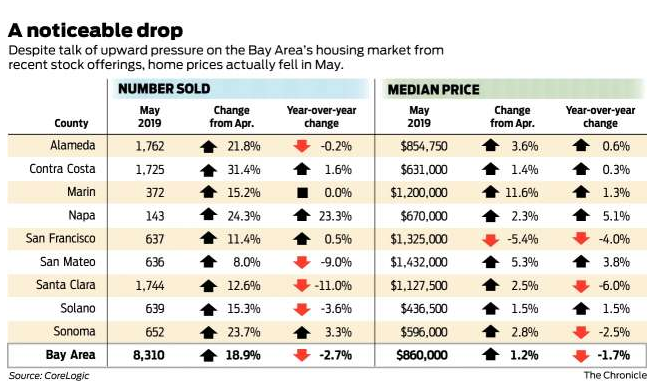
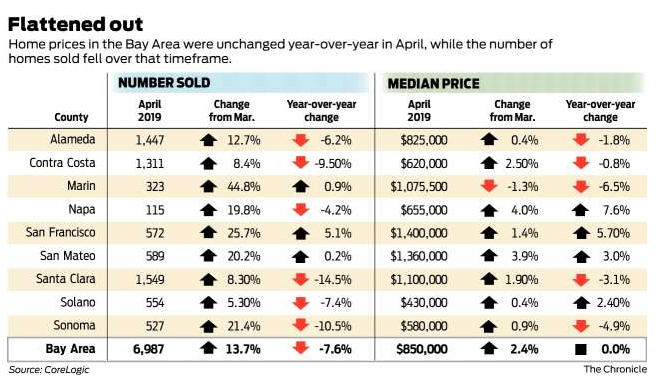
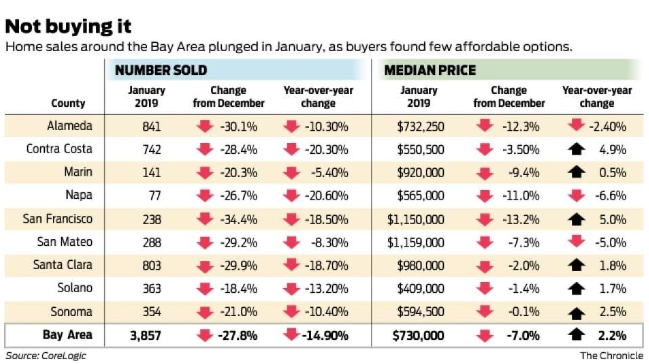
Bay Area homes are getting slightly more affordable thanks to falling prices and lower mortgage rates. The median price paid for all new and existing homes and condos in the nine-county region fell to $815,000 in July, down 4.7% from June and down 4.1% from last July, according to a report released Thursday by CoreLogic.
July was the third consecutive month prices fell on a year-over-year basis, starting with a 1.9% decline in May and a 2.2% dip in June, CoreLogic said in a release.
Last month’s drop was the biggest since December 2011, when the median price fell 10.5% year over year. “Before this March, the median sale price had risen on a year-over-year basis for 83 consecutive months,” it said. The highest recorded median was $875,000 in June.
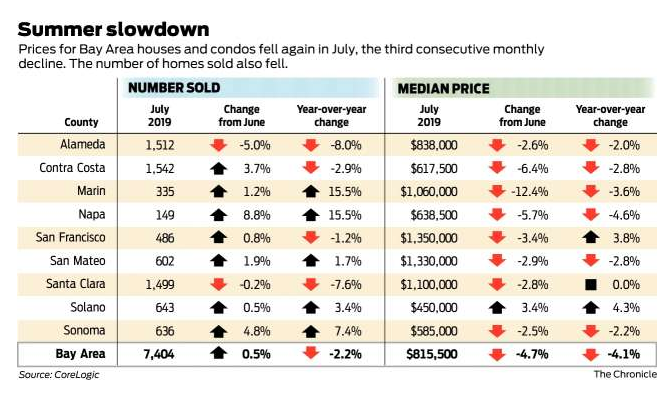
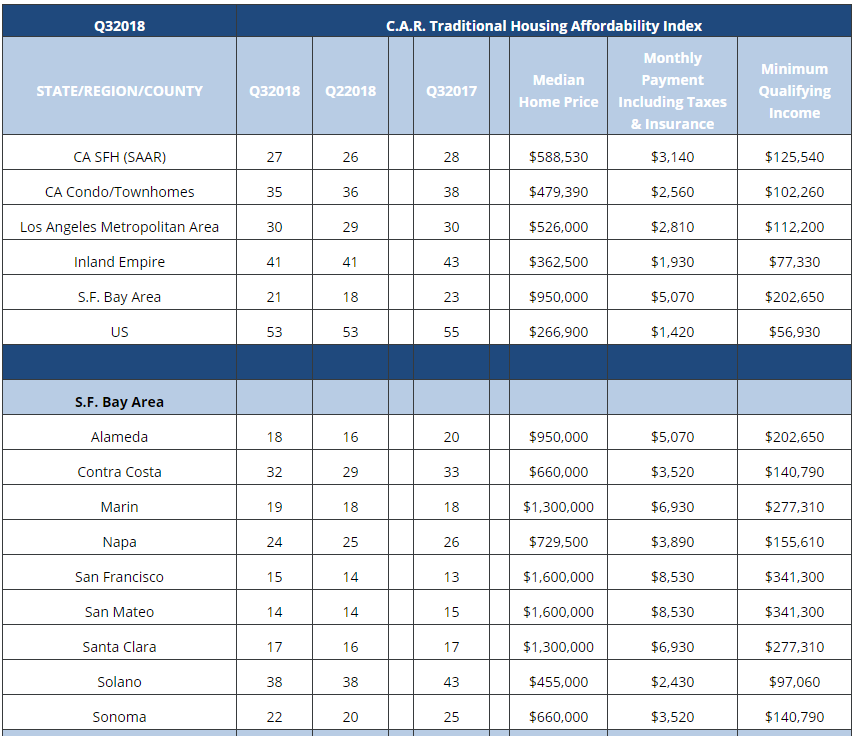
The only Bay Area counties where the median price rose year over year were the most and least expensive. In San Francisco, the median gained 3.8% to $1.35 million, and in Solano it was up 4.3% to $450,000. The median is the point at which half of homes sold for more and half sold for less.
Prices for resale condominiums took the biggest price hit in July, falling 10.9% year over year to $668,500. Prices for existing single family homes fell only 1.2% while new-home prices fell 3%, according to CoreLogic data.
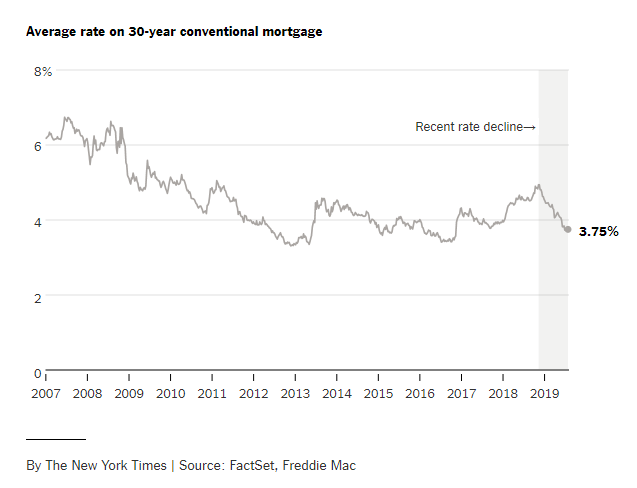
Recession fears have sent bond yields lower, and that’s pushing down mortgage rates, too. The average rate on a 30-year fixed-rate mortgage was 3.6% this week, up slightly from 3.55% last week but down almost a full percentage point since this time last year, Freddie Mac reported Thursday.
“Lower mortgage rates and the slowing, if not elimination, of price growth in many areas makes a meaningful difference for some buyers,” CoreLogic analyst Andrew LePage said in a news release.
Anecdotally, real estate agents and buyers say the market remains mixed.
“Some areas are very hot with multiple offers; another house can sit a block away and not get any offers,” said Nicole Aissa, a broker with Keller Williams Peninsula Estates.
Although many homes are still selling for more than the asking price, in some cases they’re getting less than what Realtors and sellers expected.
“The trend is to list homes under market value so when it gets bid up it looks like it went way over asking,” said Gillian Leslie, an agent with Red Oak Realty in the East Bay.
She had clients interested in a home listed at $1.8 million. It sold for $2.175 million, but “the expectation was that it would go for $2.3 or $2.4 million,” Leslie said.
Tiffany Schrader-Brown and her husband bought a two-bedroom, one-bath home in Berkeley about seven years ago. Three years ago, they rented it out and moved to Philadelphia, where her husband did his medical residency. When they came back this year, they wanted a bigger home for their family, which includes three kids ages 11, 6 and 3.
They wanted a fixer-upper, since they are more affordable and she designs homes for a living, but “it seems like every one of them a developer has purchased. A lot have already been purchased and flipped,” Schrader-Brown said.
It’s easier to find duplexes and triplexes that could be turned into a single-family home, but that’s an arduous, time-consuming process and “I don’t want to take away from the housing stock,” she added.
There are some single-family fixer-uppers, she said, but they might be in a slide zone and still cost $1,000 per square foot. Or they have no utilities so they can’t get a bank loan.
But Schrader-Brown is optimistic.
“The market is changing now — I think it’s going to be more hospitable for me in the coming months, I hope. It seems that the smaller homes for people with one or two children seem to stay at a higher price point; the ones that are a little bigger seem to be declining.”
In San Francisco, the condo market “has been pretty stable for the entire year,” said Garrett Frakes, a managing director with brokerage firm Polaris Pacific. Condo prices for the three months ending July are basically flat with the same period last year. “Buyers can potentially get some discounts so instead of paying over list price, maybe they are paying slightly under list price.”
Inventory is creeping up, but still low. In San Francisco it would take just 1.6 months to sell all condos on the market at the current pace of sales. In Santa Clara and San Mateo counties, it would take about four months. “That’s still low from a supply standpoint but a heck of a lot better than two months.”
On the sales front, the number of Bay Area homes and condos that closed in July was 7,404, up 0.5% from June but down 2.2% from the same month last year. That was the lowest number of sales for the month of July since 2011, CoreLogic said. Sales have fallen on a year-over-year basis for 12 consecutive months.
On the bright side, the 2.2% decline in July was the smallest year-over-year decrease for any month since July 2018. Sales typically slow between June and July; since 1988, the average change between those two months is a 5.9% drop, CoreLogic said.
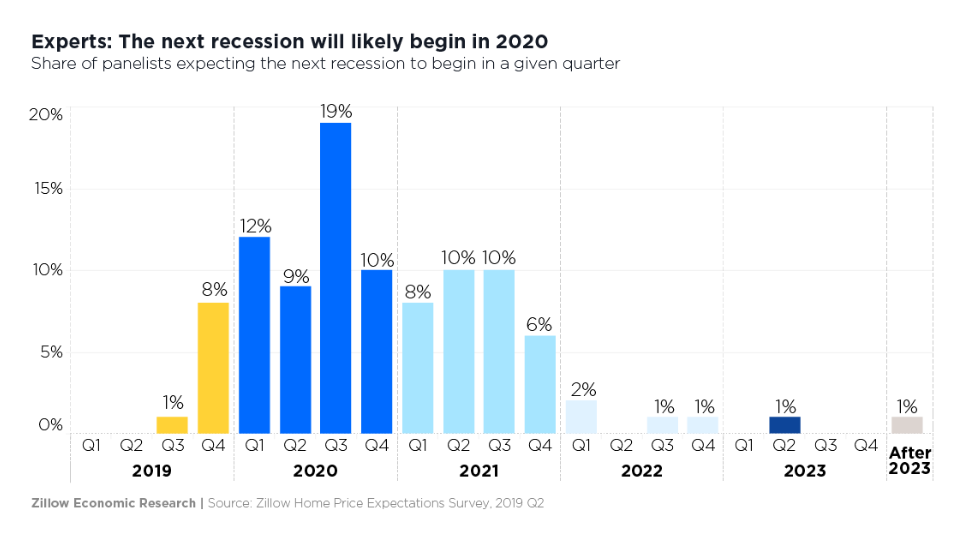
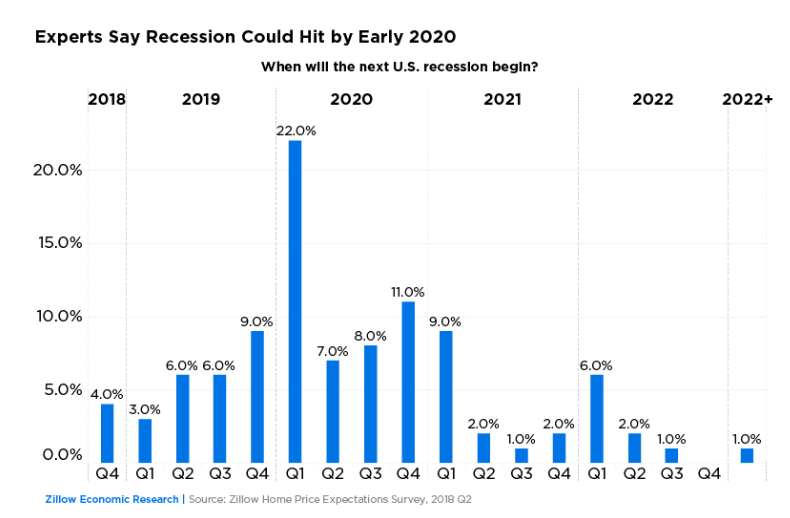
As Recession Fears Rise, Here’s the Lowdown for Real Estate
By Clare Trapasso | Realtor.com, Aug 26, 2019
It seems that whenever you pick up a newspaper or turn on the news these days, a scary word hits you in the face: “recession.” Germany is already teetering on the brink of recession; an unruly exit from the European Union this fall could cause one in Britain; and in the U.S., a rapidly escalating trade war with China is increasing fears.
But although the R-word may be a trigger for those who remember—or even experienced—the mass layoffs, scores of foreclosures, and plummeting home prices of the last downturn, folks shouldn’t panic just yet. And they shouldn’t expect another real estate fire sale.
“This is going to be a much shorter recession than the last one,” predicts George Ratiu, senior economist with realtor.com®. “I don’t think the next recession will be a repeat of 2008. … The housing market is in a better position.”
Federal Reserve Chairman Jerome Powell indicated on Friday that last month’s interest rate cut would be followed by another in September, but cautioned that that might not be enough to counter the trade tensions, which ratcheted up in recent days as China responded to an earlier round of U.S. tariffs with its own, and President Donald Trump responded by making U.S. restrictions even tougher.
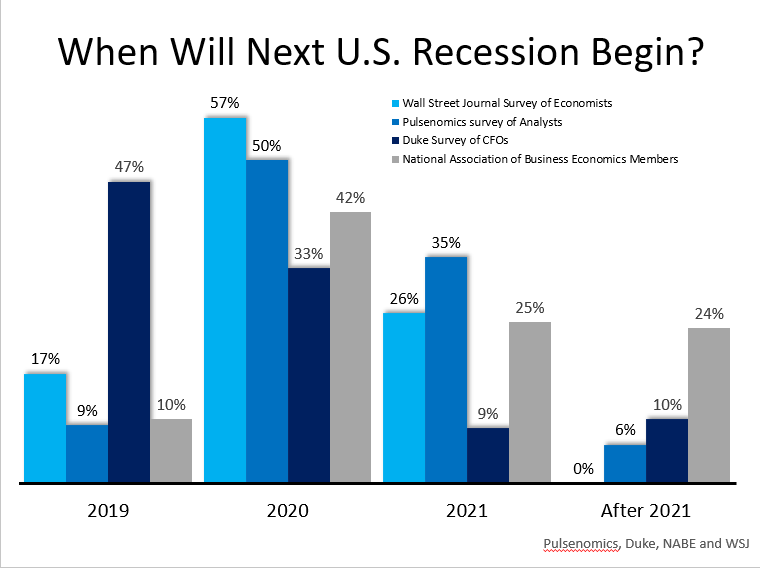
About 2% of economists, strategists, academics, and policymakers believe a recession will start this year, according to a recent survey of more than 200 members of the National Association for Business Economics. Thirty-eight percent believe one will begin in 2020, while 25% anticipate one starting in 2021. Fourteen percent expect it won’t materialize until after 2021.
However, Trump seems confident that there’s no risk of a recession at all. He’s been putting out a series of positive tweets about the economy for the past week or so.
He responded to China’s tariff announcement on Friday by tweeting, “Our Economy, because of our gains in the last 2 1/2 years, is MUCH larger than that of China. We will keep it that way!”
For sure, unemployment is hovering around the lowest it’s been in the past 50 years. (However, it turns out there weren’t as many jobs in 2018 and early 2019 as previously reported.) Wages are growing, and we’ve entered the longest economic expansion in U.S. history. But a downturn within the next two years still looks likely—particularly if a trade war heats up, making it more expensive to import goods. Those increased costs are likely to be passed along to everyday consumers.
The housing market’s risky mortgages and rampant speculation were blamed for plunging the world into a financial crisis the last time around. But these days real estate isn’t likely to be the cause of a recession.
Will home prices and sales plummet in a recession?
Aspiring buyers hoping that home prices will crash, like they did during the Great Recession, are likely in for a rude awakening. There simply aren’t enough homes being built to satisfy the hordes of buyers. And with more members of the giant millennial generation wanting single-family homes in which to raise their growing families, there isn’t likely to be a drop-off in demand anytime soon.
But the anticipation of a recession in itself could make the housing shortage even worse. Worried would-be sellers may decide to postpone listing until they can get top dollar for their properties.
Yet although a lack of homes for sale typically drives up prices, that effect could be mitigated if there are fewer folks who can afford to buy. In a recession, it could become harder to find a good-paying job or steady freelance work. Even those who remain gainfully employed may worry about their job stability.
“If we do go into a recession, there will be layoffs,” says Ali Wolf, director of economic research at Meyers Research, a national real estate consultancy. “If you move from a two-income household to a one-income household, it doesn’t change the desire to own. But it does impact the ability.”
Realtor.com’s Ratiu believes prices will flatten, but likely not fall. Meanwhile, the number of home sales will also remain flat or potentially even dip, he believes.
Other economists expect the recession to take a bigger toll on housing.
“With people having PTSD from the last time, they’re still afraid of buying at the wrong time,” Wolf says. “But prices aren’t likely to fall 50% like they did last time.
“We do expect prices will fall marginally,” she continues. The priciest parts of the country, which saw the biggest price hikes, could see the biggest price corrections. Sales could decline anywhere from 10% to 20%, she predicts.
The luxury market is already seeing price decreases. These high-end homes, usually in the range of $1 million and up, are usually considered a bellwether for the greater housing market.
A big wild card in all of this is mortgage interest rates, which were at an ultralow 3.55% for a 30-year, fixed-rate loan as of Thursday, according to Freddie Mac data. If they continue to fall, it could give the housing market a boost. That’s because low rates translate into lower monthly mortgage payments.
Could rentals become cheaper?
Those hoping for rental prices to be slashed will probably be disappointed as well.
“We expect a little bit of an impact,” says Greg Willett, chief economist at RealPage, a property management technology and analytics company for apartment buildings. “But it’s not doom and gloom.”
He expects apartment price hikes to slow from 3% annually to more minor 1.5% or 2% price increases over the next few years. The rental market is likely to be buffered by those nervous about making what could be the largest purchase of their lives, a home, in uncertain economic times. Those folks may decide to live in a rental until the economy is booming again.
The exception, again, is the luxury rental market. Developers may have to offer concessions (e.g., a free month’s rent) or lower prices a little to attract wealthier tenants. But that isn’t likely to trickle down to the middle or even lower end of the rental market.
Will builders stop putting up badly needed new homes?
A recession could make builders even more reluctant to break ground on new residences, particularly in the priciest markets on the coasts.
A year ago, about 10% of single-family home builders offered buyers incentives such as discounts to go under contract, says National Association of Home Builders Chief Economist Robert Dietz. Today, about 40% are turning to incentives to spur home sales. That’s not a good sign.
Tariffs on building materials such as steel are already making construction more expensive. And the construction worker shortage is severely limiting the number of homes that can be built. A downturn could make this worse.
“You’ll [have] some local markets where home construction declines,” says Dietz. “Some prospective home buyers could be concerned about making that purchase.”
Will a recession spur another foreclosure crisis?
One of the hallmarks of the Great Recession were the blocks littered with foreclosed properties. Some sold quickly to intrepid young families or investors. However, those with boarded-up windows and overgrown yards blighted many a neighborhood. And losing a home was a devastating blow to many owners.
But foreclosures aren’t expected to be such a problem if a downturn occurs. Lending laws were tightened in the wake of the housing bubble bursting. So now only the most qualified borrowers can secure a mortgage.
“This time we won’t have bad mortgages, just people who are losing jobs,” says Lawrence Yun, chief economist of the National Association of Realtors®.
Plus, homeowners these days have a record amount of equity in their homes. That means homeowners who lose their job and are unable to make their monthly mortgage payments are much more likely to put their property on the market instead of going into foreclosure.
And with home prices expected to remain high, fewer folks will find themselves underwater on their mortgage. That should make it easier to unload the residences if need be.
And more people own their homes outright today than they did just over a decade ago. About 4 in 10 homeowners don’t have a mortgage on their abode compared with 3 in 10 when the last recession occurred, according to Ratiu.
“Foreclosures will definitely increase, but only because [the number of] foreclosures are [already] at rock bottom,” says Andres Carbacho-Burgos, a senior economist at Moody’s Analytics focused on housing. He expects a recession will happen at the end of this year or early next year, and last only two or three quarters.
In addition, Carbacho-Burgos expects home improvement spending to remain flat during the recession.
And home flipping, one of the factors contributing to the previous housing market bust, is expected to slow, he says. That’s because slower home price growth makes flipping less lucrative for investors.