


 Facebook
 X
X
 Pinterest
 Copy Link

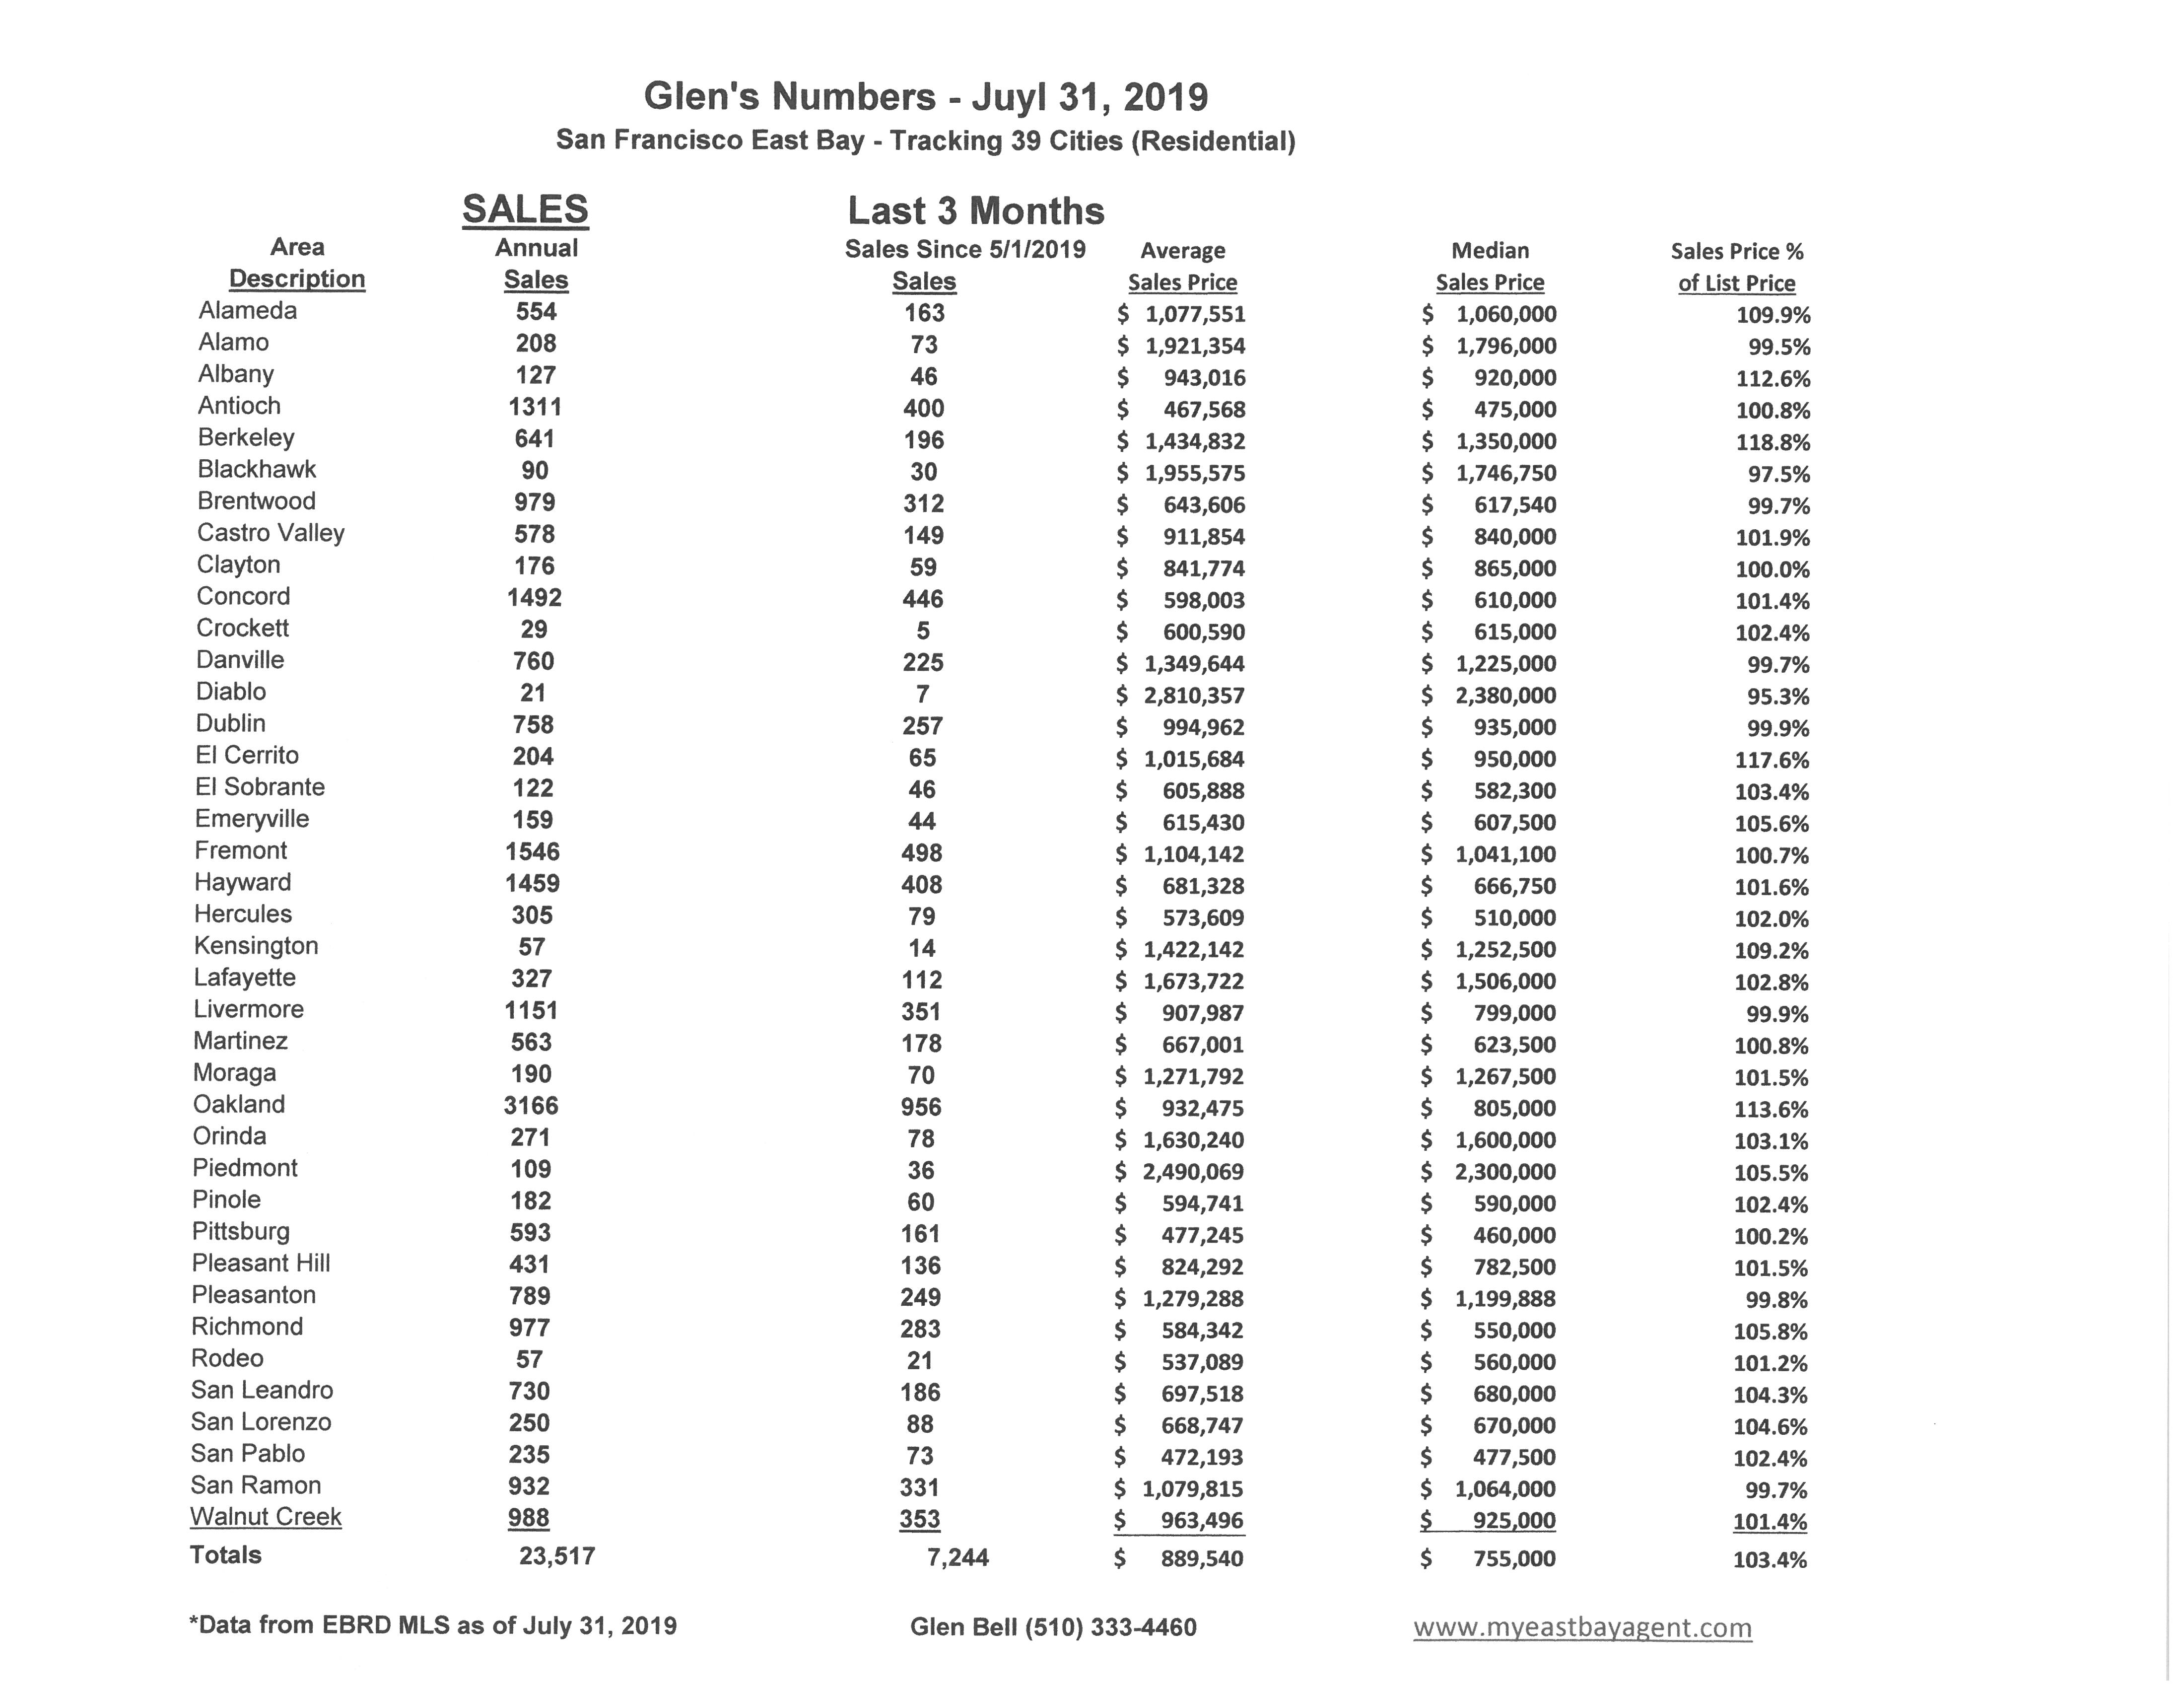
July 31, 2019 – Real Estate Market Numbers
By Glen Bell (510) 333-4460
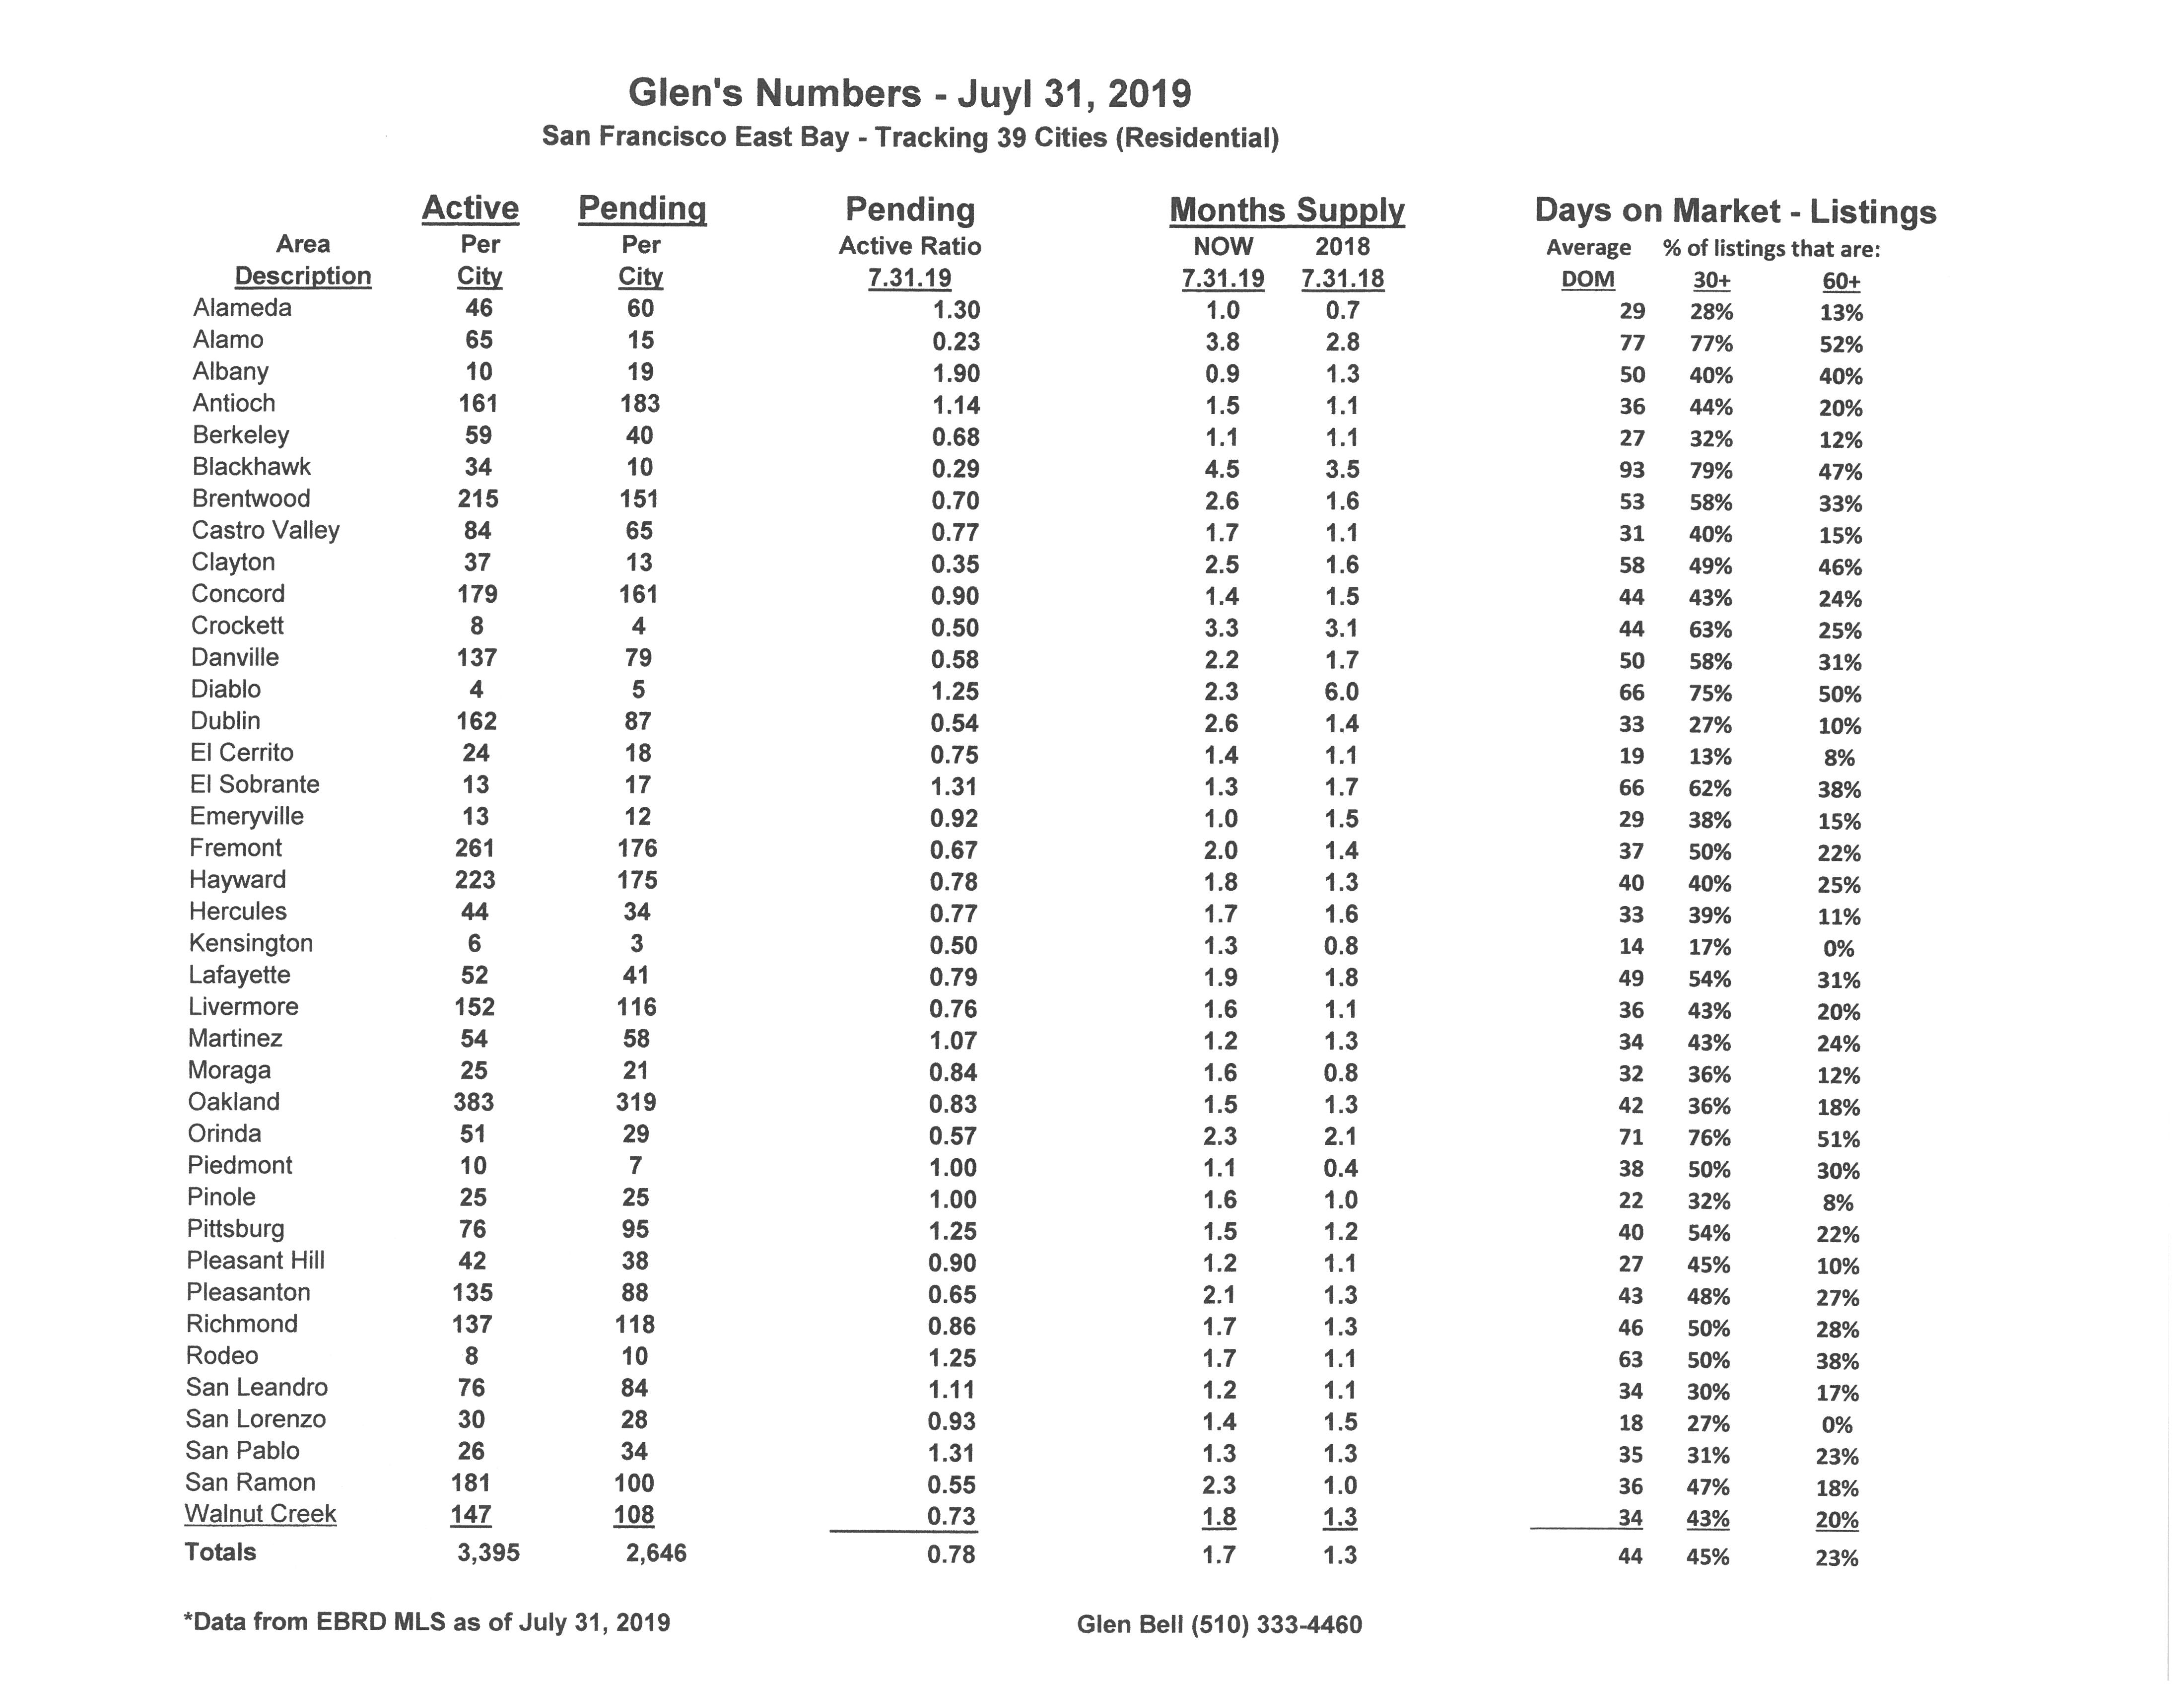
Here are some highlights for the 39 East Bay Cities that I track:
Affordability, increasing inventory, reduced sales, considerations of moving out of the Bay Area, possibility of recession, are all topics of interest in a market in transition. Properties are staying on the market longer, we’re seeing fewer offers than before, more price reductions and some incentives now being offered, in effect, all favoring buyers. Yet indecision has many buyers on the fence with a wait and see attitude despite having more choices. The gap between buyer and seller expectations has increased. A softening of the market has many sellers still holding out for top dollar, while buyers seeing a bit of leverage for the first time in years are now looking to possibly take advantage.
- Here’s where we stand as of the end of July. Typically, we see a dramatic drop in inventory during December followed by a modest steady increase in Spring and Summer. Inventory has increased by 92% since the beginning of the year, now sitting at a 51 day supply of homes for sale, (However, this is much higher in comparison to last year’s end of July of a 39 day supply). Pendings actually decreased slightly despite new inventory coming onto the market, but slightly above last year by 2.8%. The pending/active ratio decreased slightly to .78, still below our neutral mark. However, our ratio last year at the end of July was .92. This is the 13th month in a row that the ratio has fallen below 1.00. The pending/active ratio has been a benchmark that we’ve used as a measure of supply and demand to determine whether we’re in a buyer’s or a seller’s market. Typically, a number well above 1, (more inventory with fewer pendings) favors sellers. A number below 1 favors buyers. In short, we have moved from a strong seller’s market since the beginning of last summer towards a more normal and balanced market, and in many cases, now favoring buyers.
- The percentage of homes “sitting” has increased slightly to 45% of the homes listed now remaining active for 30 days or longer, while 23% have stayed on the market for 60 days or longer. Still there are many more homes that are “sitting” this year as compared to last year, (with then 35% remaining active over 30 days and 15% remaining active over 60 days).
- The “distressed” market, (foreclosures and short sales) are no longer a factor representing less than .05% of the market.
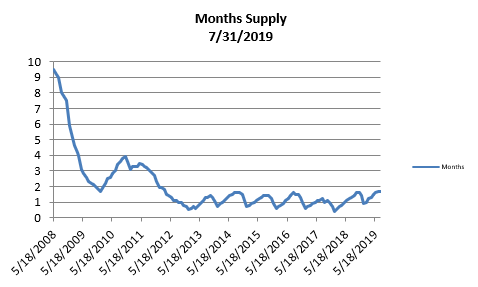
- The month’s supply for the combined 39 city area is 51 days. Historically, a 2 to 3 months’ supply is considered normal in the San Francisco East Bay Area. As you can see from the graph above, this is normally a repetitive pattern over the past four years. We are higher when compared to last year at this time, of 39 days.
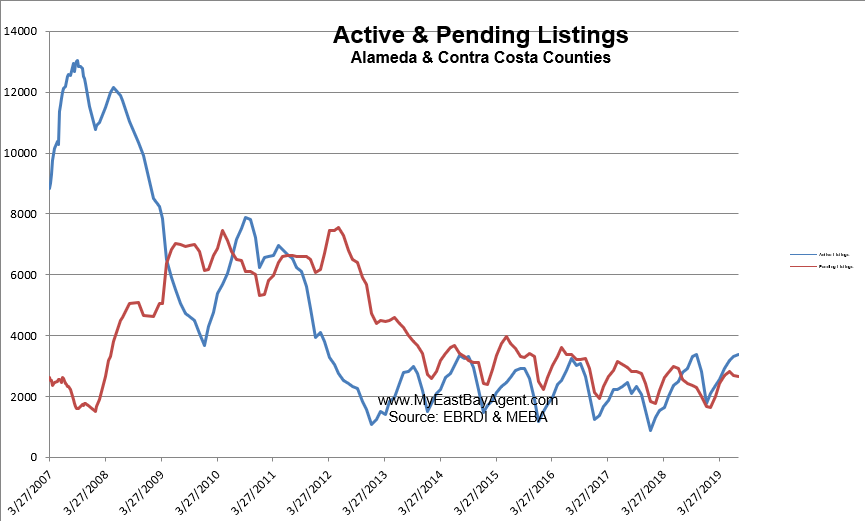
Our inventory for the East Bay (the 39 cities tracked) is now at 3,395 homes actively for sale. This is higher than last year at this time, of 2,796 or (21.4% higher). We’re used to seeing between 3,000 and 6,000 homes in a “normal” market in the San Francisco East Bay Area. Pending sales decreased to 2,646, slightly more than what we saw last year at this time of 2,573, or 2.8% lower.
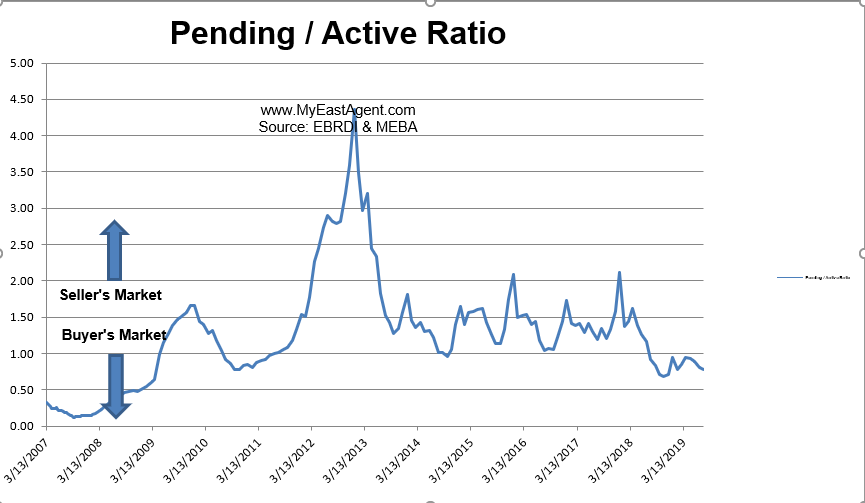
- Our Pending/Active Ratio is .78. Last year at this time it was .92
- Sales over the last 3 months, on average, are 3.4% over the asking price for this area, lower than what we saw last year at this time, of 5.6%.
Recent News
New home, apartment permits fall sharply
First drop since recession: ‘It’s the start of a worrisome trend’
By Louis Hansen, East Bay Times, August 2, 2019
Despite a pressing demand for new homes, condos and apartments, residential building permits in California fell 16% in the last year, dropping for the first time since the recession nearly a decade ago.
In the Bay Area, permits to build new homes and apartments tanked, falling nearly 50% in San Mateo County compared with the prior year, 30% in Alameda County, nearly 10% in Santa Clara County and 7% in Contra Costa County, according to a new analysis by the Public Policy Institute of California.
“At this point, it’s become a noticeable decline,” said Hans Johnson, senior fellow at PPIC in San Francisco. “It’s the start of a worrisome trend.”
The drop in building permits, a leading indicator of how many new housing units will get built, comes as the state and region battle a gaping deficit of housing. Planners estimate the state needs out 3.5 million units to adequately house its population, and Gov. Gavin Newsom set a goal of adding that many homes and apartments by 2025.
But lawmakers this year shelved several major housing proposals that would have made it easier for developers to build. The rolling Bay Area economy and pent- up demand drove housing prices on a record streak upward from 2012 to the beginning of 2019, shutting out many potential buyers. The region has added far more jobs than homes in recent years.
Steve Levy, director of the Center for Continuing Study of the California Economy, said permits had been steadily climbing since recovering in 2010 from a steep drop- off during the recession.
But despite strong demand and job growth, he said, developers are waiting longer to start projects after they’ve acquired the land and approval from city councils. Rising prices for scarce labor and materials have driven up costs and made bankers and developers more cautious about financing and starting projects.
The growing scope of U. S. tariffs on Chinese goods also has driven up expenses for building materials, he said. “Costs have to come down to unlock the permit,” Levy said.
But even before the tariffs, Bay Area construction costs were on the rise. A survey released by Turner & Townsend earlier this year found the Bay Area is the most expensive market in the world to build at $417 per square foot — higher than New York, London and Hong Kong. Commercial development costs in the Bay Area grew 5% last year, and the company expects another 6% leap this year.
The analysis by the PPIC captured U. S. census data of building permits issued by California counties between the 12-month period of July 2018 through June 2019.
Despite the many highly visible construction projects, some were granted permits more than a year ago. The downward trend also does not reflect the many major commercial projects sprouting in the Bay Area.
The state averaged about 200,000 units annually between 2003 and 2005. Last year, the number fell to 93,000, about half of which were multifamily projects.
In the Bay Area, only San Francisco County managed to buck the trend, seeing a two-thirds increase in building permits during the period.
The numbers have turned even bleaker in recent months, during the prime building season. Permits fell 38% in June from the previous year, according to the PPIC.
Johnson also pointed to growing costs as a reason for the slowdown, as well as the lack of land available for development, and a shortage of construction workers.
Some of the recent construction has been driven by rebuilding homes destroyed by fires in Sonoma and Napa counties, replacing units but not addressing the state’s backlog, he said.
Johnson added that local boards and city councils opposed to new projects have slowed new development. “We already have a deficit of houses,” he said. “Local decisions certainly play a role.”
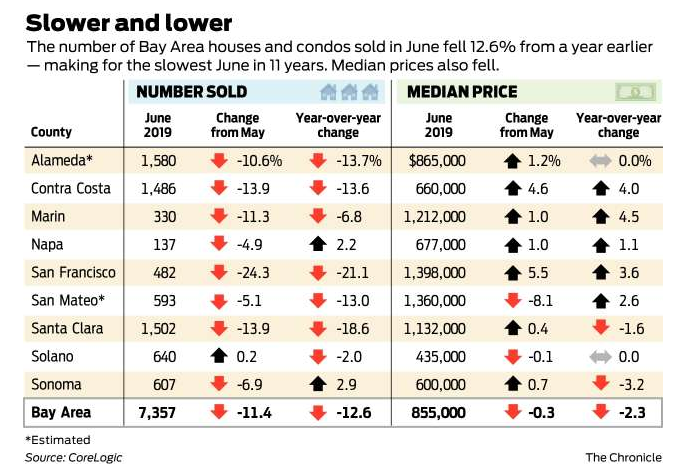
Bay Area home sales fell sharply in June — prices mostly fell, too
Kathleen Pender, San Francisco Chronicle, July 26, 2019
The Bay Area housing market showed continuing signs of sluggishness in June, with slower sales and mixed but overall lower prices.
The median price paid for all new and existing homes and condos sold in the nine counties last month was $855,000, down 0.3% from May and down 2.3% from a record high of $875,000 in June 2018, according to a report issued Friday by research firm CoreLogic.
The total number of homes sold fell sharply last month to 7,357, down 11.4% from May and down 12.6% from last June. Normally, sales rise between May and June — since 1988 they’ve gone up 3.6% on average.
June a year ago is when the Bay Area’s red-hot market began to show signs of slowing.
“Many buyers began backing out of the market last spring and summer due to a tight inventory, rising prices and increasing mortgage rates,” CoreLogic analyst Andrew LePage said in a news release. “This year, prices have flattened or dipped on a year-over-year basis in many markets, and thanks to lower interest rates many home shoppers face at least slightly lower monthly mortgage payments than they would have a year ago.
“Despite the lower cost for some, plus a healthy economic backdrop, the housing market remains sluggish with activity dropping across the home-price spectrum. This suggests many would-be buyers are still priced out or are concerned about buying near a possible price peak.”
Census data released Thursday seems to bear that out. The homeownership rate in the San Francisco metro area dropped to 51.7% in the second quarter, its lowest rate since 2012. It was 56.4% in the same quarter last year and 57% in the second quarter of 2015. This area includes San Francisco, San Mateo, Marin, Alameda and Contra Costa counties. Nationally, the homeownership was 64.1% in the second quarter, down slightly from 64.3% the same quarter last year.
Although the median home price in June for the whole Bay Area was down from last year, it was up in five counties — Contra Costa, Marin, Napa, San Francisco and San Mateo — and unchanged in Alameda and Solano. Only Santa Clara and Sonoma posted decreases.
So why was the Bay Area median price down? It’s based on sales in the nine counties together. It can be down, even when most counties are flat to up, “if there’s a significant shift in market mix, such as a higher share of homes selling in more affordable areas this year versus last,” LePage explained.
This June, for example, Contra Costa, Napa and Solano counties made up 30.8% of regional sales, versus 29.8% last year, so a larger share of sales this June were in the more affordable counties. Meanwhile, the high-cost counties of Santa Clara, San Francisco and San Mateo made up 39.5% of regional sales this June versus 41.5% last year.
Shifts toward more or less of a particular home-type category — such as new home sales, which tend to be more expensive — can also influence the regional median, he said.
In Santa Clara and Sonoma counties, June was the fifth consecutive month of lower sales compared with the same months last year.
The median price paid for a resale, detached home fell from 2018 levels for at least the third consecutive month in Alameda, Marin, Santa Clara and Sonoma counties.
“If demand wanes and inventory mounts, prices could soften more. However, lower mortgage rates might still help trigger stronger buying, putting upward pressure on prices. So far, the inventory level indicates the Bay Area has transitioned from a seller’s market to a more neutral market, but not an outright buyer’s market,” LePage wrote.
In a separate report focusing on the second quarter, Compass noted that while Bay Area home sales were about 5% lower than last year’s second quarter, sales of homes above $3 million surged, bringing them in line with last year’s historical peak.
This could be a reflection of this year’s increase in the number of initial public offerings, as well as the “general accumulation of wealth,” Compass chief economist Selma Hepp said.
Peninsula Realtor Ken DeLeon noted that foreign buyers, especially from China, are still active in the $10 million-and-up range. However, their purchases of homes in the $2 million to $4 million range “has tapered off, almost to zero,” The imposition of more stringent capital controls has made it hard for most people to get money out of China, unless you’re “uber wealthy,” DeLeon said. Most Chinese buyers purchasing high-priced homes in the Bay Area are doing it through their companies, he added.
Why the Next Recession Is Likely to Happen in 2020, and What It Will Mean for Housing
By Zillow Research on Jul. 25, 2019
- Exactly half of a panel of more than 100 real estate and economic experts said they expect the next recession to begin in 2020, with another third (35%) predicting the next recession to begin in 2021.
- Trade policy, a geopolitical crisis and/or a stock market correction were the factors identified by panelists as most likely to trigger the next recession. A housing slowdown is unlikely to cause the next recession, according to the panel, but home buying demand is expected to fall next year.
The longest uninterrupted economic expansion in U.S. history will probably end with a recession in 2020, according to a panel of more than 100 experts.[1] Trade policy, a stock market correction and a geopolitical crisis were cited as the most likely triggers for the next economic reversal.
The current expansion recently broke the previous record-long streak of 120 months, set between 1991 and 2001. If the currently hot U.S. economy does slide into a recession next year, it will be doing so amidst softening home buying demand that is expected to be lower in a year than it is now.
The Q2 2019 Zillow Home Price Expectations survey, sponsored by Zillow and conducted quarterly by Pulsenomics, asked more than 100 real estate experts, economists and strategists for their views on the timing of the next recession and the evolution of home buying demand this year and next. Among those with an opinion, exactly half (50%) said they expected the next recession to begin at some point in 2020, with another 35% saying they expected the current expansion to end in 2021.
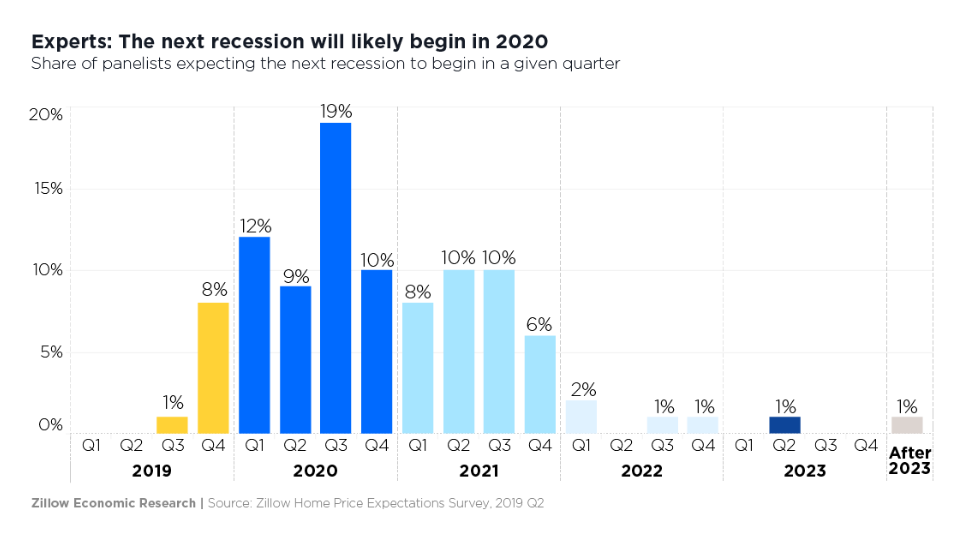
Almost one in five panelists (19%) said the next recession would begin in Q3 2020, the most popular quarterly choice, and 9% said the next recession was most likely in Q3 or Q4 of this year. Just 1% of those with an opinion said they expected the next recession would not begin until 2023, with another 1% saying it would happen after 2023.
The expected timing of the next recession was largely in line with expectations this panel expressed around the same time last year, when 48% of panelists said they expected the next recession to begin in 2020.
Housing Won’t Cause the Next Recession, But Will Be Impacted
Panelists were asked to choose and rank up to three economic and/or political factors likely to trigger the next recession, from a list of 10. Trade policy, a geopolitical crisis and a stock market correction were the most commonly chosen factors, respectively. A housing slowdown was among the factors rated as least likely to cause the next recession, chosen by just one in eight (12.6%) panelists that offered an opinion.
But while panelists largely indicated a housing slowdown was unlikely to cause the next recession, the housing market will surely be affected by more sluggish economic conditions. A small majority (51%) of those experts with an opinion said they expect home buying demand in 2020 – when they say a recession is most likely to occur – to be somewhat or significantly lower than in 2019. About a third (32%) said they expected home buying demand to be about the same in 2020 as in 2019.
More immediately, almost three quarters of respondents (73%) said they expected home buying demand this year to be about the same or lower than last year. Home sales have been sluggish to start 2019 compared to the beginning of 2018, despite conditions that are more favorable for buyers now than they have been in quite some time.
Weakening Demand, Slowing Home Value Growth
Put together, signs of already fading demand and the possibility of an impending recession are also very likely to contribute to further slowdowns in overall U.S. home value appreciation going forward. Currently (April 2019), U.S. median home values are growing at a 6.1 percent annual pace – strong by historic standards, but well below annual appreciation rates of 8.1 percent recorded as recently as December. Annual home value growth has slowed in each of the past four months compared to the month prior, and panelists said they expect this slowdown to continue.
Panelists were asked for their opinions on the pace of home value growth over the next five years. On average, panelists said they expect annual growth at the end of 2019 to be 4.1 percent, slowing further to 2.8 percent in 2020 and 2.5 percent in 2021 before picking up somewhat in 2022 and 2023 (to 3 percent and 3.4 percent, respectively).
Mortgage Rates Are Already Lower. They’re Not Helping Much
By Matt Phillips, New York Times, Aug. 1, 2019
Cheaper mortgages are usually a boon to the housing market. But this year, a sharp drop in mortgage rates hasn’t provided much of a lift, and that could bode poorly for the Federal Reserve’s efforts to shore up economic growth.
To see why, take a look at what has happened in housing since mortgage rates began a sharp decline late last year.
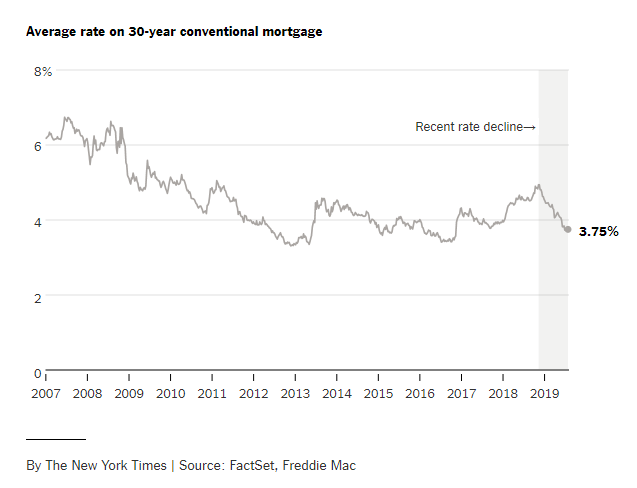
Consumer borrowing costs, including mortgage rates, are heavily influenced by the market for government bonds, and yields on those bonds have been falling this year. Similarly, the rate on the 30-year fixed mortgage rate is down more than one percentage point, to 3.75 percent last week, according to Freddie Mac.
Over the last 30 years, the rate has averaged about 6.25 percent. So the current rates might reasonably have been expected to spark a flurry of refinancing and home buying.
But, because of rising home prices, there has been no boom so far. Through June, sales of existing homes were down 2 percent from a year earlier, and investment in residential structures had declined for six straight quarters. Sales of newly built homes remain well below their recent peak in late 2017. And while home prices are still rising nationwide, the gains have slowed sharply in recent months.
The lackluster response to lower mortgage rates highlights a broader challenge facing the Fed as it tries to nudge the American economy along by cutting interest rates.
Lower rates usually encourage borrowing by consumers and corporations, lift stock and bond markets, and reinforce consumer and corporate confidence. All of which gives a bit of gas to the American economic engine.
But 10 years into an economic recovery, American interest ratesare already low by historical standards. Prices for stocks and bonds are already high. And corporations are having little trouble finding places to borrow money. Such loose financial conditions mean it might take a sustained program of rate cuts — rather than a couple of reductions, as many analysts expect — for the Fed to have a true impact on the economy.
“Financial conditions are just easy all around,” said Priya Misra, head of global rates strategy at TD Securities in New York. “So it’s not clear what a cut can do.”
The housing market has traditionally been one of the most important channels by which the Fed’s rates can influence the economy because it can spur construction employment, sales of appliances and furniture, and services such as landscaping, all of which multiply the economic impact of a home’s purchase.
But the math facing prospective American home buyers is daunting. Since June 2009, when the United States economy started its current expansion, the median price of existing homes has risen nearly 60 percent, far outpacing the 24 percent gain in median weekly earnings.
The divergence means the national housing market — while incredibly varied on a local level — has become increasingly unaffordable. And it will take more to trigger a significant wave of home buying than clipping a percentage point off mortgage rates.
“At this point, they don’t matter as much as people think,” said John Sim, an analyst who covers housing and the mortgage market for JPMorgan Chase. “Even at this current level of rates, it’s pretty unaffordable to most renters.”
The housing bust a decade ago is partly to blame. Since 2008, homebuilders have largely cut back on building more modest starter homes, which would be attractive to first-time buyers but are less profitable for the builders. Historically, banks might have filled the gap by loosening lending standards so people could pay higher prices. But financial firms have, for the most part, stuck to stricter guidelines they put in place at the urging of regulators in the wake of the crisis.
The result has been a sharp downturn in homeownership, to 64 percent from an elevated level of 69 percent during the subprime-lending-fueled frenzy in the middle of the last decade.
“In general what we’ve had is just not enough lower-priced homes and sort of a vicious cycle, where that limited supply has continued pushing prices up,” said Jody Shenn, an analyst at credit rating firm Moody’s who covers the housing and mortgage industry.
It’s not that the decline in interest rates doesn’t matter at all. The drop since late 2018 to 3.75 percent has knocked about $160 off a monthly mortgage payment on a $286,000 home — the median price of existing single-family homes in June, according to the National Association of Realtors — after a 20 percent down payment.
Applications to buy homes and refinance mortgages, which were slumping late last year, have recovered somewhat since mortgage rates began declining. It’s possible the drop in mortgage rates might simply need more time to influence the housing market.
But the market response so far seems muted compared with past instances of falling rates.
After a recession hit in 2001, for example, a series of rate cuts brought the Fed’s target for the its funds rate down to 1 percent from 6.5 percent. Mortgage rates followed, dropping from 8.5 percent to around 5 percent by mid-2003.
The low rates set off home building, consumer spending and financial activity that helped drive economic growth up to a nearly 7 percent annual pace in late 2003. The American economy hasn’t matched that level since.
If the reaction of the housing market to lower rates remains lackluster, it suggests the Fed’s may be less effective at fighting the next economic slowdown.
“The old view of the world, where housing is one of the key transmission mechanisms, is much less important than it used to be,” said Frederic Mishkin, a Columbia University finance professor and former Fed official.
California housing market officially now ‘weak.’ Is it an early warning of recession?
BY TONY BIZJAK, Sacramento Bee, JULY 22, 2019
The once red-hot California housing sales market is officially now “weak,” state analysts say, but the year-long flattening does not necessarily suggest the state is headed toward an economic downturn.
In a brief report issued Monday, the state Legislative Analyst’s Office weighed in on the latest California home sales trends, noting that homes sales statewide in June were down from the same month last year, and notably lower than historic norms.
“Home sales were on a clear downward trend during the second half of 2018 and the beginning of 2019,” analysts wrote. “Sales seem to have stabilized in recent months and are no longer declining from month to month.
“Nonetheless, sales remain relatively weak, but not as weak as is typically seen before economic downturns.”
The state analysis, based on data from Zillow, the California Association of Realtors and Moody’s Analytics, estimated 25,900 non-distressed home sales statewide in May. That is below the 28,000 sales number from June of 2018, and below the “long-term historical average of 31,400 sales per month.”
Similarly, sales numbers are low in recent months in Sacramento, and sales prices have flattened as well.
Housing prices statewide had been on a dramatic price run-up for seven years, after the recession years from 2007 to 2011, at first prompting increasing in sales as consumers sought homes before prices could go higher. Affordability levels dropped to their lowest levels in years in 2018, and by mid-year some potential buyers had backed out of the market, starting the latest cooling trend.
$50 billion worth of Bay Area homes at risk of rising seas by 2050, says report
Billions in beachfront property may be flooded
By KAREN D’SOUZA, Bay Area News Group, July 31, 2019
Tens of thousands of Bay Area homes worth about $50 billion are at grave risk of chronic coastal flooding by 2050, according to a new analysis by Zillow and Climate Central.
By 2100, the crisis deepens. As the ice caps continue to melt in the wake of global warming, experts project that 81,152 Bay Area homes with a current value of more than $96 billion, may be swamped. If greenhouse gas emissions go unchecked and seas continue to rise as expected, a wide swath of Bay Area real estate will be endangered. Coveted beach houses may well turn into disasters.
“This research suggests that the impact of climate change on the lives and pocketbooks of homeowners is closer than you think. For home buyers over the next few years, the impact of climate change will be felt within the span of their 30-year mortgage,” said Skylar Olsen, Zillow’s director of economic research and outreach, in the report. “Without intervention, hundreds of thousands of coastal homes will experience regular flooding and the damage will cost billions. Given that a home is most people’s largest and longest-living asset, it takes only one major flood to wipe out a chunk of that long-growing equity. Rebuilding is expensive, so it’s doubly tragic that we continue to build brand new units in areas likely to flood.”
There are 5,360 San Francisco homes worth more than $8.8 billion at risk by 2100, according to the report. Alameda County has 21,573 homes at risk, valued at $18.4 billion, Marin County has nearly 10,000 more homes, valued at about $14 billion, in the risk zone and Contra Costa has 6,548, valued at about $4 billion.
“The beautiful coastal setting of the Bay Area is a blessing and a curse for the housing market there: residents value the temperate climate and recreation opportunities by the shore, but the steady upward march of sea levels will threaten tens of thousands of coastal homes, worth billions of dollars, with flooding in the coming years,” says Zillow economist Jeff Tucker. “On the bright side, California’s environmental protections limiting coastal development have largely stopped them from making the problem worse, unlike several East Coast states where homes are multiplying faster in flood-prone areas than inland.”
In San Jose, there are 1,308 homes worth nearly $1.2 billion at risk by 2100, the report notes. Experts warn that’s not nearly as long as it sounds. It’s only about a mortgage away. Santa Clara County has 2,617 homes in danger by 2100.
California is on the list of states most likely to be devastated by sea-level rise and 10-year floods, according to this analysis, with 143,217 homes threatened. Florida tops the ranking with about 1.58 million homes impacted by 2100. Also, on the endangered list are 282,354 homes in New Jersey, 167,090 in Virginia and 157,050 in Louisiana.
The findings are viewable on this interactive map which displays the flood-risk zones and details the number and value of homes at risk by location across the country.


