Facebook
 X
X
 Pinterest
 Copy Link

December 31, 2018 – Real Estate Market Numbers
By Glen Bell (510) 333-4460
Here are some highlights for the 38 East Bay Cities that I track:
Affordability, rising interest rates, increasing inventory, reduced sales, considerations of moving out of the Bay Area, are all topics of interest in a market in transition. Properties are staying on the market longer, we’re seeing fewer offers than before, more price reductions and some incentives now being offered, in effect, all favoring buyers. Yet indecision has many buyers on the fence with a wait and see attitude despite having more choices.
- Here’s where we stand as of the end of December. Typically, we see a dramatic drop in inventory during this time of year. This December was no exception. Inventory was reduced by 37.3%, now to a 27 day supply of homes for sale, (compared to last month’s 42 day supply for November). However, that’s still more than what we saw happen last year at this time, where we were sitting on only 14 day supply. Pendings came down as well but at a slower rate, at 26.7% lower. This created an uptick in the pending/active ratio to .94, an improvement, but still below our neutral mark. That uptick is normal as well for this time of year. However, our ratio last year at the end of December was a whopping 2.11, well into “seller” market territory. This is the sixth month in a row that the ratio falls under 1.00. The pending/active ratio has been a benchmark that we’ve used as a measure of supply and demand to determine whether we’re in a buyer’s or a seller’s market. Typically, a number well above 1, (more inventory with fewer pendings) favors sellers as has been the case now for quite some time. A number below 1 favors buyers. In short, we have moved from a strong seller’s market since the beginning of summer towards a more normal and balanced market, and in many cases, now favoring buyers.
- The percentage of homes “sitting” has increased to 74% of the homes listed now remaining active for 30 days or longer, while 47% have stayed on the market for 60 days or longer. This is higher than last year at this time with 63% of the homes listed remaining active for 30 days or longer, while 37% stayed on the market for 60 days or longer. There’s a seasonal reasoning for having so many homes sit during the month of December. Agents will advise their clients to wait on listing their home until spring and avoid the lack of interest that we usually see with buyers during the busy holidays. So very little “new” inventory comes on to the market and those “stale” homes that were not moving before remain as the bulk of our inventory. This will begin to change as many new listings come up in January and February.
- It’s hard to predict how much tax reform will play into this but see the article, “Is California facing a tax exodus? Thanks to Trump’s tax law, more may start to flee.” We are seeing interest rates starting to go up. Prices have continued to rise and are only now beginning to flatten out. More and more, affordability, the high cost of living and our traffic woes are coming into play for those, especially in the “middle class,” who may now be considering leaving the Bay Area.
- The “distressed” market, (foreclosures and short sales) are no longer a factor representing less than .05% of the market.

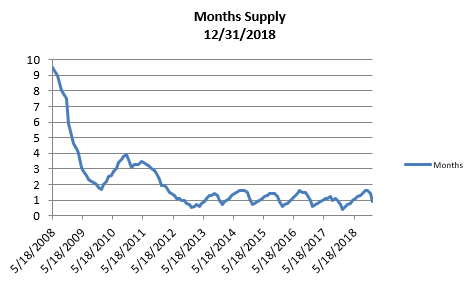
- The month’s supply for the combined 39 city area is 27 days. Historically, a 2 to 3 months’ supply is considered normal in the San Francisco East Bay Area. As you can see from the graph above, this is normally a repetitive pattern over the past four years. We are higher when compared to last year at this time, of 12 days.
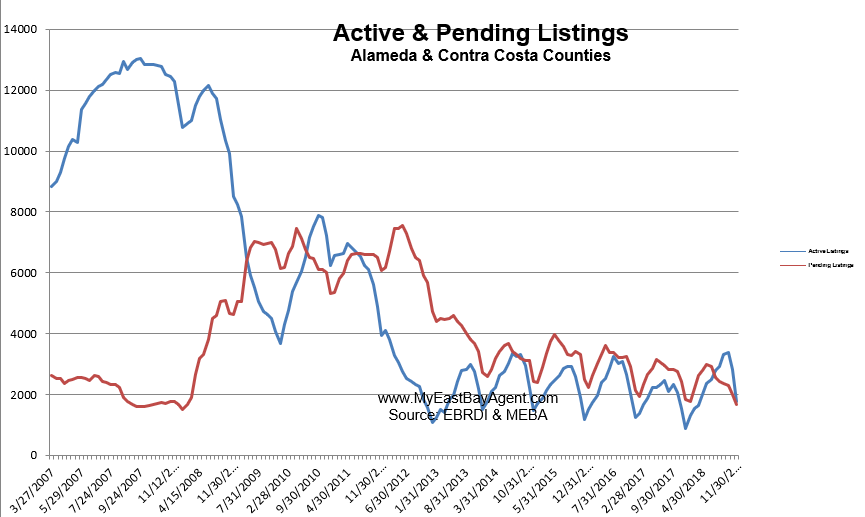
- Our inventory for the East Bay (the 39 cities tracked) is now at 1,765 homes actively for sale. This is higher than last year, at this time, of 868 or (103% higher). We’re used to seeing between 3,000 and 6,000 homes in a “normal” market in the San Francisco East Bay Area. Pending sales decreased to 1,662, less than what we saw last year at this time of 1,830, or 9.2% lower.
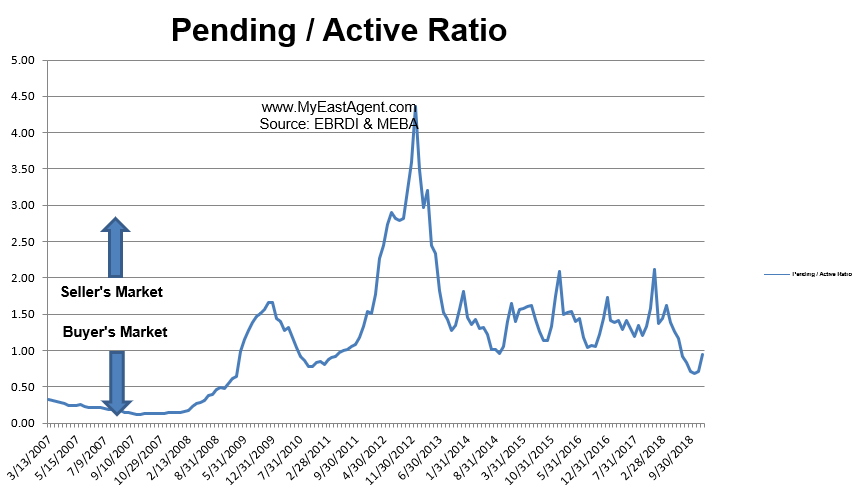
- Our Pending/Active Ratio is .94, the lowest December since 2010. Last year at this time it was 2.11.
- Sales over the last 3 months, on average, are 2.2% over the asking price for this area, lower to what we saw last year at this time, 3.8%.
Recent News
Redfin’s 2019 Predictions: Housing market will be coolest we’ve seen in years, but homeownership will continue to rise
By Daryl Fairweatheron, Redfin, December 19, 2018
We predict that the housing market will continue to cool into the first half of 2019. Inventory will rise back up to 2017 levels, and price growth, while likely still positive, will be the lowest we’ve seen since 2014 or possibly even 2011. Investors and house-flippers will back away from the cooling market, and real estate companies that buy homes from consumers to quickly sell at a profit (including our own RedfinNow) will face their first serious test. Tech companies and local governments will continue to go head to head on local housing issues.
Prediction #1: The housing market will continue to cool
Over the first half of 2019, home-price growth will stay slow. Our forecasts have price growth settling around 3 percent, which would be the slowest price growth we’ve seen in years. As recently as the first half of this year, prices were still growing 7 percent, and price growth has reliably exceeded 5% since the start of 2015. There’s quite a bit of uncertainty around our price forecast; there’s a real chance prices could fall below 2018 levels, putting up negative growth for the first time since 2011.
Sellers will have to adjust their price expectations as buyers grapple with rising mortgage rates and already-high home prices. Metros that saw the most price growth in the first half of 2018 will experience the biggest slowdowns in price growth in the first half of 2019. Seattle, San Francisco, San Jose, Portland, San Diego, Los Angeles, Denver, and Honolulu are a few of the metros where we expect demand to cool the most. “A few weeks ago I helped my home-buying customers get a bid accepted that would have gone straight to the bottom of a pile of offers earlier this year,” said San Francisco Redfin agent Anna Coles. “The offer for a house in desirable Parkside was below list price and included a financing contingency, which allows the buyers to back out of the contract without forfeiting their earnest money deposit on the off-chance their loan doesn’t get approved. The norm for the past two-plus years had been that buyers had to waive standard protections like this in order for a seller to consider their offer, but this is just one sign that buyers may face less competition heading into 2019.”
On the flip side, we expect home prices to continue to grow at a strong pace in a handful of small, affordable, inland markets like Buffalo, Rochester and Greensboro, where the market is still heating up.
We’re going into 2019 with a 5 percent greater supply of homes for sale than we had going into 2018, which is the highest growth we’ve seen since September 2015, but home sales were down 8 percent since last year in November. A still-growing economy and increased access to credit will support more home buyer demand, but higher interest rates will make home-buying more expensive, so it’s hard to say whether home sales will stay down or rebound next year.
Prediction #2: Homeownership rates will continue to rise
Whether total home sales go up or down, more homes will be sold to people who plan to live in the home as opposed to investors, which will cause the homeownership rate to rise. In 2019, homebuyers will enjoy more inventory and less competition from speculators and house-flippers, which will lead to more people enjoying the benefits of homeownership. Homeownership has been consistently growing from its post-recession valley of 63 percent in 2016 to above 64 percent this year. We predict the homeownership rate will grow more rapidly in 2019.
Prediction #3: It will cost more to borrow, but more people will have access to credit for home-buying
Homebuyers have already seen mortgage interest rates increase in 2018, and the Fed’s most recent comments indicate that it will continue to raise rates perhaps twice or more in 2019, which will push the average 30-year fixed mortgage rate up to about 5.5 percent by the end of the new year. This increase from the sub-5 percent level where rates have been hovering in recent months would mean about a $100 increase in monthly mortgage payments on a $300,000 home by the end of 2019.
Lenders will also feel the effects of rising rates, which will increase their costs of lending and dampen demand for their services. This will motivate lenders to expand their customer base to low-income borrowers and first-time homebuyers. But of course, lenders will charge more for these loans–both to cover the risk of lending to borrowers with less-than-perfect credit and to cover their own costs of borrowing.
Prediction #4: A cooling housing market will dampen economic growth only slightly
In 2018, economic growth was the strongest it has been since early 2015. However, residential investment, which includes money spent on construction, renovations, and real estate commissions, and typically makes up about 15 to 18 percent of economic activity, declined slightly in 2018. In 2019, the economy will most likely grow, but a cooler housing market will contribute less to the overall economy. Even if residential investment were to fall by 10 percent, which has only happened three times in the last 40 years, total economic activity would be impacted by 1 to 2 percent. That isn’t enough to cause a recession as long as the rest of the economy keeps growing.
There could be some spillovers from the cooldown in the housing market to consumer spending. When homeowners see homes sitting on the market longer and sellers dropping their prices, they feel less wealthy. Rising interest rates will also impact more than just home sales. It will be more expensive to finance a car loan, take on credit card debt, or refinance a mortgage to take out equity, which will also weaken consumer spending.
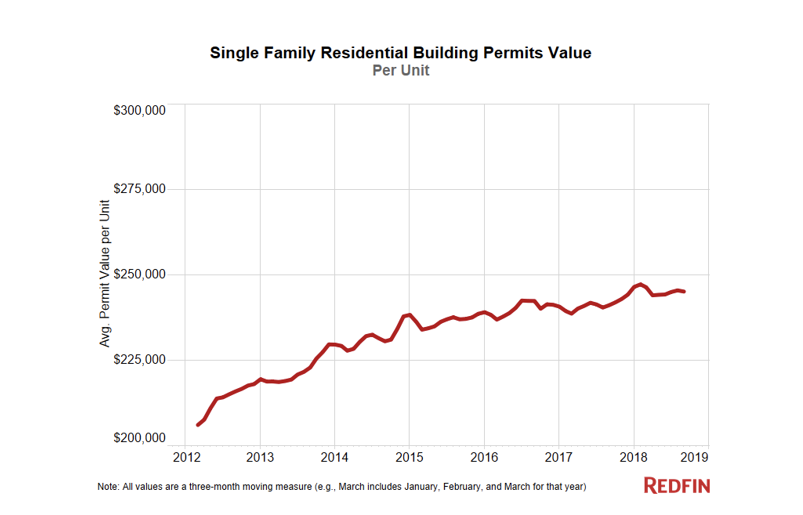
Prediction #5: Fewer homes will be built, but more builders will focus on starter homes
In 2019, homebuilders will be more cautious about building during a cooling market and focus on building starter homes that are easier to sell than luxury homes. We have already seen the per-unit value of single-family residential building permits flatten, and we predict per-unit values of building permits will decline in 2019. Another factor in 2019 will be low unemployment, which will finally cause wages to rise for low-income workers. This will impact both the supply of and demand for housing. On the supply side, higher labor costs will limit the number of homes built. Meanwhile, higher wages will be a boon to demand for starter-homes among working-class Americans.
“When we decided to plan our first new construction development, we found a niche in the $300,000 price range in Dallas, where there is a great deal of activity among national and local builders, but almost all of it focused on the high end,” said Pushban Rajaiyan, the lead developer on Brentwood Court by Havendale Homes, a townhome community now available for pre-sale. “It was important to us to offer homes built with high quality materials but for an affordable price and in an area where residents can enjoy nearby amenities and short commutes. Just in the past few months we’ve already begun to see other builders catch on to this unmet need in the market, with other affordable, starter-home options coming available to local buyers soon.”
Prediction #6: Institutional buying faces its first serious test
If home-buying demand falters due to higher interest rates and stock-market volatility, the trend toward instant offers from institutional homebuyers could face its first serious test, a test of pricing algorithms as much as companies’ appetite for risk. Armed with billions in capital, competitors from Opendoor to RedfinNow to Zillow to Offerpad to Knock have been vying with one another to buy homes from consumers and then sell those properties at a profit, with i-buyers’ combined share of U.S. home sales growing rapidly. The question investors are asking is whether instant offers will now be significantly lower, to compensate institutional buyers for the market’s recent uncertainty, and whether homeowners will accept the offers, just to avoid those same uncertainties themselves. Institutional buyers who made money from nearly every sale in a rising market with low interest rates could start to face losses, or may demonstrate more discipline than other housing investors. In 2019, we’ll find out. If i-buying works in a bear market as well as it has in a bull market, instant offers could become a major, permanent sector within the real estate economy. If it doesn’t, a lot of money is going to sink into the sand.
Prediction #7: Tech and local government will go head-to-head on housing
Cities have been struggling with the double-edged sword of tech-company-driven prosperity and inequality. Tech companies bring highly skilled workers to cities and pay them handsomely. This is why 238 cities vied for Amazon’s HQ2. But, shortly after the HQ2s were announced, residents of Long Island City began protesting, advocating for more housing investment to avoid displacing existing residents. Crystal City has planned ahead with 4,000 new housing units, but Amazon plans to hire 25,000 people there. Growing cities will have to start building more housing now if they don’t want to face the affordability and homelessness problems that established tech hubs like Seattle and San Francisco are currently facing.
2019 Predictions: Worse Affordability, Commutes, Natural Disaster Losses
By Aaron Terrazas, Zillow, Nov. 28, 2018
Rising mortgage rates will set the scene for the housing market in 2019. They will affect everyone, driving up costs for home buyers and creating more demand for rentals. Even current homeowners could start to feel locked into their mortgage rates.
Here’s a snapshot of what’s in our crystal ball:
Mortgage affordability takes a hit
Despite steady climbing for the past two years, mortgage rates remain lower than they were during most of the recession and below average for the type of strong economic growth we’ve been experiencing. That will change in 2019, as the 30-year, fixed rate mortgage reaches 5.8 percent – territory not seen since the dark days of 2008, when rates were racing downward in response to the housing crisis. In 2019, rising rates will compound the effect of still-climbing home values, making homeownership even less affordable. Already, rising mortgage payments eclipse home-value gains, a phenomenon that can both encourage homeowners to stay put – to hold onto low mortgage rates that are disappearing in the rear-view mirror – and discourage would-be first-time home buyers.
Rents reverse course
Although rising mortgage rates will affect home buyers first, renters will not be far behind. As higher rates limit the number of homes that potential buyers can afford, some would-be buyers will be too financially stretched to buy and will continue renting. As a result, recent (and very slight) drops in rent will reverse and turn positive again. The shift will be muted, however, by continued steady investment in apartment construction, which will prevent rent growth from shooting too far above income growth. In the third quarter 2018, the U.S. median rent cost 28.2 percent of the U.S. median income – considerably higher than the 25.8 percent renters paid historically.
Commutes get worse
Job creation has been concentrated in urban cores, and so has the affordability crisis – a phenomenon that’s increasingly pushed people to nest and grow their families in the suburbs. The disconnect between urban jobs and suburban residents will continue in 2019 and contribute to longer, more crowded commutes. This may be especially daunting for people in markets where living within their means already requires lengthy travel times: A home in central Boston, for example, is valued 303 percent more per square foot than a typical outlying home, while the premium for homes in central Washington, D.C., compared to outlying areas is 218 percent per square foot. Politicians in Washington, D.C. and state capitals around the country are talking up new infrastructure investments, but some may be too little too late given rising construction costs and planning delays.
Amazon HQ2 ‘losers’ see a boost
Spurred by the possibility of attracting tens of thousands of jobs from online retail giant Amazon, some areas that lost their headquarters bids to suburban New York and Washington, D.C., nevertheless got in touch with their inner can-do – and that will pay off.
Shortly before Amazon made its big announcement, Chicago debuted its “P33” initiative, aimed at becoming a tech hot spot by the city’s bicentennial in 2033. It’s been dubbed the “Burnham plan for Chicago’s tech future,” a reference to Daniel Burnham, whose 1900 attempt to create “Paris on the Prairie” both beautified the city and made it a force in urban planning.
Former Amazon HQ2 contender Atlanta already has seen some action since it was passed over by the Prime vendor: Convoy, a much smaller Seattle-based company, is opening its East Coast office there. Norfolk Southern may relocate its headquartersthere from the city for which it is named, Norfolk, Va.
While New York and D.C. weigh what Amazon’s arrival means for them, could even Tucson could find a taker for its 21-foot saguaro cactus?
Natural disasters claim a record number of homes
This prediction for 2019 is a logical extension of what’s already been happening: About 15,000 homes were destroyed by wildfires in California alone in 2018 – including at least one entire town in what used to be the “off” season – and many others by storms along the gulf coast.
As the frequency and magnitude of natural disasters continues to escalate, builders and developers will focus on preventative and/or protected building materials and designs. While in the past, builders have returned quickly in the aftermath of natural disasters – typically building nicer and more expensive homes than before – that may not be the case going forward. Building costs are on the rise, and insurers are increasingly reluctant to offer policies in danger zones (or are charging higher premiums to do so) – both of which could translate into slower and costlier rebuilding.
Flood losses are growing as well, and projections for homes inundated by rising sea levels and storm surges over the course of a typical 30-year mortgage begun in 2020 are not encouraging.
Home value growth slows
One mitigating effect to rising mortgage rates will be slower home value growth. In October, home values were up 7.7 percent from a year earlier, to a U.S. median of $221,500. Zillow forecasts growth of 6.4 percent from October 2018 to October 2019; a Zillow survey of housing experts and economists anticipates a 3.79 percent increase for calendar 2019. Both forecasts indicate cooling from red-hot growth of 8 percent in March of this year.
C.A.R. 2018 State of the Housing Market,
Study of Housing: Insight, Forecast, Trends
The tight supply issue that has been lingering on for years has finally turned into a demand issue. With the economy growing at a solid pace and new households continuing to form at the fastest pace in the last 10 years, home sales in 2018 were projected to increase from the prior year, despite an anticipation of interest rate hikes. The Tax Reform and Jobs Act passed at the end of last year was expected to have a negative impact on the supply and the demand of housing, but overall sales were still forecast to inch up from 2017. Up until April, the market performed in line with our prediction for the most part, and California was on track to have another year of gain in both sales and price.
Then something happened in May. Housing demand began to shrink as buyers became more cautious with their buying decision. Sales dropped on a year-over-year basis for four consecutive months and at a pace that warrants many to be concerned. Home prices continued to increase but at a decelerated pace. Housing supply, which had been declining consecutively for almost three years, bounced back, registering double-digit growth. All signs seem to suggest that the market is losing momentum, and that California is experiencing a sustainable slowdown.
A softening of the market is undeniably underway. The questions are how big of an impact the transition is going to have on the market and how long will it last. This report uses monthly transactional data and results from the Annual Housing Market Survey collected by the California Association of REALTORS® (C.A.R.) to get a better understanding of the current market conditions and to shed some light on how the ongoing transition might have affected home buying and home selling behavior.
KEY HIGHLIGHTS
- Home sales in California have hit some rough patches in recent months, and the latest fallout could be a sign of a sustained market shift. As of August, the market was down 2.1 percent compared to sales in the first eight months of 2018.
- Several factors contributed to the softening of the market: interest rate volatility, sales being pulled forward in anticipation of higher rates in the future, and the continuous constraints on housing supply. The erosion of affordability, however, is really what’s driving the market.
- With housing affordability expected to deteriorate further, the lackluster performance in home sales will continue into 2019. While the economy will remain solid, the increase in housing demand will go unmet, as the erosion of affordability continues to leave potential buyers either unwilling or unable to buy.
- Home prices in California reached a new high. The statewide median price surpassed its prior peak set in May 2007 for the first time in May 2018 only to exceed it a month later with a new record high of $602,760. Despite setting a new high, the strong growth trend in prices may have already peaked. With inventory growing, the appreciation in home prices is softening and should continue to decelerate in the upcoming year.
- Results from the latest annual housing market survey indicate that housing affordability was the primary reason for 28 percent of homebuyers to move out of the county where they previously resided, an increase from 21 percent in 2017. The outmigration trend was worse in both the Bay Area and the Southern California region, with 35 percent of homebuyers moving out of the county in which they previously lived because of the housing affordability issue. Housing affordability was an even bigger problem for first-time buyers, as nearly half of them cited the issue as the main reason for their outmigration move.
- Despite tough market conditions, more first-time buyers continued to enter the housing market, and pushed the share of first-time buyers to 34.8 percent, which is the highest level since 2012. A stronger economy, more robust household growth, and an urge to get into the market before interest rates climbed further were some of the primary factors that contributed to a higher share of first-time buyers
- The first-time buyer market was more competitive when compared to the repeat buyer market, with 62 percent of all first-time buyer transactions receiving multiple offers, 40 percent having a sold price above the asking price, and properties typically staying on the market for 12 days.
- With fewer bargain properties being available on the market, investors’ interest in the residential market dropped in the first half of 2018. In fact, the share of sales to investors declined to the lowest level since 2009. The declining trend of investor buyers will likely remain on course in the upcoming year as rent growth flattens and the uncertainty in rent control policy continues to mount.
- Market competitiveness varied between price segments. Properties in the upper mid-priced range — homes sold with a price between $750,000 and $1M — were the most sought after, as they were the most likely to receive multiple offers, the most likely to receive an offer with a price above the asking price, and sold the fastest.
- While tight supply in the housing market costs more on the buyers’ side, sellers have been benefiting from the strong price appreciation resulting from the supply constraint. The median net cash gain to a typical seller resulting from a home sale in California remained unchanged from 2017 at $200,000, the highest level since 2006.
- Sellers have not been moving as often as in previous years, with a typical seller owning his/her home for 11.5 years before selling, the highest level in at least the last 38 years. The trend was especially obvious for older generations, as baby boomers typically owned their property for 15 years before selling, while the Silent Generation held on to their properties for 30 years before selling.
- The share of sellers who expressed interest in buying another property has been steady in the last four years and remained near the highest level since 2006. Millennials and Gen X sellers were the most interested in buying again, as nearly two-thirds of both generations said they planned to buy after selling their previous property.
- Nearly three of ten sellers who planned to purchase a new home decided to buy in a state outside of California, an increase from 28 percent in 2017. Declining housing affordability in recent years is one of the factors that resulted in the surge in sellers wanting to move to another state.
- Current conditions for the housing market and for real estate financing are healthier than the environment that we observed in the mid2000s before the housing market started deteriorating. In general, more buyers in Q2 2018 were putting a bigger down payment on their home purchase, and there were fewer buyers with zero down payment. The share of buyers who used a second lien to finance their property also shrank significantly from the peak of the current housing cycle.
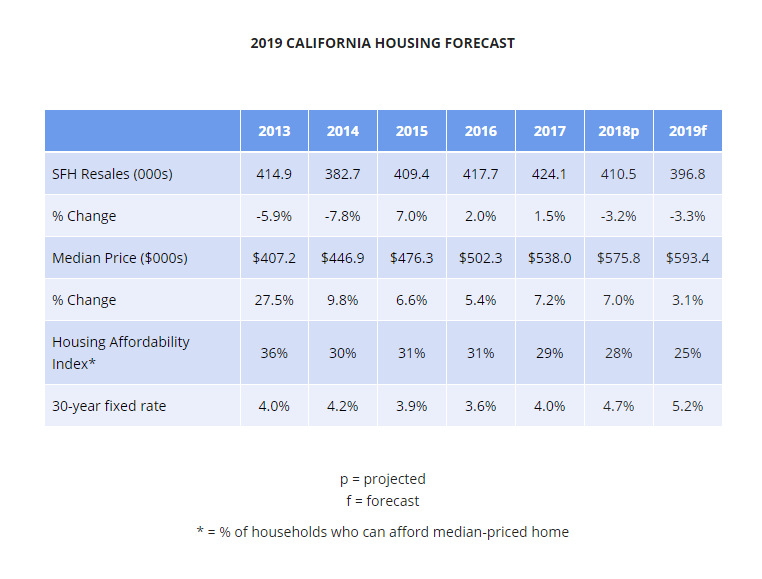
- A.R. projects that existing home sales in California will decline 3.2 percent in 2018 and drop 3.3 percent in 2019. Home prices will continue to rise this year, growing by a projected 7.0 percent in 2018, and a more moderate 3.2 percent in 2019.