


 Facebook
 X
X
 Pinterest
 Copy Link

June 30, 2019 – Real Estate Market Numbers
By Glen Bell (510) 333-4460
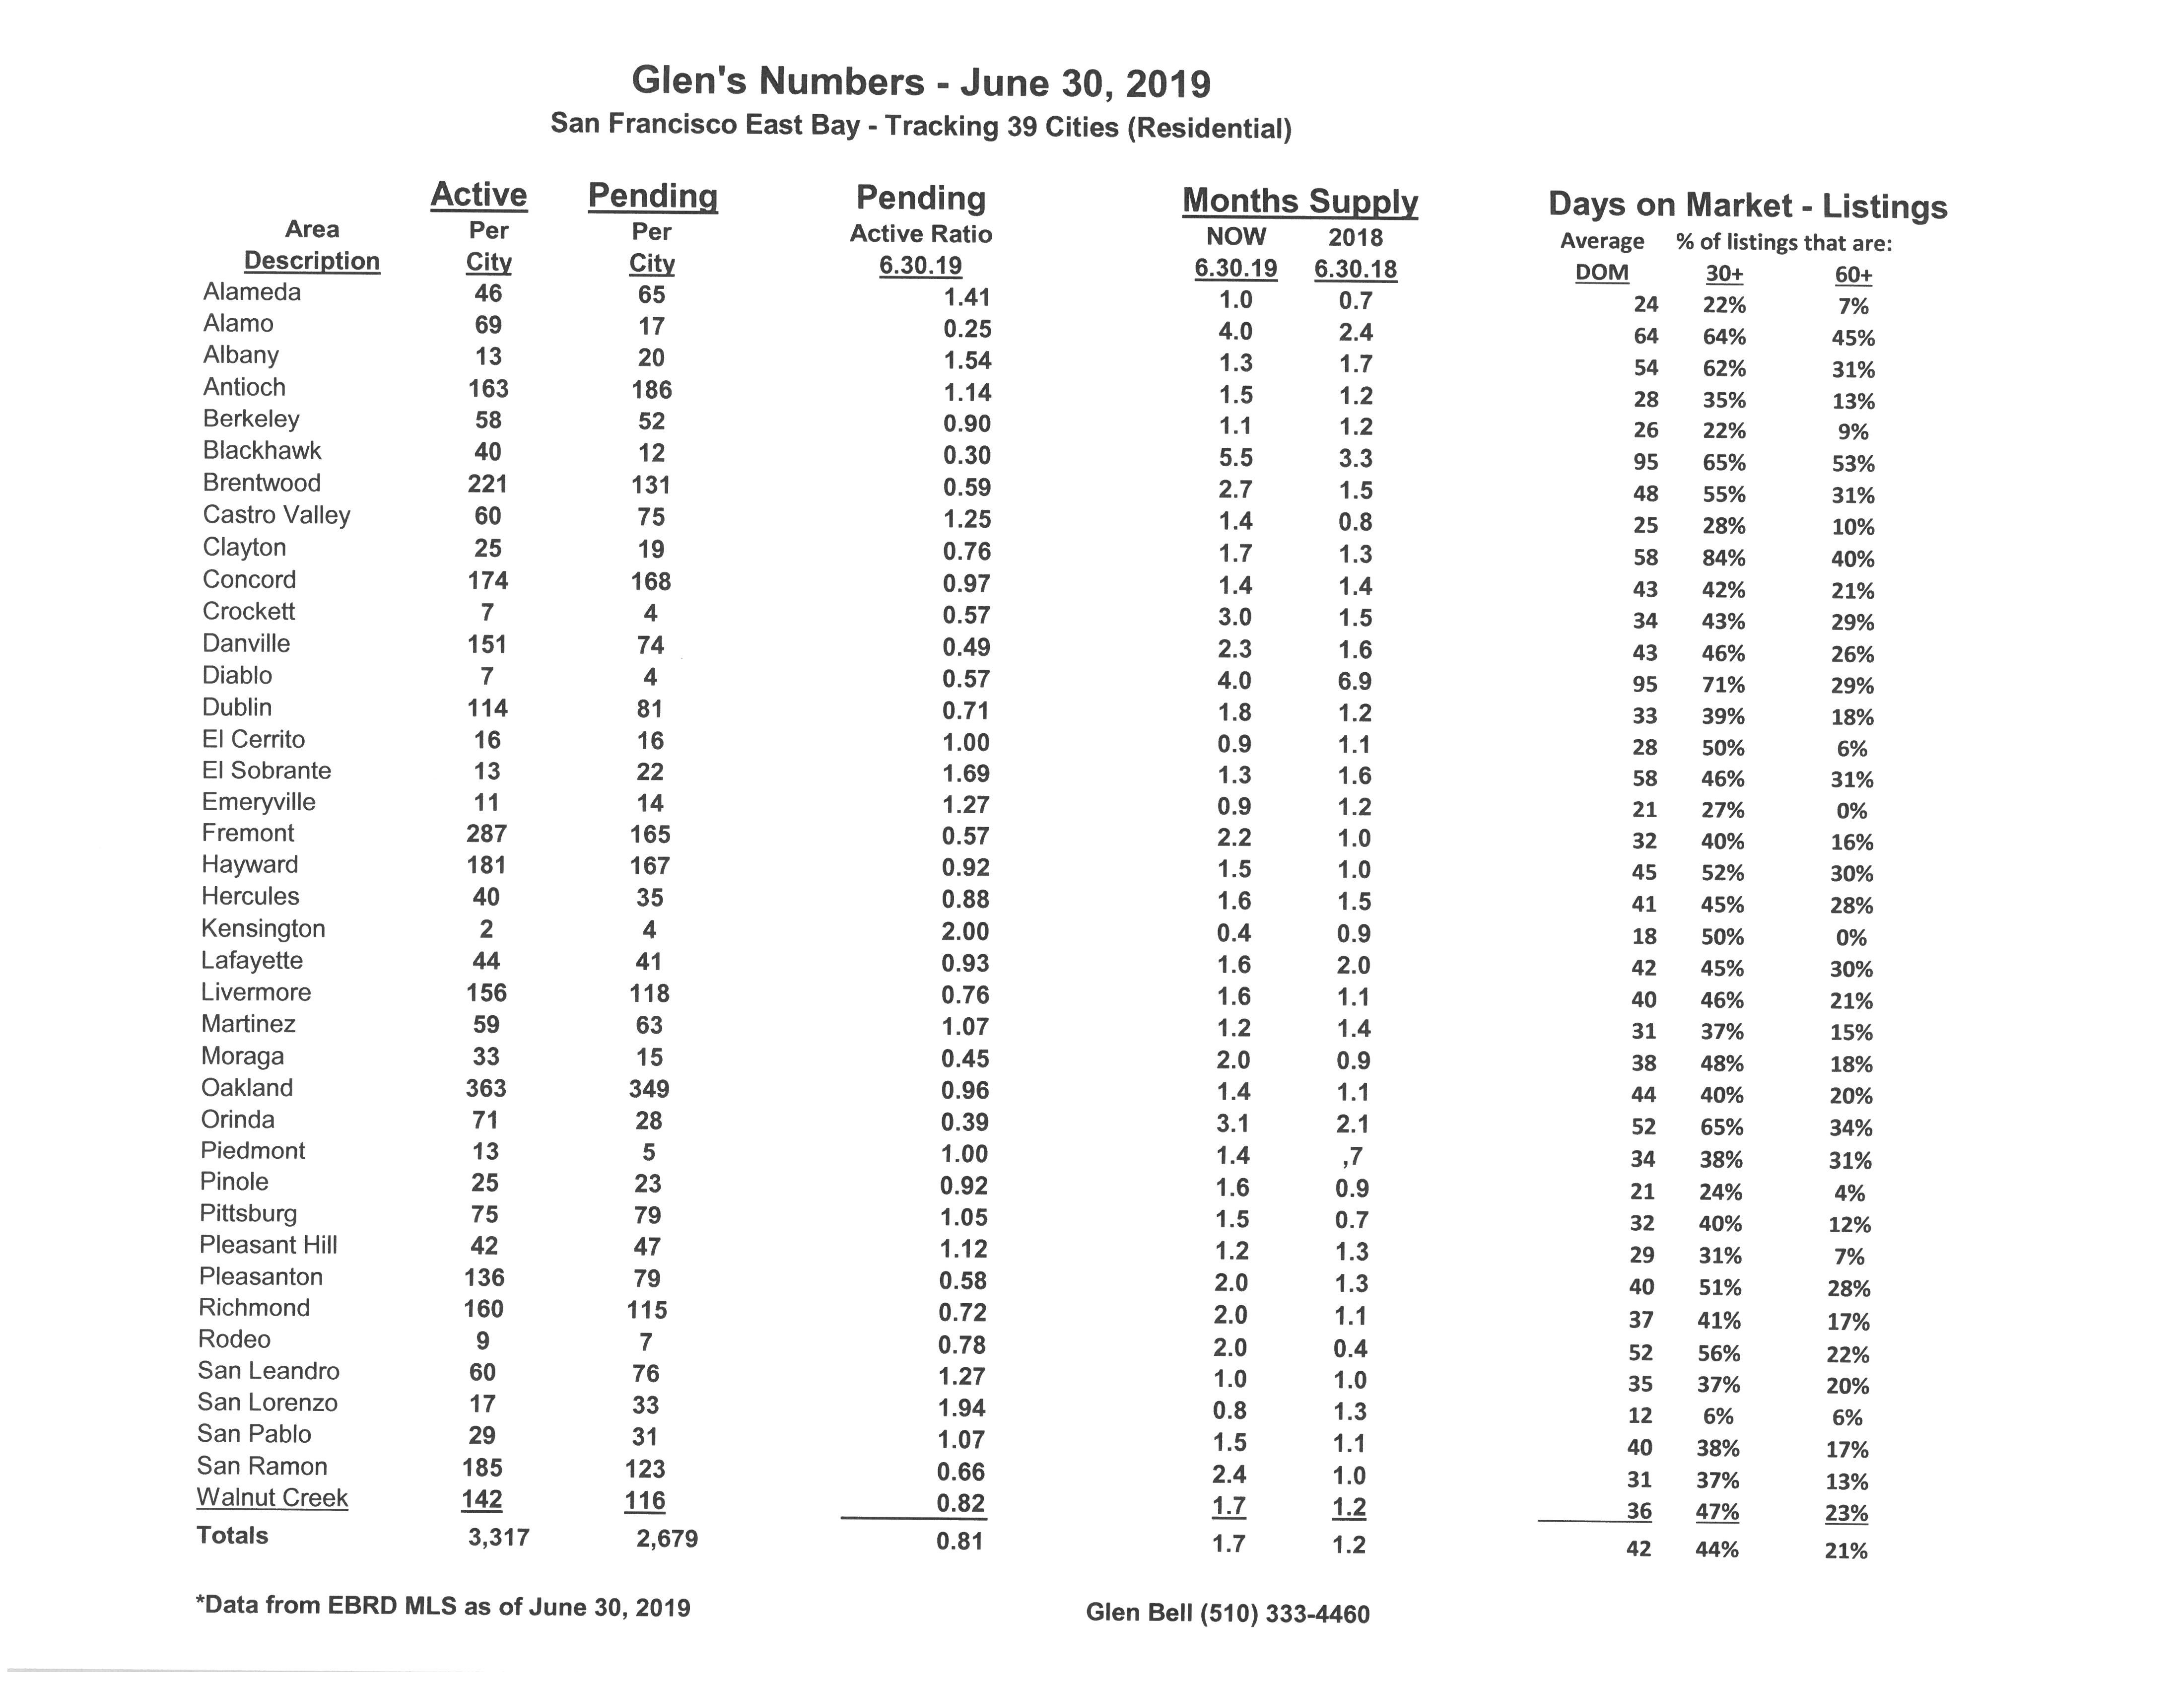
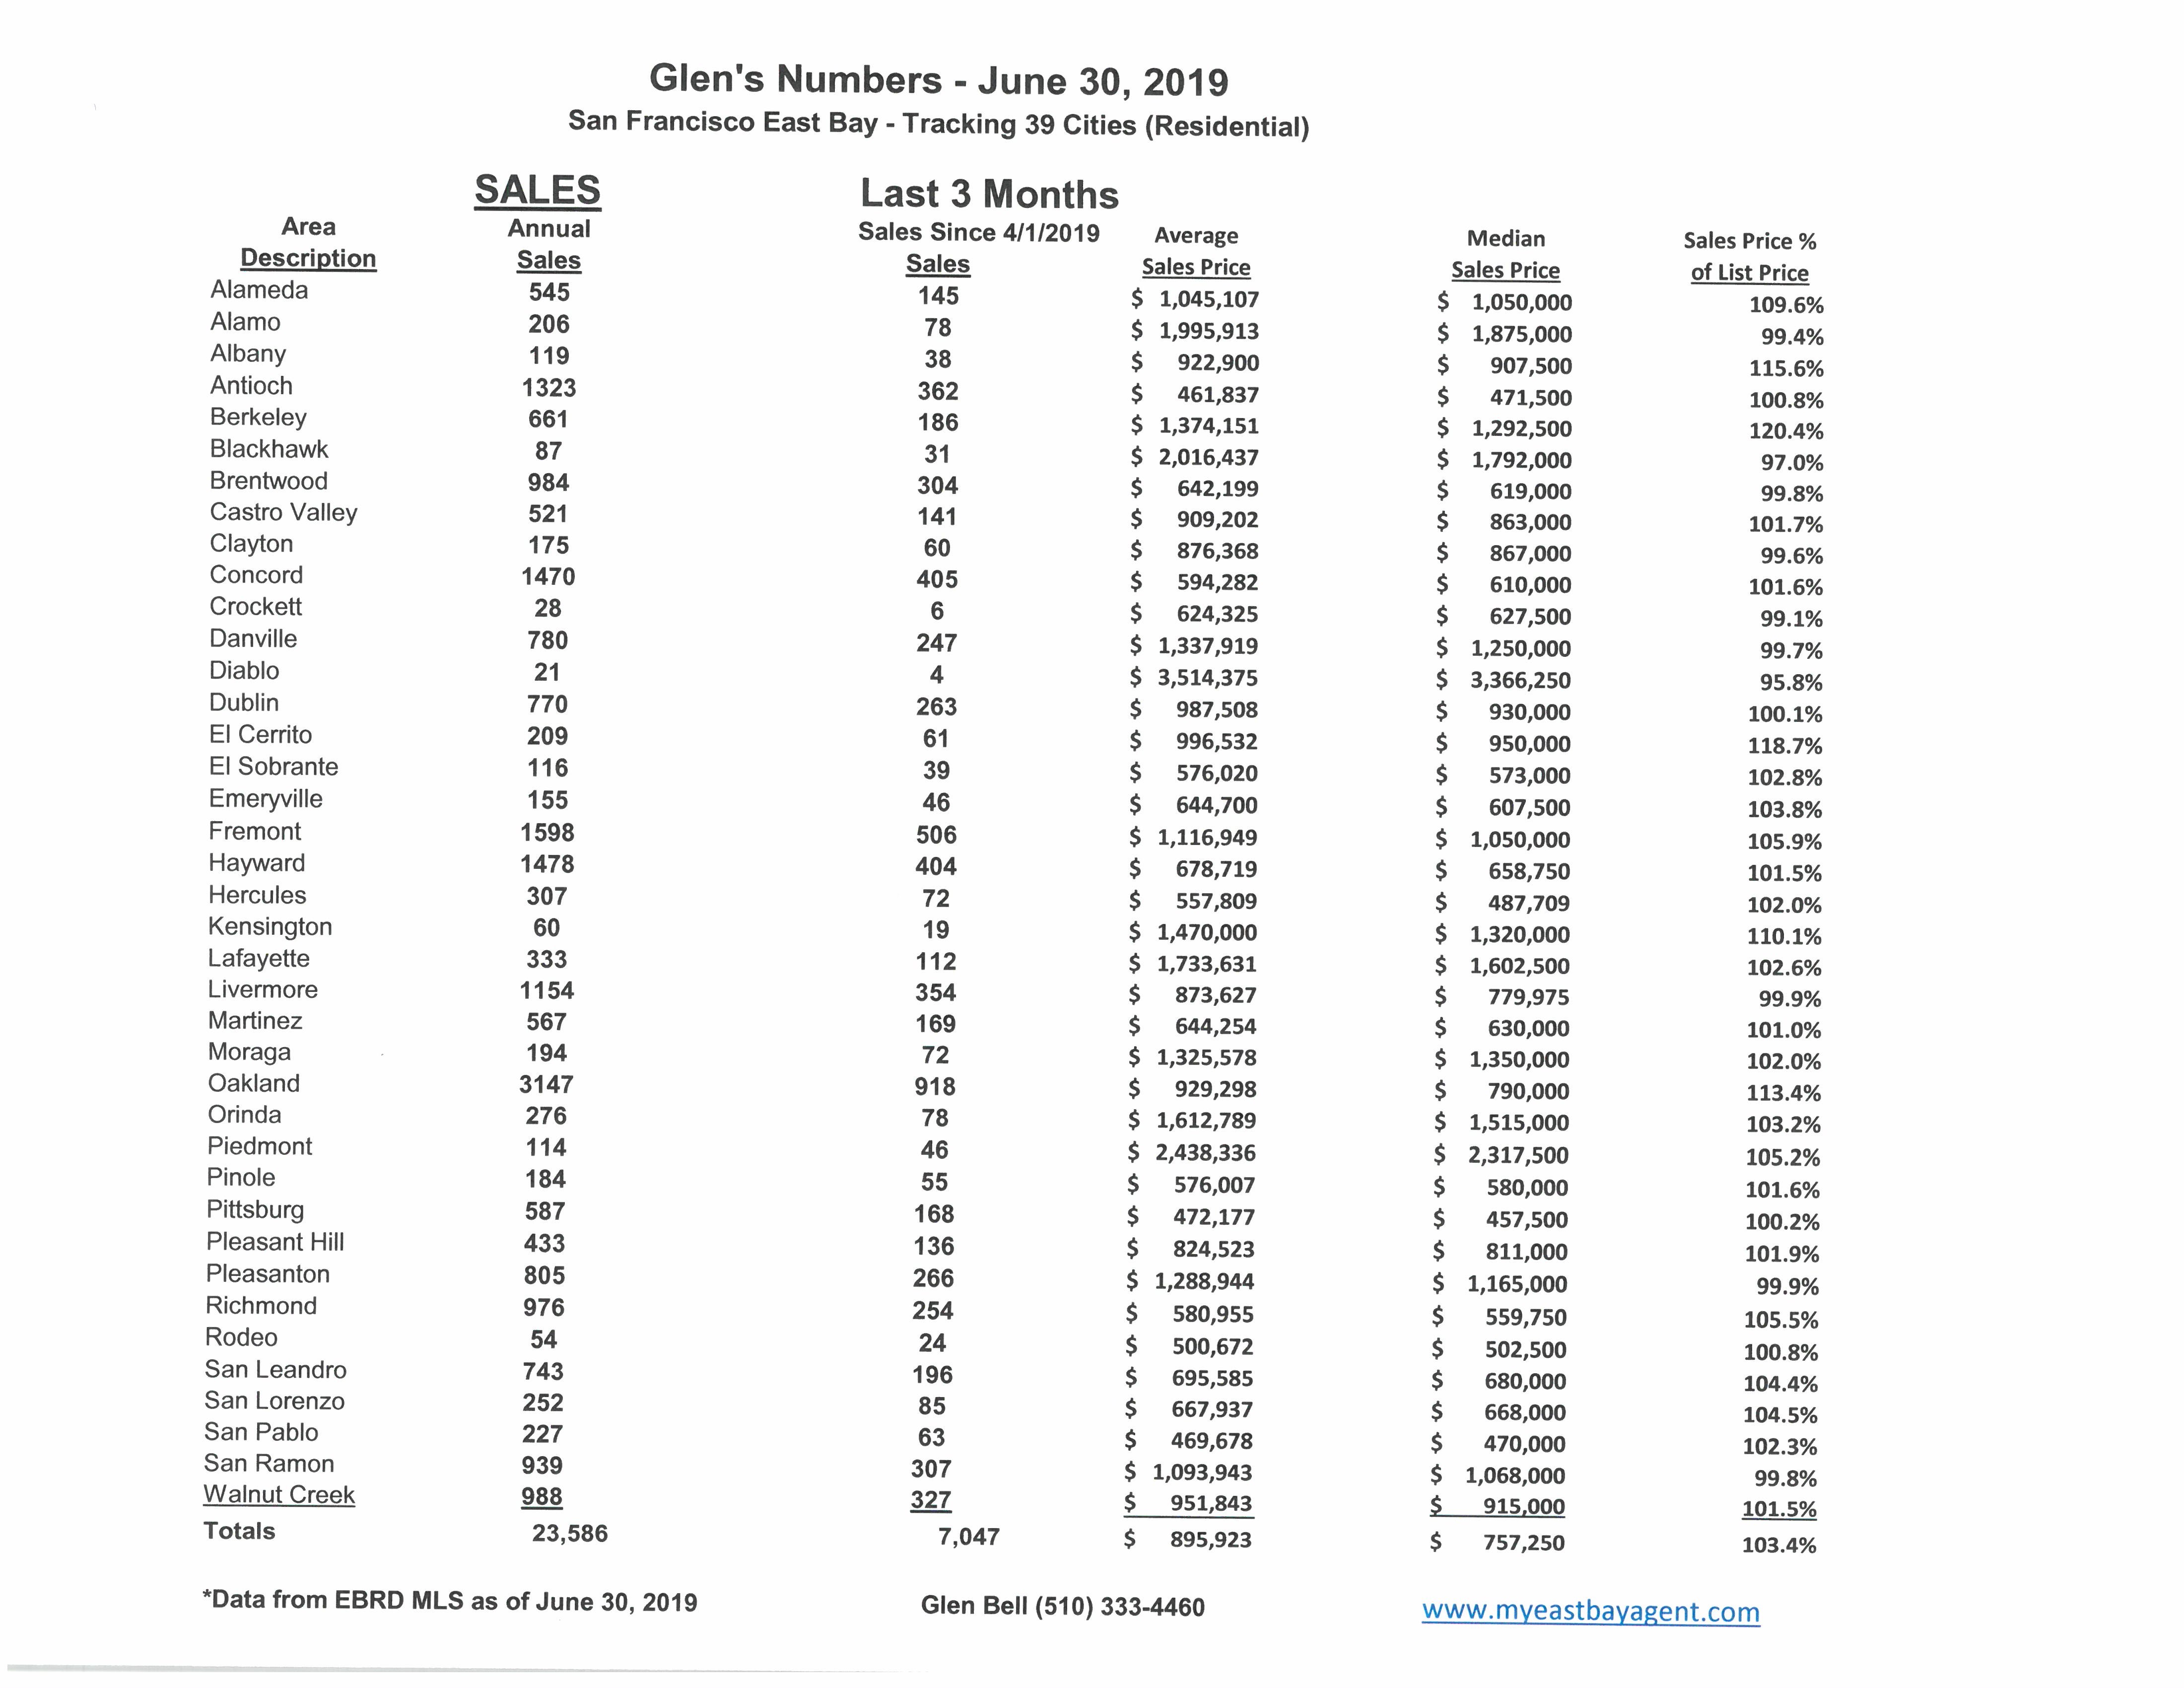
Here are some highlights for the 38 East Bay Cities that I track:
Affordability, increasing inventory, reduced sales, considerations of moving out of the Bay Area, are all topics of interest in a market in transition. Properties are staying on the market longer, we’re seeing fewer offers than before, more price reductions and some incentives now being offered, in effect, all favoring buyers. Yet indecision has many buyers on the fence with a wait and see attitude despite having more choices. The gap between buyer and seller expectations has increased. A softening of the market has many sellers still holding out for top dollar, while buyers seeing a bit of leverage for the first time in years are now looking to possibly take advantage.
- Here’s where we stand as of the end of May. Typically, we see a dramatic drop in inventory during December followed by a modest steady increase in Spring and Summer. Inventory has increased by 88% since the beginning of the year, now sitting at a 51 day supply of homes for sale, (However, this is much higher in comparison to last year’s end of June of a 36 day supply). Pendings actually decreased slightly despite new inventory coming onto the market, still lagging behind last year by 7.1%. The pending/active ratio decreased slightly to .81, still below our neutral mark. However, our ratio last year at the end of June was a strong (seller’s) 1.16. This is quite a difference. This is the 12th month in a row that the ratio has fallen below 1.00. The pending/active ratio has been a benchmark that we’ve used as a measure of supply and demand to determine whether we’re in a buyer’s or a seller’s market. Typically, a number well above 1, (more inventory with fewer pendings) favors sellers. A number below 1 favors buyers. In short, we have moved from a strong seller’s market since the beginning of last summer towards a more normal and balanced market, and in many cases, now favoring buyers.
- The percentage of homes “sitting” has increased slightly to 44% of the homes listed now remaining active for 30 days or longer, while 21% have stayed on the market for 60 days or longer. Still there are many more homes that are “sitting” this year as compared to last year, (with then 30% remaining active over 30 days and 12% remaining active over 60 days).
- The “distressed” market, (foreclosures and short sales) are no longer a factor representing less than .05% of the market.
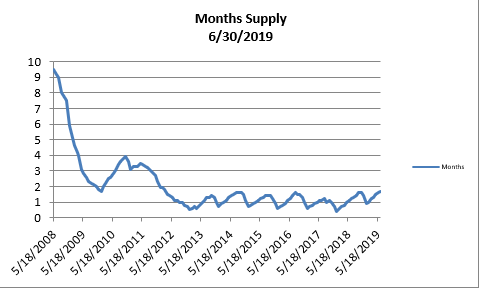
- The month’s supply for the combined 39 city area is 51 days. Historically, a 2 to 3 months’ supply is considered normal in the San Francisco East Bay Area. As you can see from the graph above, this is normally a repetitive pattern over the past four years. We are higher when compared to last year at this time, of 36 days.
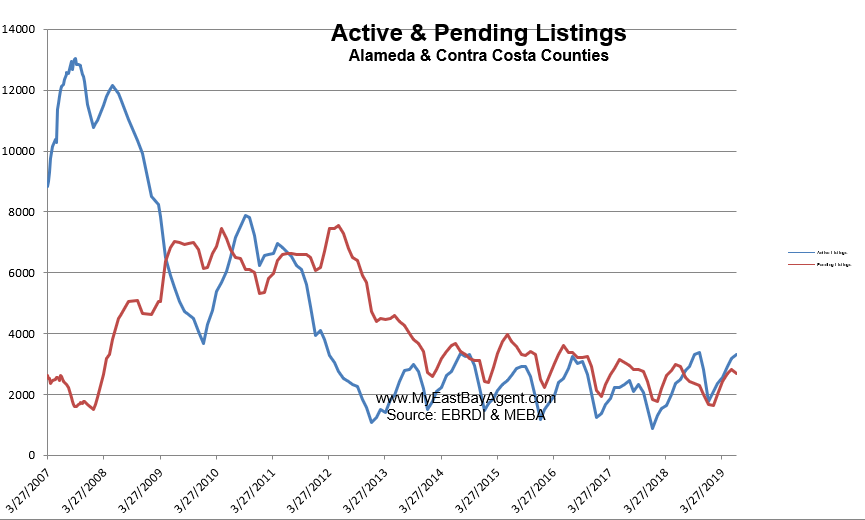
- Our inventory for the East Bay (the 39 cities tracked) is now at 3,317 homes actively for sale. This is higher than last year at this time, of 2,505 or (32.4% higher). We’re used to seeing between 3,000 and 6,000 homes in a “normal” market in the San Francisco East Bay Area. Pending sales decreased to 2,679, less than what we saw last year at this time of 2,909, or 7.1% lower.
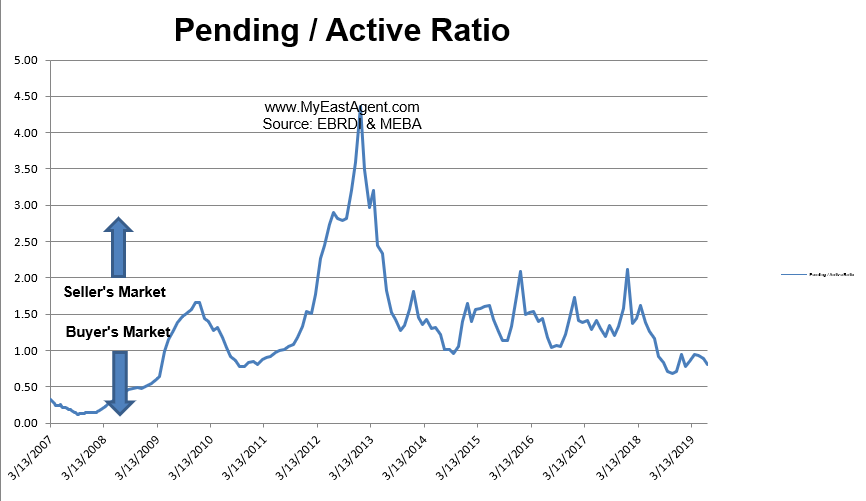
- Our Pending/Active Ratio is .81. Last year at this time it was 1.16.
- Sales over the last 3 months, on average, are 3.4% over the asking price for this area, lower than what we saw last year at this time, of 6.2%.
Recent News
Halfway Into 2019, How Is The Housing Market Holding Up?
By Caroline Feeney, Forbes, July 1, 2019
Hard to believe we’re already halfway through 2019.
Headed into the year, all eyes were on the housing market as it showed signs of softening for the first time in recent memory. A sharp rise in inventory, talk of more rate hikes and shrinking home price gains in the fourth quarter of 2018 created a cloud of uncertainty.
Six months in, it’s safe to say that the sky isn’t falling. But you might think of the real estate market right now as behaving like a C student that isn’t living up to its full potential.
“The housing market is doing fine,” said Lawrence Yun, Chief Economist for the National Association of Realtors. “But it certainly can do better given what’s happening with job creation and the historically low mortgage rate that is currently in place.”
To make sense of this transitional period, it’s time for a midyear market pulse check. Here’s how leading industry economists are piecing together the first stretch of 2019 and what they say is in store for the future of housing.
Affordability challenges yank back price growth
“For the first time in a long time, we’re starting to see prices correct,” said Skylar Olsen, Director of Economic Research at Zillow. “And the big thrust that’s changing that narrative is the affordability challenge.”
She explains that when home values outpace incomes so aggressively, the two “have to snap back together eventually,” which is in effect what’s happened.
In April, the S&P Case-Shiller Home Price Index dropped for the 13th month in a row. To be clear, home values are still going up nationally; they’re just rising at a more moderate rate. Annual gains for April clocked in at 3.5%, down from 3.7% in March.
But in some markets the shift has been far more dramatic.
Take Seattle. For two years price growth accelerated faster there than anywhere else in the country. Then between April 2018 and April 2019, the year-over-year price change shrunk from 13.8% growth to a 0.0% flatline. Over the same time frame, San Francisco fell from 10.9% to 1.8% annual gains.
Notice a trend? The markets with the fastest growth fell the hardest. Some exceptions bucking the norm have been Las Vegas, Phoenix and Tampa, their resilience due to how hard they were hit by the 2008 housing crisis.
“I would say the price appreciation of 3% is a healthy development,” added Yun.
Mortgage rates drop, but buyers aren’t jumping the gun
After four benchmark rate hikes in 2018, the Federal Reserve signaled it planned on two more increases this year. That gave analysts every reason to believe mortgages were well on their way 5.5%.
But in March the Fed moved away from that intent and showed signs of even lowering the interest rate (whether that will happen is still TBD). As expectations changed, mortgage rates dropped from 5.09% to 4.09% between November 2018 and June 2019.
However, low interest rates aren’t like an immediate caffeine jolt for the housing market. “It doesn’t impact the down payment,” said Olsen. “And that’s the real struggle, right? Just because mortgage rates dropped doesn’t mean I can suddenly reenter the housing market.”
Demand is also tied to homebuyer sentiment, which isn’t necessarily strong right now. In June, consumer confidence dropped 9.8 points to the lowest level since September 2017 as a result of tensions surrounding the trade wars, according to the Conference Board.
“Consumers are picking up on that lack of certainty about the economic outlook,” said Danielle Hale, Chief Economist at realtor.com. “And that’s not necessarily going to inspire them to make large purchases like a house.”
Inventory challenges persist on the low-end price points
Overall inventory has started to creep up a bit this year, though it’s deceiving to try and judge the state of affairs without seeing how the market is truly split in half.
“There is plentiful inventory on the upper end market, so the housing shortage is really on the mid-priced and low ends,” said Yun. “Because the property tax deduction has been limited, there is less desire or greater financial burden from owning than before, so the upper-end market appears to be generally softer.”
In addition experts say builders have faced a number of obstacles to ramping up new construction, including high land prices, labor barriers, material costs, and the onerous process to obtain permits.
All this puts pressure on profit margins so when builders do construct a new house, it tends to be more on the luxury end.
Finally, as people move less often and more boomers decide to age in place rather than downsize, “that’s just kind of holding up a lot of the inventory that otherwise would be lubricating the whole system,” Olsen added.
So together these dynamics have created a tale of two markets.
“If you’re selling an entry level home, you’re probably still looking at a pretty competitive market in most places,” said Hale. “But if you’re selling a more expensive home you probably have to adjust your expectations.”
Cost of living and taxes sway local market conditions
Nationally, housing conditions could be described as a seller’s market that’s gradually moving more in favor of buyers.
Drill down to the regional or local level though, and it varies. For one, some metro areas outside of major cities have stayed warmer as they catch the spillover of priced-out buyers (see: Tacoma). Strong job creation and reasonable cost of living has kept Midwest markets like Louisville and Indianapolis thriving, along with markets that resemble the Midwest in affordability. Rochester, New York is a prime example.
But there’s always exceptions. Go to Chicagoland, and you’ll hear agents tell a very different story.
“It’s definitely a buyer’s market here,” said Kim Alden, a Realtor with Baird & Warner in the Chicago suburb of Barrington, Illinois. “Inventory is a lot higher. Buyers are negotiating harder than ever because there’s a lot of people who want to sell their house and they’re using that to get the lowest price that they can.”
Alden says that 65%-75% of her listings come from people who want to leave the state of Illinois altogether to escape new and existing state tax laws.
With supply high, she’s seeing sellers experience disappointment that they can’t get as much money for their house as they expected, with one exception: updated, smaller homes are “flying off the shelves.”
“I listed a little three-bedroom, bath and a half for $178,000, and in the first weekend we had 33 showings,” Alden recalled.
Apparently anywhere, an affordable turn-key home remains a hot commodity.
But high-end sellers will need to bust out the paint and spruce up their curb appeal to attract buyers.
What about the rest of the year?
Real estate experts remain optimistic about housing’s prospects for the latter half of 2019. Olsen expresses that even if GDP growth weakens and wages slow, it’s likely that the market is primed for some kind of a rebound.
The biggest reason for this is that as huge waves of millennials continue to reach peak home-buying age, that will put pressure on demand not only this year but in the years to come. And it’s hard to argue with long-term demographics. If a recession does hit at some point as part of the economic cycle, housing would therefore be impacted though perhaps not devastated.
Ultimately after a long post-recession hot streak, housing was due to break fever. The hope is that the market will heat up a little slower next time and create some normalcy. For now, consider it a short-term correction, and hope that more homes will come on the market that people can actually afford.
“The perfect scenario going forward,” Yun said, “even off into the next couple of years, is if there can be a robust increase in new home construction, the housing market will be more of a bright spot for the broader economy.”
Bay Area home prices fall 1.7% in May, biggest year-on-year drop in 7-plus years
Kathleen Pender, SF Chronicle, June 27, 2019
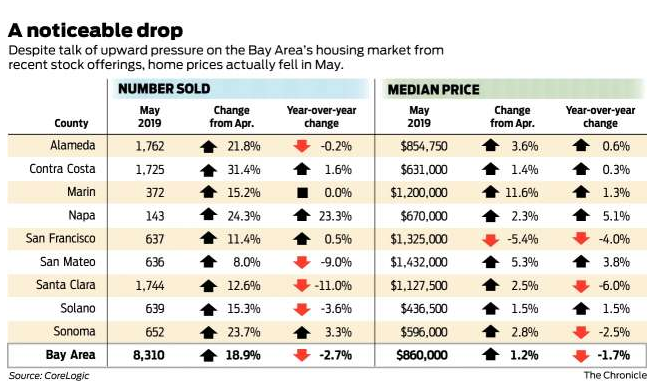
The median price paid for a Bay Area home or condo last month was $860,000, up 1.2% from April but down 1.7% from May of last year, representing the biggest year-over-year percentage drop in more than seven years, according to a CoreLogic report released Thursday.
To put that year-over-year decline in perspective, it’s important to remember that in May of last year, the market was in a frenzy and the median price was one month away from its all-time high of $875,000, set in June.
After home sales rose at double-digit rates in the first half of last year, growth began slowing in the second half, to almost a crawl this year. In March, the median price actually dipped 0.1%, its first year-over-year decline in seven years, and in April it was unchanged from the previous year.
Last month’s 1.7% drop “marked the largest decline since February 2012, when the median fell 3.6% year over year,” said CoreLogic analyst Andrew LePage. The next month, the median rose 0.6%, and in April 2012, it began an 83-month stretch of consecutive gains. CoreLogic’s report includes new and existing homes and condos in the nine-county Bay Area.
Today, “there is a sense of pause by buyers because they don’t know what’s next,” said Selma Hepp, chief economist with the Compass real estate brokerage. “We are definitely seeing a lot of activity out there; buyers are coming to open houses. But for homes in imperfect condition, or imperfectly priced, they’re not willing to pull the trigger.”
Well-priced homes in excellent condition are still selling briskly, she added. The median time on the market for homes that sold last month was 14 days, only two more than a year ago. But for homes that were still for sale last month, the median time on market was 22 days, six days longer than last year, she said.
Plotted on a graph, prices today look like a “tabletop,” compared with the “mountaintop” seen in the last cycle when prices plummeted after a steep run-up, she said.
In San Francisco, the market varies by price range and neighborhood, but overall, “it’s relatively flat, which is not so bad, considering that the housing market has been nuts in the past few years,” said Dona Crowder, a broker with Coldwell Banker.
“Luxury” homes in the $7 million to $30 million price range are selling well, she said. And for homes priced from $500,000 to $1.5 million, “you’re still going to experience multiple offers in a preponderance of the situations.” The slowest segment is $3 million to $5 million homes.
Prices rose 1.2% from April to May thanks to “lower mortgage rates, more inventory and a transition to a more neutral market where buyers have some bargaining power,” LePage said in a news release.
The average rate on a 30-year, fixed-rate loan dropped to 3.73% this week from 4.5% the first week of January, according to Freddie Mac.
That drop “created a window of opportunity for a lot of first-time buyers,” said Phil Kerr, CEO of multifamily developer City View. He’s seen a “big surge in sales since January” at the Ice House, a townhome development under construction in West Oakland that was severely damaged in an October fire.
Exodus: For Bay Area millennials, moving up means moving out
20-somethings most restless and likely to leave
By LOUIS HANSEN, Bay Area News Group, July 7, 2019
While some of their 20-something friends burned through their paychecks, Brian and Jen Hurst saved.
The young couple skipped fancy vacations, ordered appetizers for dinner on date nights, and lived with roommates to scrape up nearly $150,000 for a down payment on a home.
After four, tight-belted years, the couple bought a modest two-bedroom in East San Jose for $700,000 in late 2016. They continued to juggle several jobs to make ends meet and fix the home up for the family they hoped to start. Two-and-a-half years later, the Hursts put a “For Sale” sign up in their yard. Exhausted, they were done with the Bay Area.
“I’m working at 150 percent,” said Jen, a bio-chemist, “to be lower middle class.”
More than 6 in 10 Bay Area residents under 30 said in a recent poll they expect to leave the Bay Area in the next few years. Millennials are the most likely age group to say they’re leaving, with 55 percent of those under 40 looking to escape, according to the poll conducted in February by the Silicon Valley Leadership Group and this news organization.
It’s a trend that sets off alarms for regional leaders, watching the lifeblood of new workers drain to other regions and states.
“The Bay Area is increasingly becoming a place unaffordable to the children of NIMBY parents, who have blocked the approvals of new homes that lock out our own sons and daughters from being able to live in the communities in which we raised them,” said Silicon Valley Leadership Group CEO Carl Guardino, noting the state has a deficit of 3.5 million homes.
Long-time residents also are losing hope that their children and grandchildren will be just a Sunday drive away during their retirement.
Gail Price, a Palo Alto retiree and former city councilmember, recently watched her youngest son move from the Bay Area to Portland because of high housing costs. She and her husband had hoped to keep their three sons and grandchildren in the Bay Area, but only one has been able to stay. “Not everyone is part of the one percent,” Price said. “A sustainable community is one that is inclusive.”
The Bay Area is still a net-importer of residents drawn by a booming economy, a tech culture obsessed with younger, cheaper employees, and a buzzing nightlife in three major cities.
But a smothering combination of high rents, higher home prices, and expensive food and clothing make it difficult to save and plan for a future in the region. Fewer young people are buying increasingly expensive real estate: home ownership for Californians under 35 dropped from 30 to 23 percent between 2005 and 2017, according to the California Association of Realtors.
The rental market has soared, too. Since May 2014, the average rent for a one-bedroom apartment has risen 22 percent to $2,120 a month in San Jose, increased 11 percent to $2,469 in San Francisco, and grown 15 percent to $1,773 in Oakland, according to Apartment List.
Even without consulting a spreadsheet, many young professionals now say their future is elsewhere.
Javier De La Cruz, 27, lives in Pittsburg and works as a financial center manager in Moraga. He and his wife, Michelle, graduated from Pittsburg High School and earned associate degrees from nearby Los Medanos College.
The young couple is starting a family and want to stay close to their parents. But it’s become nearly impossible, De La Cruz said. Over the last three years, he’s bid on 15 houses in Pittsburg and surrounding cities. He lost every single time. “I was looking for something that didn’t soak up every single cent,” he said.
They carpool to work, trade date nights for home cooking and Netflix, and someday hope to have enough for a down payment on a house. “It really feels like a revolving door that never stops,” he said.
De La Cruz is looking to Las Vegas — a short flight from the Bay Area for relatives, with a healthy economy and cheaper homes. His family doesn’t want him to move. “Everything we know is here,” De La Cruz said. “It’s a tough decision for both of us. But we have to do something.”
Higher prices have meant more adult children living with their parents. In 2017, roughly 36 percent of Silicon Valley adults between the ages of 18 and 34 lived with their parents, according to an analysis by Joint Venture Silicon Valley.
Alex Melendrez, 26, grew up in San Bruno in the home his parents bought nearly 30 years ago, when his father, a cook, and mother, a waitress, scrounged enough money together for a down payment on a three-bedroom, two-bath house.
Melendrez lived at home while he earned his political science degree from UC Berkeley. Five years later, he lives in the same room, paying $500 a month in rent to stay with his parents, two adult sisters and a two-year-old nephew.
He’s looked at a few rooms for rent, but they would eat up at least two-thirds of his income as an organizer for the Housing Leadership Council of San Mateo County. “Oh God, I honestly have no prospect of owning a home,” he said. “I cannot see owning my own place here. Even a condo.”
Like Melendrez, many stick around, despite the uncertainty.
Ryan Globus grew up in Santa Cruz and earned his computer science degree from Stanford. For his senior project, he and a few classmates designed a program to scrape desirable Craig’s List rental listings and have the results sent to their inbox. He got an A in the course.
Globus said most of his college friends worried about finding a decent Bay Area apartment. He spent a summer in Palo Alto with four roommates, a group assembled by an off-site landlord. The tenants barely spoke and he’s not sure they ever knew each others’ names. “In hindsight,” he said, “it was kind of weird.”
Globus, 27, is a software engineer at Apple, and now feels fortunate to rent a two-bedroom home in Palo Alto with his husband and a roommate.
Many days, he dream-surfs Trulia for homes in Philadelphia, Sacramento and Austin, Texas. But he still wants to be in the Bay Area to help his aging parents. “I hope I’m still here,” Globus said. “I want to be here.”
But the parting can be sweet sorrow — if it’s timed right.
Brian, 29, and Jen Hurst, 28, grew up and went to college on the Peninsula. Their families still live in San Jose and Santa Cruz.
Yet living in the Bay Area has taken its toll, and the couple believes the stress of working multiple jobs — in addition to their full-time jobs, the couple runs a summer science camp — has contributed to debilitating health problems.
They rarely went out, lived with Brian’s parents in college, and then several roommates in a Santa Clara townhome. They scraped together about $150,000 and made the 20 percent down payment on their home in the East San Jose foothills in late 2016.
When they moved in, they thought the house would be their home for decades — expanded and improved, to fill with family, pets and memories. “We were 100 percent sure,” Jen said. “We never thought we would ever move.”
But the property tax bills and maintenance had the couple continuing their penny-pinching. They vacationed one week a year and asked relatives for gift cards for their birthdays and Christmas. They continued to spend on the house, not their lives, they said.
He informally surveyed about 40 friends and found only one or two planning to stay here. “In the last few years,” he said, “we’ve really hit a wall.”
SF home prices drop, still unaffordable for all
“It’s possible price points for homes have reached a level that households simply cannot afford”
By Adam Brinklow, Curbed, June 28, 2019
On Thursday, Orange County-based data firm Core Logic reported that the median home price in San Francisco is down year over year, dropping four percent in May.
Earlier this year, the firm recorded the first drop in the Bay Area’s median price year over year since 2012, diminishing an almost comically small yet still significant 0.1 percent for March. However, the price of a home in SF rose more than five percent within that period.
Now the firm’s most recent San Francisco Bay Area home sales report once again found prices down across the Bay Area, showing a decline of 1.7 percent across in all nine counties, including a four percent depreciation in SF.
Across 637 homes, the SF price (as calculated via MLS sales) declined from $1.38 million this time last year down to $1.32 million now.
Other resources have also shown small but significant dips in SF’s median year over year, but this is the first time Core Logic’s data has agreed. Last time the firm recorded a year over year decline in SF was in April 2017—at the time, a much larger decline of 7.3 percent.
The California Association of Realtors [CAR] released its May data this month. The firm not only corroborates Core Logic’s conclusions but builds on them, showing even bigger price drops at 4.8 percent in SF.
According to CAR, the May price in SF dropped from roughly $1.69 million in 2018 to $1.62 million this year. [Correction: Nope, that’s the other way around: CAR’s SF median increased 4.8 percent year over year. Whereas Core Logic looks at all home sales, CAR only compiles the price of single family homes, so their conclusions diverge.]
The year-over-year drop from CAR for the entire Bay Area was 5.7 percent, ebbing below $1 million down to $990,000.
The problem with these monthly figures is the uncertainty as to which ones are blips and which ones might be part of or the beginning of real trends.
For example, the 7.3 percent SF price drop in April 2017 was big but didn’t last, with median rices soaring for the rest of the that year.
“San Francisco is a relatively small market compared with some of the larger counties, and the median sale price tends to be a bit more volatile,” a Core Logic spokesperson tells Curbed SF.
LA-based Beacon Economics’ regional outlook report for California homes, released this week, compared performances across the entire quarter. Their conclusion: Yes, prices are down in the long term as well:
From the first quarter of 2018 to the first quarter of 2019, the median price of an existing single-family home in San Francisco decreased by 1.1 percent, or $16,200, to reach $1.43 million. While not a huge dip, it is indicative of greater weakness in price appreciation
Given the Bay Area’s healthy economy, it’s possible that even with all of the wealth being created in the region, the price points for homes have reached a level that households simply cannot afford.
Beacon notes that the number of homes sold also dropped nearly six percent in SF, along with much larger declines of 11.8 percent in the East Bay and 18.2 percent in the South Bay.
Just as one month does not itself a trend make, neither does one quarter. Still, there have been few signs of housing appreciation in 2019 so far—and none of these new figures are rocking the boat.
1st-Time Homebuyers Are Getting Squeezed Out By Investors
By Amy Scott, NBR, June 22, 2019
It’s gotten a lot harder for first-time homebuyers to nab that dream house. The pool of smaller, affordable starter houses is low. And increasingly, first-time homebuyers are competing with investors who are buying up these homes.
Last year, investors accounted for 1 in 5 starter-priced homes, according to data released by CoreLogic on Thursday. The rate of investor purchases of starter homes has been rising and has nearly doubled since 1999.
Tonya Jones, a Realtor in metro Atlanta, says it is frustrating both for agents and for their first-time homebuying clients when they can’t compete with investors.
First-time buyers typically put down 3% to 5%, Jones said. “Then they’re walking in competing with an all-cash buyer who can close whenever that seller is ready,” she said. “Typically, a first-time homebuyer can’t work under those parameters.”
Investors have always made up a big part of the market for starter homes. But smaller investors are playing a growing role. Last year, these mom and pop investors represented 60% of investor purchases — up from 48% in 2013, CoreLogic said.
As investors snap up more properties, they’re helping drive up prices in many cities nationwide. In May, the median price of existing homes was $277,700, up 4.8% from a year earlier, the National Associations of Realtors reported Friday. For single-family homes, the median price was $280,200, up 4.6%.
Some regions saw a slowdown in home sales at the end of 2018. And last month, sales of existing homes fell 1.1% from a year ago, even as median prices marked the 87th straight month of year-over-year growth, the NAR said.
Jones, who is also a small investor, said rising prices have kept her from buying new properties.
“Investors count on appreciation,” she said. “We’re at a pretty elevated price point right now, so it’s hard to imagine price per square foot getting any higher.”
Investors tend to buy cheap homes with the goal of renovating them and putting them back on the market at a higher price, or renting them out. Lawrence Yun, chief economist at the National Association of Realtors, said investor buying could lead to greater wealth inequality as homeowners and investors profit and nonhomeowners are left behind.
“If first-time buyers are less capable of buying, we’ll have a strange situation where the economy could be good, but the homeownership rate will be underperforming by historical standards,” he said.
In 2018, eight of the top 10 metro areas with the highest investor purchase rates were in the Eastern half of the U.S., CoreLogic said.
The top markets for investors were Detroit, where they accounted for 27% of sales, Philadelphia at 23.3% and Memphis at 19.7%. Some cities with the least investor activity are in Ventura, Calif., and Boise, Idaho, at 4.8% each, and Oakland, Calif., at 5.1%.
As Bay Area housing crisis worsens, companies from Google to Wells Fargo ($1 billion each) step up
By Melia Russell, San Francisco Chronicle, June 19, 2019
Wells Fargo. Kaiser Permanente. Salesforce’s Marc Benioff. Now Google.
One by one, the corporate titans of the Bay Area are vowing to plow dollars into solving the region’s biggest crisis — housing.
It’s a sign of just how serious the problem has become, for employees who need a place to live and also for the region’s major companies, which are under fire from their communities because their workers are displacing longtime residents.
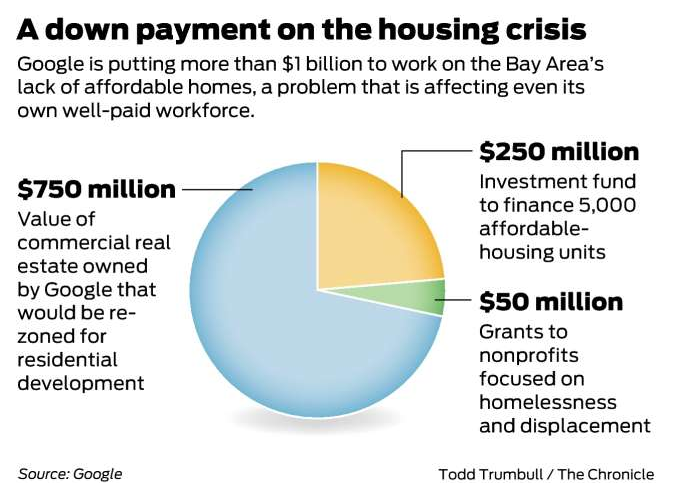
Google’s announcement Tuesday that it would put $1 billion toward housing — including affordable units for the community and housing for its employees — came weeks after Wells Fargo pledged the same round number — $1 billion — toward housing affordability over the next six years.
Also new this year: The Partnership for the Bay’s Future, a group of local foundations and companies including Facebook and the Chan Zuckerberg Initiative, is raising $540 million for affordable housing. In January, Kaiser Permanente said it will put aside $100 million to grow affordable housing in Bay Area cities and other places where the health system operates.
Salesforce’s billionaire co-founder Marc Benioff and his wife, Lynne, have put up tens of millions of dollars to fund research on homelessness, subsidize rents for the newly housed and back a ballot measure that passed in November that will tax big businesses in San Francisco to help pay for homeless programs.
It’s a subject that preoccupies every employer in the region.
United Airlines, which has more than 12,000 employees and a huge maintenance base near San Francisco International Airport, has looked at building units of housing for employees, according to Scott Kirby, the airline’s president. Many employees, after meeting a minimum of months worked, ask to transfer somewhere with a lower cost of living, Kirby told The Chronicle last year.
“It’s a challenge that’s broader than us,” Kirby said. “It seems to me that the community needs to solve this somehow. We’d love to be a part of that solution, but it’s hard for any one company to solve.”
As corporations in the Bay Area rode a wave of unprecedented job growth, the public sector let housing problems fester, said Nathan Ho, who leads housing policy at Silicon Valley Leadership Group, a business advocacy organization.
Cities are building only a small portion of what’s necessary. From 2010 to 2015, the Bay Area added 367,064 jobs but only 57,094 housing units, according to a 2017 report by the Silicon Valley Leadership Group and the Silicon Valley Community Foundation. The Building Industry Association estimates that 1.5 jobs per housing unit is a “healthy balance.”
“To solve our housing emergency, all of us — government, business, housing advocates, neighbors — must work together,” said state Sen. Scott Wiener, D-San Francisco, whose bill to spur denser housing around transit hubs was put on hold until next year.
Gov. Gavin Newsom has already asked tech companies to pitch in. He met with executives from Silicon Valley corporations in January about committing $500 million to help build housing aimed at middle-income families.
In a statement provided by Google, the governor said Tuesday he applauds Google for recognizing “it has an important role to play in addressing California’s cost crisis.”
Google’s proposal would build at least 15,000 housing units on its land, spread across the North Bayshore area of Mountain View, Sunnyvale and San Jose. It would not be limited to Google employees. As part of the initiative, the company also said it will establish a $250 million investment fund to help finance 5,000 affordable units close to its offices and around transit hubs, though it acknowledged its money would only meet a small portion of the 5,000-unit goal.
Why the wealth gap has grown despite a record economic expansion
By CHRISTOPHER RUGABER, ASSOCIATED PRESS JULy 02, 2019
As it enters its 11th year, America’s economic expansion is now the longest on record — a streak that has shrunk unemployment, swelled household wealth, revived the housing market and helped fuel an explosive rise in the stock market.
Yet even after a full decade of uninterrupted economic growth, the richest Americans now hold a greater share of the nation’s wealth than they did before the Great Recession began in 2007. And income growth has been sluggish by historical standards, leaving many Americans feeling stuck in place.
Those trends help explain something unique about this expansion: It’s easily the least-celebrated economic recovery in decades.
As public discontent has grown, the issue has become one for political candidates to harness — beginning with Donald Trump in 2016. Now, some of the Democrats running to challenge Trump for the presidency have built their campaigns around proposals to tax wealth, raise minimum wages or ease the financial strain of medical care and higher education.
America’s financial disparities have widened in large part because the means by which people build wealth have become more exclusive since the Great Recession.
Fewer middle-class Americans own homes. Fewer are invested in the stock market. And home prices have risen far more in wealthier metro areas on the coasts than in more modestly priced cities and rural areas. The result is that affluent homeowners now sit on vast sums of home equity and capital gains, while tens of millions of ordinary households have been left mainly on the sidelines.
“The recovery has been very disappointing from the standpoint of inequality,” said Gabriel Zucman, an economist at UC Berkeley, and a leading expert on income and wealth distribution.
Household wealth — the value of homes, stock portfolios and bank accounts, minus mortgage and credit card debt and other loans — jumped 80% in the last decade. More than one-third of that gain — $16.2 trillion in riches — went to the wealthiest 1%, figures from the Federal Reserve show. Just 25% of it went to middle-to-upper-middle class households. The bottom half of the population gained less than 2%.
Nearly 8 million Americans lost homes in the recession and its aftermath, and the sharp price gains since then have put ownership out of reach for many would-be buyers. For America’s middle class, the homeownership rate fell to about 60% in 2016 from roughly 70% in 2004, before the housing bubble, according to separate Fed data.
The other major engine of household wealth — the stock market — hasn’t much benefited most people, either. The longest bull market in U.S. history, which surpassed its own 10-year mark in March, has shot equity prices up more than fourfold. Yet the proportion of middle-income households that own shares has actually declined.
The Fed calculates that about half of middle-income Americans owned shares in 2016, the most recent year for which data is available, down from 56% in 2007. That includes people who hold stocks in retirement accounts.
The decline in stock market participation occurred mainly because more middle-income workers took contract work or other jobs that offered no retirement savings plans, the Fed concluded.
Hannah Moore, now 37, has struggled to save since graduating from college in December 2007, the same month the Great Recession officially began. She has worked nearly continuously since then despite a couple of layoffs.
“I had many jobs, all at the same time,” she said. “It’s just not been the easiest of decades if you’re trying to jump-start a career.”
She works for a design firm in Los Angeles that contracts with luxury apartment developers that build rental housing marketed to high-tech employees. She loves the work. But she struggles with Los Angeles’ high costs.
Moore says she could afford a monthly mortgage payment. But she lacks the savings for a down payment. About half her income, she calculates, is eaten up by rent, health insurance and student loan payments of $850 a month.
As financial inequalities have widened over the last decade, racial disparities in wealth have worsened, too. The typical wealth for a white household is $171,000 — nearly 10 times that for African Americans. That’s up from seven times before the housing bubble, and it primarily reflects sharp losses in housing wealth for blacks. The African-American homeownership rate fell to a record low in the first three months of this year.
Most economists argue that higher income growth is needed to make it easier for more Americans to save and build wealth.
Zucman favors a higher minimum wage, cheaper access to college education and more family-friendly policies to enable more parents to work. He and his colleague Emmanuel Saez, also an economist at UC Berkeley, helped formulate Sen. Elizabeth Warren’s proposed wealth tax on fortunes above $50 million to help pay for those proposals.
Income growth has lagged partly because for most of the expansion, employers have had a surfeit of workers to choose among when filling jobs, leaving them little pressure to raise pay.
Not until 2016 did the unemployment rate fall below 5%. Average hourly pay finally began to pick up, with the lowest-income workers receiving the fastest average gains.
“Overall, there’s growing inequality,” Elise Gould, an economist at the liberal Economic Policy Institute said, “with signs of hope at the bottom. It’s just taken a very long time.”
This Is the Best Time to Buy a House, According to Experts
Take their advice, and get your dream home for the price you want.
BY ANDRA CHANTIM, Good House Keeping, July 1, 2019
No matter how many times you’ve done it, purchasing a new home can be intimidating, stressful, and of course, incredibly exciting. Before you jump online and start drooling over wraparound porches, come up with a game plan. In addition to the advantages you’ll gain from finding the right realtor and researching your local market, figuring out the best time to buy a house can really pay off, whether that’s in the form of savings or a property in your ideal neighborhood.
For a commitment this big and a price tag this hefty, it’s a smart idea to “figure out your objectives,” says Matt van Winkle, a real estate agent and owner of RE/MAX Northwest. “Do you want to pick from the freshest selection? Are you okay with buying during a competitive time? Is your number one goal to spend the least amount possible?” Determining what you want when it comes to the process of home-buying is just as important as knowing you want four bedrooms and an open floor plan. The answers to these questions can impact when you decide to pour all of your energy into the search. It’s true that the housing market can vary wildly down to the zip code, and the market in one major city, like Los Angeles, won’t necessarily mirror the market in another, like New York City. However, housing experts agree that there are national trends and patterns that can help guide your decision-making. Here’s what they’ve discovered when it comes to timing your house-hunt:
If you want the most choices: Spring and summer
February and March is when you’ll first start to see an uptick in new listings online, says Skylar Olsen, director of economic research for Zillow. Sellers of single-family homes tend to be parents, and they often put their homes on the market in the spring with the goal of moving out before school starts back up. Around the same time, potential buyers are house-hunting, as they prefer to be out and about when the weather is warm, says Nadia Evangelou, a research economist for the National Association of Realtors. The combination of these two factors results in a period of about five months—March through July—when a buyer will have the largest selection of new listings on the market, but the most competition. Olsen sees the largest amount of homes being sold at list price or above during March, April and May, while Evangelou identifies June as the peak month for home-selling activity. But don’t let the prospect of paying full price scare you off. “Yes, you’re more likely to stretch your budget in order to compete with other buyers during the busy season,” says Olsen. “However, you’re also more likely to find the home of your dreams because you shopped when you had the most options available to you.”
If you really want a deal: Winter
Since most prospective buyers would rather casually scroll through online listings in PJs than go open-house hopping in puffy coats, winter is considered the off-season in the real estate world. Sellers strategically wait to list their homes during a period when they will generate the most interest, which is a big reason why there’s less inventory on the market during the colder months. So while you may not be spoiled for choice, you’ll have less competition for the houses that are up for sale at this time, which were either left over from the spring/summer or newly listed for any number of unique reasons. “Owners who list their homes during the off-season may be dealing with a time-sensitive situation (like relocation for a new job) that requires them to sell their properties as soon as possible,” says Olsen. A sense of urgency plus a smaller pool of buyers can equal wiggle room in pricing. But you live in a mild climate region, you say? Check out what’s on the market in November and December. The hectic holiday season is enough to deter people from both selling and buying. “Out of the buyers that I’ve worked with, the ones that negotiated the best deals purchased a home between Thanksgiving and Christmas,” says van Winkle. It’s certainly a hassle to buy and move during the holidays, but you may discover a hidden gem while everyone else is sipping eggnog — and scoop it up for a good price to boot.
The potential sweet spot
In August, you’ll see more price drops than you’d see in the spring or early summer and more inventory than in the winter, according to Olsen. “A lot of these homes are left over from the busiest buying months and sellers need to offer price cuts in order to unload their properties before the season is over,” she says. There are plenty of reasons why some houses sell more quickly than others, but keep in mind that less popular homes are not necessarily lower quality homes. You may find that sellers had listing price expectations that were too high earlier in the season, but they are now willing to negotiate. (Score!).
Other factors you should consider
For homes located in places where the summers are brutally hot or unpleasant, shift this national timeline up a few months. “You’ll see a good amount of new listings in cities like Phoenix, Tampa or Miami during the month of January, which is usually a slow month elsewhere, and less activity in July,” says Olsen. If you live in a state where the weather is consistently nice year-round, you may not notice as large of a discrepancy between the number of sales and home prices when the seasons change, according to Evangelou. Also, some desirable areas are going to be pricey and competitive year-round. “In the Northwest, properties in areas near major job centers, like Seattle, are expensive and have appreciated at higher rates. Unlike in the early 2000’s, people are just not willing to commute as far,” says van Winkle. So despite all the variables, how do you increase your chances of getting everything on your checklist? Start looking the second you know you’re interested in buying. “Keeping your eye on the market month after month will only work in your favor,” says Olsen. “Know what you can afford, know what your limits are, and move quickly when the perfect thing comes along.”
Glen Bell – (510) 333-4460 jazzlines@sbcglobal.net


