


 Facebook
 X
X
 Pinterest
 Copy Link

January 31, 2019 – Real Estate Market Numbers
By Glen Bell (510) 333-4460
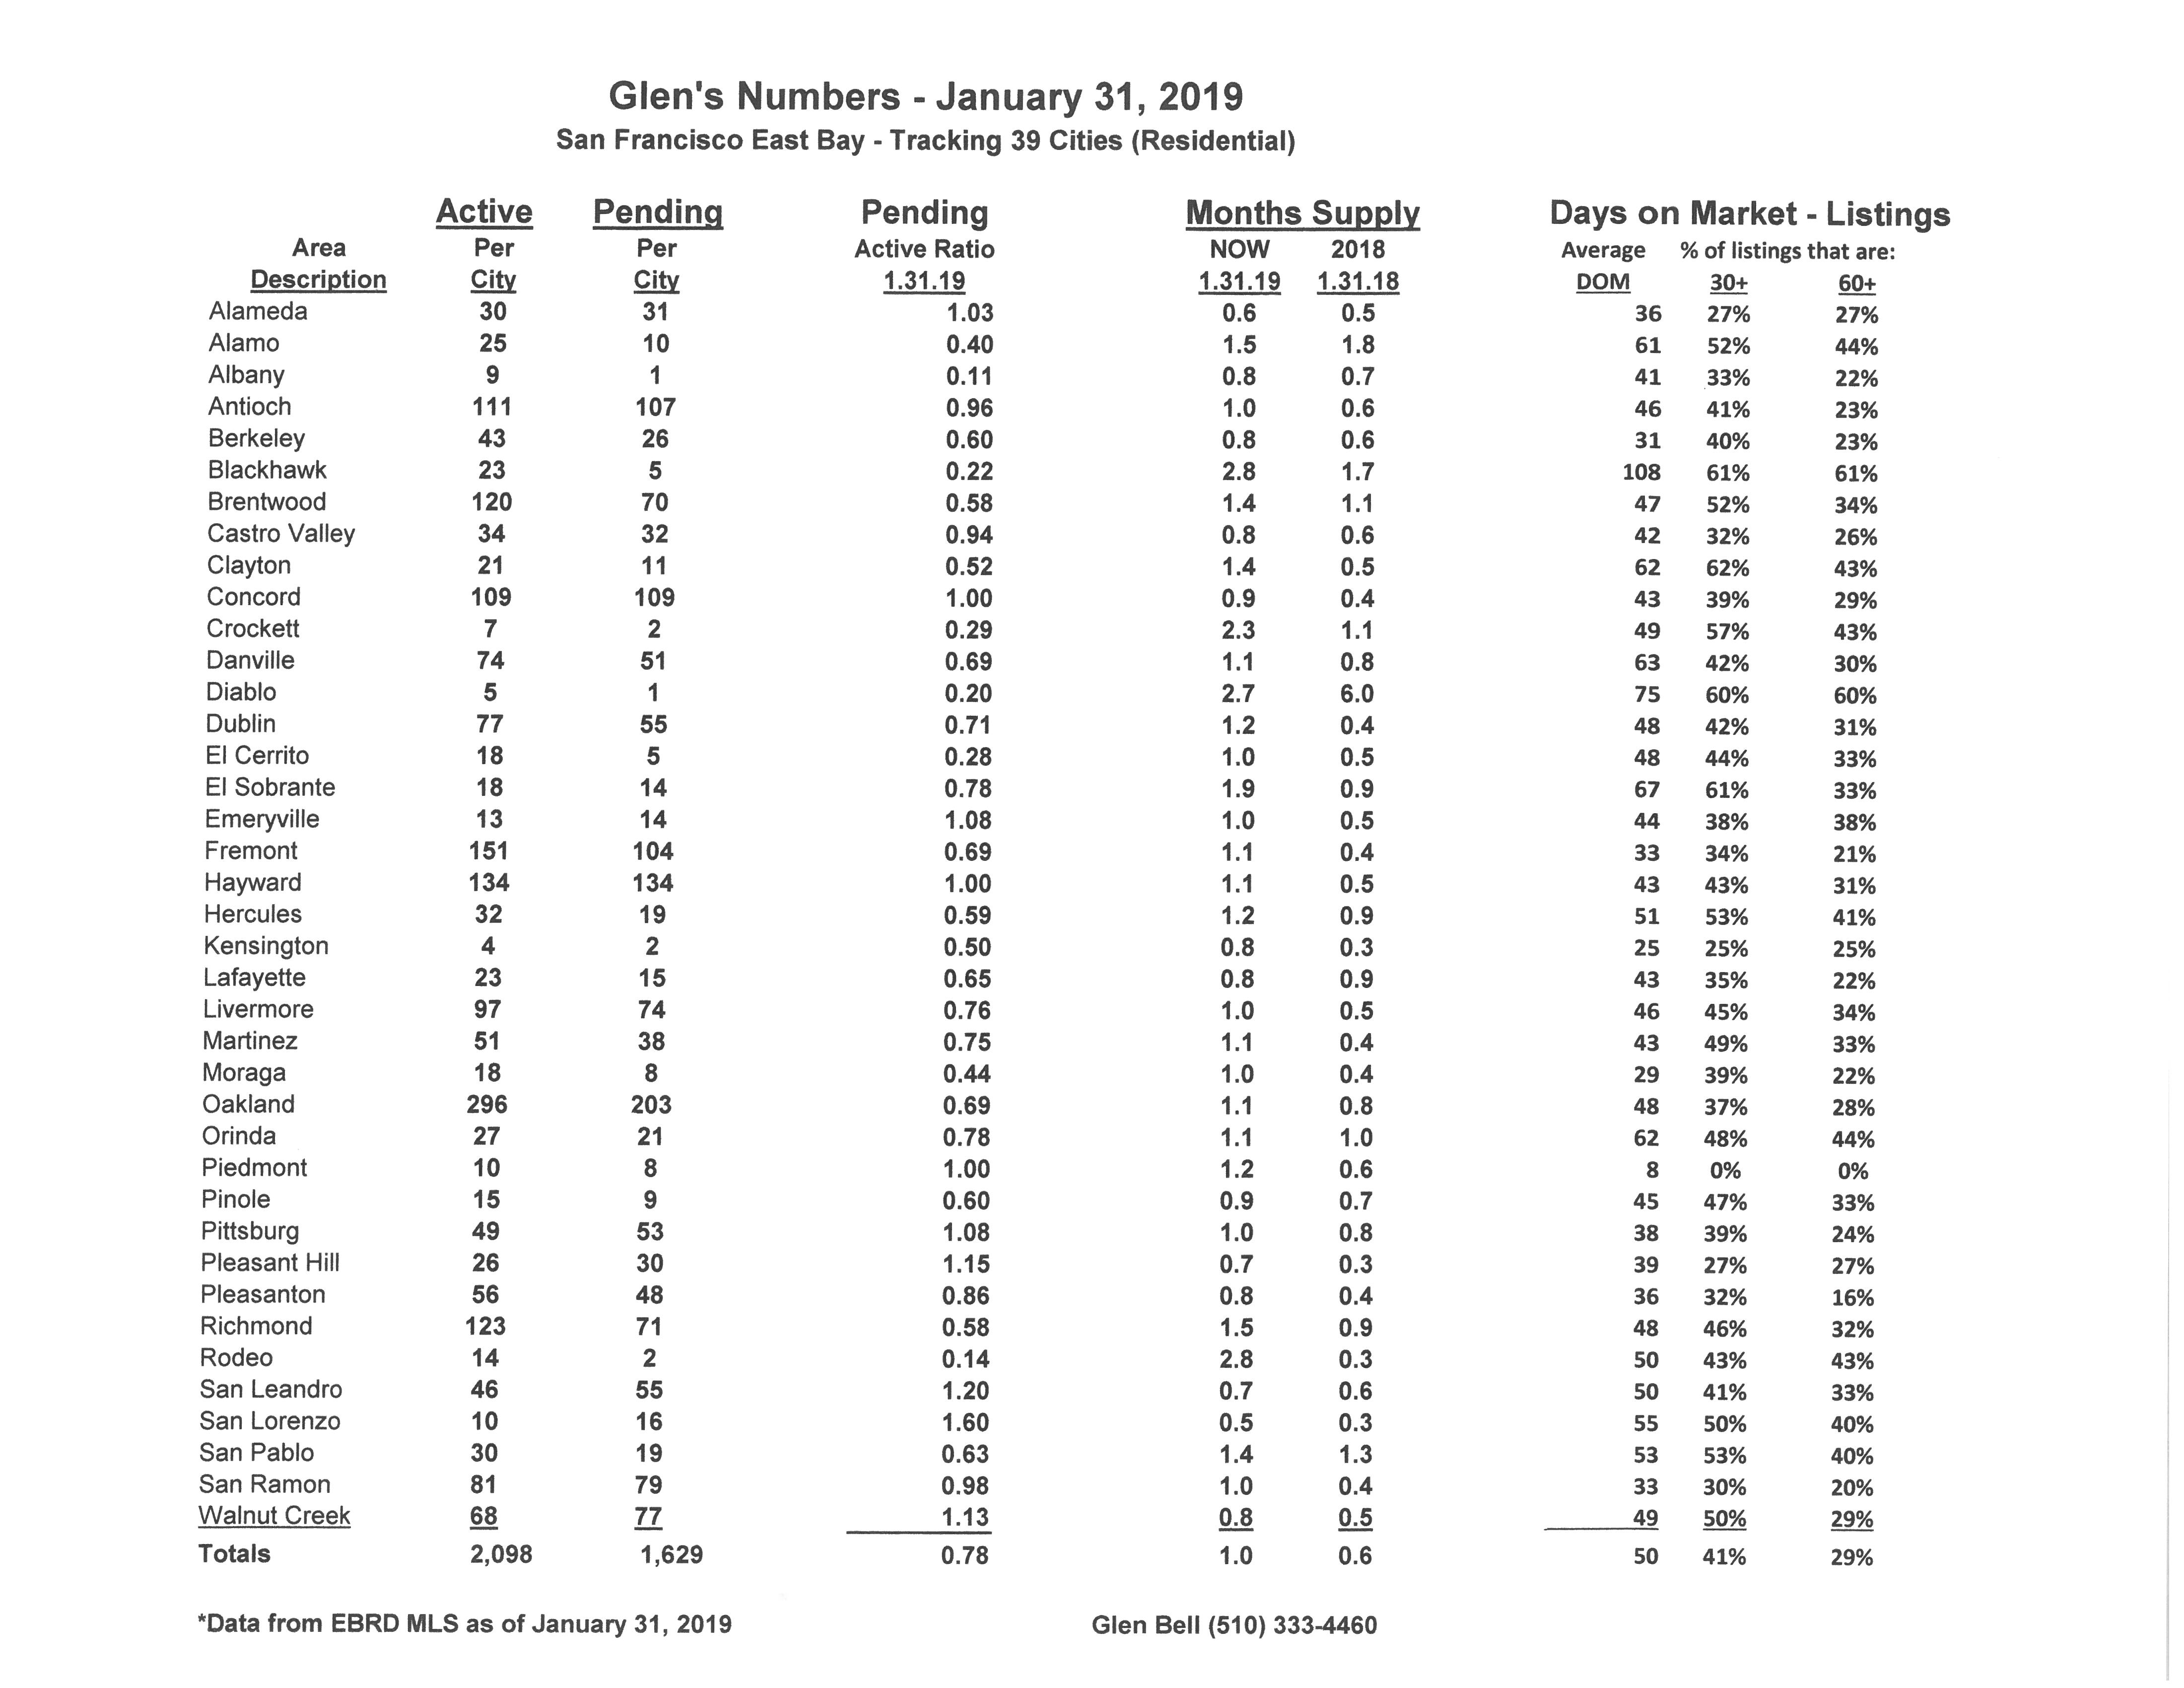
Here are some highlights for the 38 East Bay Cities that I track:
Affordability, rising interest rates, increasing inventory, reduced sales, considerations of moving out of the Bay Area, are all topics of interest in a market in transition. Properties are staying on the market longer, we’re seeing fewer offers than before, more price reductions and some incentives now being offered, in effect, all favoring buyers. Yet indecision has many buyers on the fence with a wait and see attitude despite having more choices.
- Here’s where we stand as of the end of January. Typically, we see a dramatic drop in inventory during December followed by a modest increase in January. Inventory did increase by 18.8%, now sitting at a 30 day supply of homes for sale, (However, much higher in comparison to last year’s January of an 18 day supply). Pendings came down slightly, and are now 6.3% lower compared to last year. The pending/active ratio came down as well to .78, still below our neutral mark. However, our ratio last year at the end of January was 1.38. This is the seventh month in a row that the ratio falls under 1.00. The pending/active ratio has been a benchmark that we’ve used as a measure of supply and demand to determine whether we’re in a buyer’s or a seller’s market. Typically, a number well above 1, (more inventory with fewer pendings) favors sellers as has been the case now for quite some time. A number below 1 favors buyers. In short, we have moved from a strong seller’s market since the beginning of summer towards a more normal and balanced market, and in many cases, now favoring buyers.
- The percentage of homes “sitting” has come down to 41% of the homes listed now remaining active for 30 days or longer, while 29% have stayed on the market for 60 days or longer. This improvement is usually due to the number of New homes that were listed in January.
- It’s hard to predict how much tax reform will play into this but see the article, “Is California facing a tax exodus? Thanks to Trump’s tax law, more may start to flee.” We are seeing interest rates starting to go up. Prices have continued to rise and are only now beginning to flatten out. More and more, affordability, the high cost of living and our traffic woes are coming into play for those, especially in the “middle class,” who may now be considering leaving the Bay Area.
- The “distressed” market, (foreclosures and short sales) are no longer a factor representing less than .05% of the market.
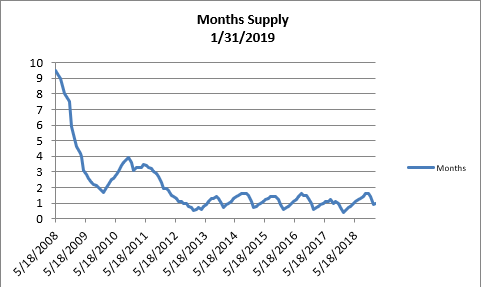
- The month’s supply for the combined 39 city area is 30 days. Historically, a 2 to 3 months’ supply is considered normal in the San Francisco East Bay Area. As you can see from the graph above, this is normally a repetitive pattern over the past four years. We are higher when compared to last year at this time, of 18 days.
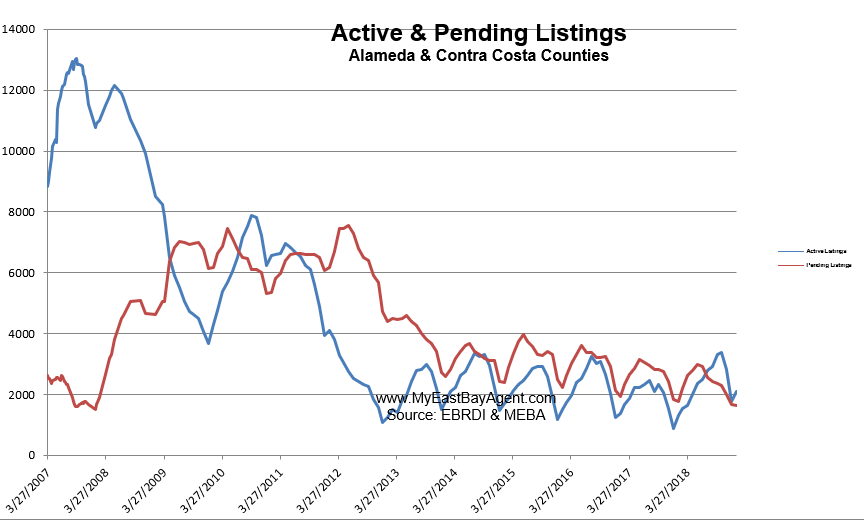
- Our inventory for the East Bay (the 39 cities tracked) is now at 2,098 homes actively for sale. This is higher than last year, at this time, of 1,294 or (62% higher). We’re used to seeing between 3,000 and 6,000 homes in a “normal” market in the San Francisco East Bay Area. Pending sales decreased to 1,629, less than what we saw last year at this time of 1,781, or 6.3% lower.
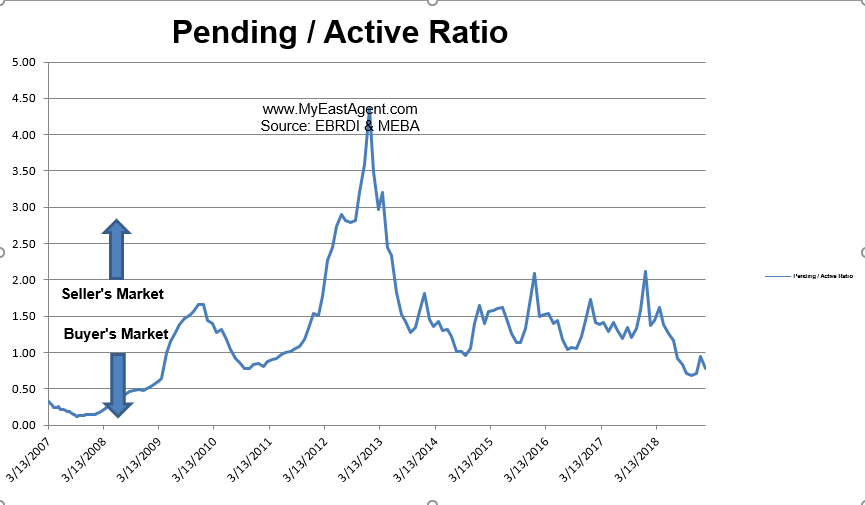
- Our Pending/Active Ratio is .78. Last year at this time it was 1.38.
- Sales over the last 3 months, on average, are 1.2% over the asking price for this area, lower to what we saw last year at this time, 3.6%.

Recent News
As Cooling Kicks In, More List Prices Slashed
By Suzanne De Vita, RISMEDIA, January 31, 2019
Conditions for home sellers are shifting.
According to new realtor.com® research, although gains in home prices are still strong, more listings have had their prices reduced—an indication that multiple-offer scenarios are shrinking, and homebuyers have more options.
Across the country this month, 15 percent of listings had prices reduced, the research shows. Last January, the figure was 13 percent.
Where are cuts happening the most? Thirty-nine, or 78 percent, of the 50 largest markets in the nation had more listings with lowered prices, with Las Vegas leading the way, at 16 percent.
Days on market, or how long a property sits, is speeding up, as well. In January, the average home was on the market for 87 days—two days faster than in Jan. 2018. However, the rate’s slowing; back then, days on market was seven days faster than the prior year.
Comparing the 50 largest markets to the past year, the average listing took one more day to sell, the research shows. Homes in San Jose sat for 27 more days than they did in the past year, the highest increase of the largest markets. In Birmingham, the average home sold 14 days sooner, the biggest leap of the metros.
There was expanded inventory in January, but concentrated in the higher tiers, where demand is not as strong, according to realtor.com’s research. Housing inventory in the $750,000-plus range rose 12 percent year-over-year, while $200,000-level listings sunk 6 percent. Inventory rose significantly in:
- San Jose-Sunnyvale-Santa Clara, Calif. – 128% YoY
- Seattle-Tacoma-Bellevue, Wash. – 91% YoY
- San Francisco-Oakland-Hayward, Calif. – 58% YoY
- San Diego-Carlsbad, Calif. – 46% YoY
- Los Angeles-Long Beach-Anaheim, Calif. – 36% YoY
- Nashville-Davidson-Murfreesboro-Franklin, Tenn. – 36% YoY
- Portland-Vancouver-Hillsboro, Ore.-Wash. – 34% YoY
- Sacramento-Roseville-Arden-Arcade, Calif. – 28% YoY
- Boston-Cambridge-Newton, Mass.-N.H. – 27% YoY
- Dallas-Fort Worth-Arlington, Texas – 25% YoY
“The U.S. housing market is off to a slower start this year in many markets, compared to the rapid acceleration we saw last January,” says Danielle Hale, chief economist at realtor.com. “Although the market is slowing, it’s important to remember that we’re coming off of four straight years of inventory declines that pushed the market to a record low availability of homes for sale.
“The real metric to keep an eye on is entry-level homes, which are the key to getting today’s market back in balance,” Hale says. “These homes are still in short supply.”
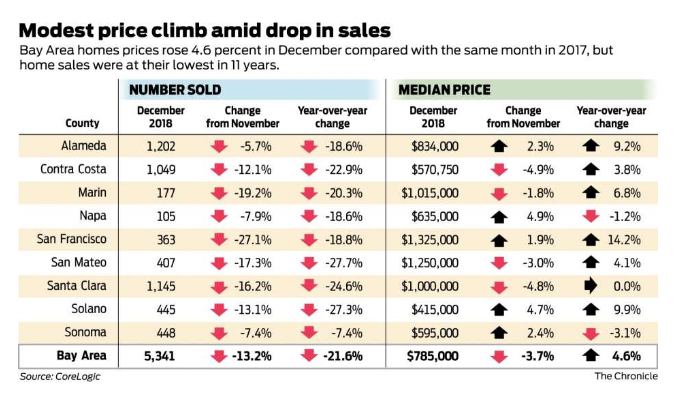
Bay Area home sales drop 21 percent in December
“Would-be buyers remain priced out”
By Adam Brinklow February 1, 2019, 12:59pm PST
Orange County-based data firm Core Logic made yet another startling announcement about the state of the Bay Area’s real estate market Friday, reporting that December 2018 home sales figures dropped more than 21 percent year over year in the region and down nearly 19 percent in San Francisco.
While the results are not necessarily a surprise—Core Logic’s monthly Bay Area home sales’ reports have indicated a decline in home sales year over year for most of 2018—December represented the single biggest drop yet.
Here are some of the highlights:
- December’s dip was particularly dramatic. Across all nine counties, Core Logic records 5,431 sales in December, down from 6,154 the same time the previous year. That’s a 21.6 percent decline, the largest all year.
- The month-to-month sales gap was notably large too. Between November and December of last year, sales dropped 13.2 percent across all nine counties. It’s normal for fewer homes to sell in December, but “since 1988, the average change in San Francisco Bay Area home sales between November and December is a gain of 7.8 percent.”
- Most of 2018 saw year-over-year declines in sales. This was the seventh straight month that Core Logic reported a drop between 2017 and 2018 sales. During that period the decline in July was just 0.5 percent, a very narrow gap compared to other months, which saw drops of anywhere from 8.6 to 21.6—but still a drop nevertheless.
- Prices remain up compared to last year. The latest report estimates that “the median price paid for all homes sold in the San Francisco Bay Area in December 2018 was $785,000.” That’s up from $750,500 the previous year. Note that this figure includes both condos and houses.
- San Francisco’s dip was one of the smallest regionally, but still gasp-inducing. Compared to the same period in 2017, San Francisco sales were down 18.8 percent, from 447 homes sold to 363. That’s almost modest compared to, say, the 27.7 percent decline in San Mateo County, or 27.3 percent in Solano County. But only three counties had a smaller decline than SF, and two of those—Alameda and Napa—barely beat out SF with 18.6 percent drops. Regionally, Sonoma took the smallest year-over-year hit, down 7.4 percent. There were no gains.
Core Logic analyst Andrew LePage said in a press release that “the nearly 22 percent year-over-year drop in activity was the largest for any month in more than eight years.”
LePage suggested a variety of potential explanations, including a seven-year high in mortgage rates and a bum stock market making some potential buyers anxious.
Most significant of all is the suggestion that “some would-be buyers remain priced out or unwilling to buy amid concerns prices have overshot a sustainable level.” Imagine that.
As with past month’s reports, the California Association of Realtor’s (CAR) most recent report mostly corroborates Core Logic’s analysis.
Though CAR reports “only” a 17.5 percent drop across the region, both sources agree that for the most part sales were down consistently year over year for most of 2018.
The big discrepancy between the two reports is in San Francisco, where CAR reports that sales actually increased 11.3 percent in December, the only county to record any net gain.
The disagreement stems from the fact that CAR records only single-family-home sales, while Core Logic also factors in condos—meaning that December’s dip in condo sales proved great enough to overwhelm an apparent (and singular) surge in the sale of larger homes.
Poll: Nearly half of California voters say they can’t afford living in the state
By Joel Shannon, USA TODAy, Feb. 7, 2019
A new poll has found nearly half of California voters believe they can’t afford to live in the state.
The Quinnipiac University poll released Wednesday reports that 43 percent of California voters said they can’t afford to live there. That number was driven by younger voters: 61 percent of voters age 18 to 34 said they can’t afford to live in California.
“For many Californians, life is less than golden in the Golden State,” the release quotes Tim Malloy, assistant director of the poll.
Surging housing prices in California led CALmatters to report that the state was the poorest in the country in 2017. The organization reported then that 20 percent of the state’s population struggled to make ends meet.
In a September 2018 analysis, 24/7 Wall Street listed 12 California cities in a list of the 25 most expensive cities in America.
The most expensive – the San Jose-Sunnyvale-Santa Clara metro area – has a cost of living 27.1 percent higher than the national average, the analysis found. The monthly cost of living for a family of four is $10,758, the analysis found.
A rise in high-paying tech jobs has contributed to a tight housing market and a growing homelessness problem along the West Coast. That has multiple California cities to pass high-profile legislative actions to combat the issue.
San Francisco voters passed a proposition in November to levy a tax on the city’s wealthiest companies and use the money to increase funding for homelessness services. San Francisco ranks among the least affordable cities in the nation, with a median single-family home value approaching $1 million.
This week, the San Diego City Council said the city will stop punishing people for living in their vehicles. It’s a move toward more constructive policies on homelessness, advocates said.
“It’s certainly not a permanent solution to the crisis that we are facing,” City Councilman Mark Kersey told the San Diego Union-Tribune. “But 100 percent of the time, I’d rather have someone sleeping in a car than on the sidewalk.”
Bay Area housing market cools, but it’s still nuts
By Kathleen Pender, SF Chronicle, January 31, 2019
The Bay Area real estate market went into 2018 with a bang and out with a whimper.
In the first half of the year, the median price rose almost 17 percent to an all-time high of $875,000 in June. In the second half, it fell 10.3 percent from that peak, ending at $785,000 in December.
The December price was down 3.7 percent from November but up 4.6 percent from December 2017, according to a report Thursday from research firm CoreLogic. It includes all new and existing homes and condos in the nine Bay Area counties.
An earlier report from the California Association of Realtors — which includes only existing, single-family homes entered into a multiple listing service — said the Bay Area median price fell to $850,000 in December, down 6.1 percent from November and down 3.6 percent from December 2017. That was the first year-over-year drop since March 2012.
Any way you look at it, the market downshifted in the last three months of 2018. As the stock market plunged and mortgage rates rose a half percent to almost 5 percent, buyers backed off, inventory grew, price cuts surged, and price appreciation slowed from the double to single digits on a year-over-year basis.
The number of homes sold in December fell to 5,341 across all nine counties, down 13.2 percent from November and 21.6 percent from December 2017. That was the lowest sales count for a December in 11 years, CoreLogic said.
Many sellers, perhaps unaccustomed to a less-than-ridiculous market, took their homes off the market or let their listings expire. A total of 2,493 listings in the nine Bay Area counties were withdrawn or expired in December, compared with only 1,154 in December 2017 and 1,487 in December 2016, according to analyst Patrick Carlisle of the Compass real estate firm.
“December was rock bottom,” said Chad Eng, a Redfin agent in Silicon Valley. “Buyers are hesitating, on the sidelines. Sellers are still focusing on comps from six months ago.”
Instead of selling in days like they were earlier in the year, homes took weeks or even months to sell. Homes that closed in December had been on the market 29 days before getting into contract. That was up from 23 median days on market in November and 17 in December a year ago, the Realtors association reported.
Eng said things picked up around the middle of January, as the stock market recovered and mortgage rates fell back into the 4.5 percent range. “I wonder if it’s a sign of what we will see in the spring,” or just a normal seasonal rebound, he said.
Santa Clara County was the hottest market in the Bay Area — and most of the country — for the first part of the year as prices rose in the teens and 20s year over year. In February, its median price topped $1 million for the first time, rising to $1,080,000, up 27.8 percent.
That was the month a two-bedroom, one-bathroom, 848-square-foot home on Plymouth Street in Sunnyvale sold for $2 million cash — making headlines as the height of Silicon Valley insanity.
That was and still is a record price-per-square-foot for Sunnyvale, said Doug Larson, a Coldwell Banker agent, who represented the seller. “Now with the softening market, I doubt that anybody will beat it, at least for a while,” he said.
After hitting $1.15 million in June, Santa Clara’s median price has fallen to $1 million in December, exactly where it was a year ago.
January is always a slow month for the real estate market, as sellers recover from the holidays and get their homes spruced up for the busy spring season.
“Homes that sell in the winter are typically homes that have been sitting on the market awhile and have to take a price cut,” said Redfin Chief Economist Daryl Fairweather.
Right now, “buyers are in a holding pattern,” she added. “They don’t know if this is as good as it’s going to get, if prices come down or more homes come on the market.”
She noted that a slower market is good for buyers because “they have more negotiating power” and for sellers who are moving up to a more expensive home because “overall they are going to be saving more money.”
Fairweather predicts that prices will end the year about where they are now. “I would be surprised if they go down,” she said.
Nancie Allen, president of Bay East Association of Realtors, said the government shutdown in January made it hard to tell where the market is headed. The next two weeks will be a better indicator. The market now “is all over the place,” she said. Some homes in Fremont have been sitting on the market for a while, while one had 15 offers.
Aaron Terrazas, a senior economist with Zillow, said his data show that home prices in the last quarter of 2018 rose at their slowest annual pace for any quarter since 2010.
He predicts that prices will appreciate 5 to 6 percent this year in the San Francisco metro area and 7 to 8 percent in the San Jose metro area, assuming interest rates stay low.
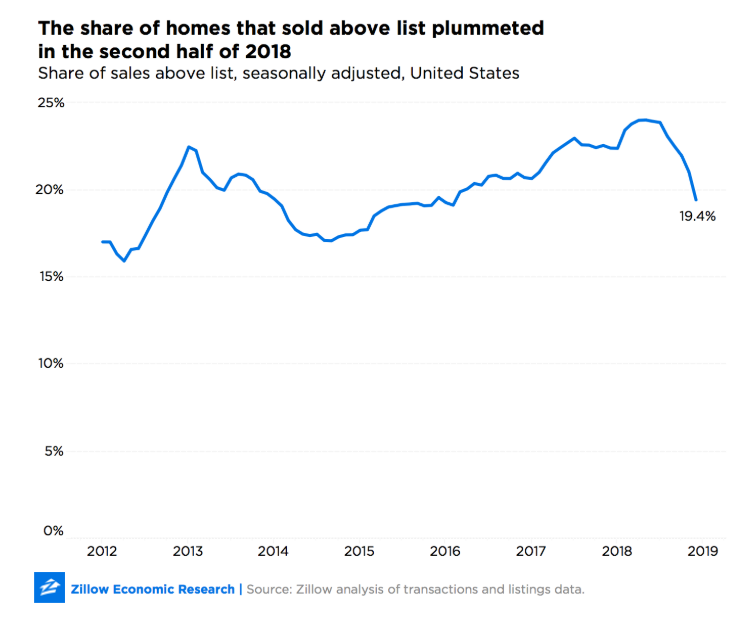
Share of Homes Selling Above List Price Plummets
By Treh Manhertz, Zillow, on Feb. 1, 2019
After years of progressively more homes selling above their listed price, the share of homes that sold above list plummeted in the second half of 2018.
As of December, 19.4 percent of homes were sold above their list price, the lowest share of above-list sales in almost three years. December marked the seventh straight month in which this rate dropped, after the share of homes selling above list reached 24 percent in May 2018 — the highest share since the onset of the housing market recovery.
The high peak and subsequent fall signify changing trends that occurred across the national housing market in 2018. When many homes are selling above their list price, it can indicate other housing trends:
- First, it can show that inventory is limited, that too few homes are available to accommodate all the buyers in the market. The scarcity pushes more buyers to submit bids over the listed price of the home to edge out competing offers.
- The rush to buy can be exacerbated by low mortgage interest rates, like the historically low rates of the past several years. Buyers are able to accommodate larger mortgages while monthly payments remain affordable.
Both of these factors shifted in late 2018. Mortgage rates reached above 4.9 percent in November, the highest level since 2011, causing some buyers to be more conservative in their bidding. The last months of 2018 also saw the first inventory gains in three years, alleviating some of the competitive pressure on buyers.
The converse of this is that sellers’ expectations of what their homes will sell for are undershooting reality. Sellers generally want to price as high as is reasonable, unless they want to sell especially quickly. More homes selling above list means sellers aren’t reaching as high as they could. In some hot markets, a decrease in the number of homes sold above list could simply mean that sellers’ expectations are finally catching up with the reality of the market.
Not only did the share of homes that sold above list fall, the average price above list dropped too. Among homes sold above list, the typical amount above list has remained above $6,000 for the last several years. As of December, the median amount had dropped to $5,860, while the median discount for homes selling below list held steady. This narrowing suggests buyers and sellers are syncing up on their price expectations.
The share of homes sold above list nationally has moved within the range of 15 percent and 25 percent since at least 2012. But, while national trends in home sales have been strong and limited in fluctuation, separate metropolitan areas have highly individual sales patterns. In some metro areas, homes sell above list with much higher frequency and with very little variation. Dallas, for example, has stayed stable at more than 35 percent of homes selling above list since 2012. Salt Lake City has rarely dropped below 50 percent of homes bid up. In other metros like Tampa and Pittsburgh, this is much more of a rarity, with the share hardly ever exceeding 15 percent.
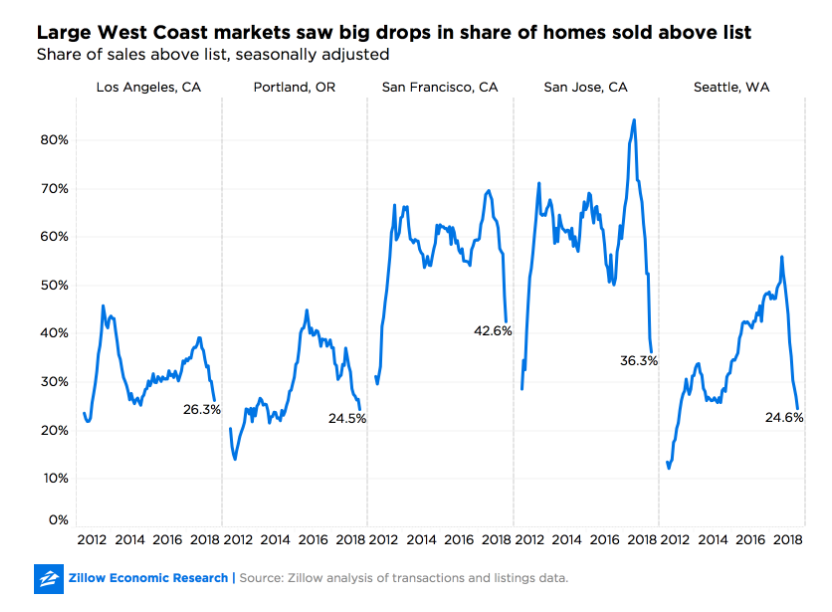
Large West Coast metros led the drop in homes bid up nationally – another sign that these exceedingly hot markets are cooling. All major West Coast metros had large year-over-year dips in December, the largest in San Jose, Calif., San Francisco and Seattle, where huge swaths of the market shifted to selling at or below list price. San Jose fell 46.6 percentage points (from 82.9 percent to 36.3 percent), San Francisco fell 26.7 points (from 69.3 percent to 42.6 percent) and Seattle fell 25.7 points (from 50.3 percent to 24.6 percent).
Many other metros stayed stable, and a few even went the opposite direction from national trends. Four of the largest 35 metros had increases in the share of homes that sold above list in the second half of 2018: San Antonio, Houston, Philadelphia, and Kansas City. San Antonio and Houston gained more than 3 percentage points each in the last six months, despite increasing home inventory. San Antonio is demonstrating strong demand commensurate to its rapidly growing population – Bexar County is in the nation’s top 10 fastest growing counties. Houston’s economy is closely tied to the oil industry. Because of that, it is possible sellers did not seek as high a price due to falling oil prices, expecting a slowdown in housing demand that did not manifest.
Ending 2018, homes are still selling quickly. The median time on the market was 78 days, 3 days shorter than last year and 20 days shorter than five years ago. So while the seller’s market appears to be waning, it’s certainly not over, and this is not a result of weak demand. Homes are more likely to sell at the listed price as a result of convergence in the market expectations of buyers and sellers.
Stop deepening Bay Area transportation, housing crisis
By Daniel Borenstein, CC Times, January 29,2019
Tired of subsidizing irresponsible billionaires? Here’s a plan to provide more housing in the right places
Here’s an idea to address the Bay Area’s transportation and housing crisis: Stop making it worse.
Since the Great Recession, the Bay Area has added 722,000 jobs but constructed only 106,000 housing units.
Little wonder rents and home prices have soared – and even people with jobs live in cars or on the streets. Little wonder freeways are gridlocked and commuter trains are packed.
It’s time to stop digging this housing deficit hole deeper. We need more housing. But we need it in the right places.
Bay Area cities with housing shortfalls – San Francisco, Cupertino, Menlo Park and Palo Alto, for example – should stop adding more buildings for jobs unless they provide commensurate new housing.
Conversely, areas with serious job deficits – East Contra Costa is the poster child – should be barred from adding new housing without new places for residents to work.
Here’s the fundamental problem: San Francisco and most of Silicon Valley generally have more jobs than workers living there. The East Bay has more workers than jobs.
Consequently, our freeways and public transit systems overflow in the morning with commuters headed toward San Francisco and Silicon Valley. In the evening, the crush runs in the opposite direction.
And the intra-county imbalance between jobs and housing exacerbates the gridlock. For example, in Santa Clara County, while Palo Alto imports workers every morning, San Jose exports them.
We keep raising taxes to increase commute capacity, but long-term that’s an exorbitantly costly fool’s errand – especially when we ignore underutilized capacity in the counter-commute direction. We are only making the situation worse.
The key is to put jobs next to housing and housing next to jobs.
That won’t happen on its own. Our convoluted property and sales tax systems discourage housing construction. So, this will require action by the Legislature and Gov. Gavin Newsom.
What’s needed are rules that prohibit cities with housing deficits from approving commercial and office buildings unless they also approve new housing for employees who would work in those buildings.
And in cities with severe job deficits, the rules should be reversed. Residential development approvals should require construction of commensurate facilities for jobs.
Before business leaders, especially from tech companies, and local politicians howl about killing economic growth and impinging on local control, they should admit that they’re a big part of the problem.
They should recognize that current unaffordable housing prices and ridiculous commutes already threaten to undermine the long-term success of the region.
And they should acknowledge the obvious, that companies keep expanding – and local governments keep letting them – without meaningful regard for providing adequate housing.
For example, Cupertino, even before the opening of the massive new Apple campus, had 1.5 jobs for every member of the labor force who lives in the city, according to 2016 U.S. Census data compiled by the Metropolitan Transportation Commission. Palo Alto had 2.8 jobs per worker; Santa Clara and Mountain View had about 1.7 jobs per worker; and San Francisco had 1.3.
Conversely, in the South Bay, San Jose, with a 0.8 ratio of jobs to workers, needs more employers. In the East Bay, the same goes for Oakland, at just below 0.9 – that’s nine jobs for every 10 residents in the workforce.
And, in East Contra Costa County, the cities of Pittsburg, Antioch, Oakley and Brentwood should be prohibited from approving more housing. They have a combined ratio of 0.4 – just four jobs for every 10 residents in the workforce.
It’s absurd. For more than four decades, leaders of those four cities, backed by politically powerful developers, have tried to convince voters that if they keep building residential homes the jobs would follow. It’s not going to happen.
As for cities with job surpluses, state mandates requiring commensurate housing would force employers wanting new space to partner with housing developers to ensure homes are built. Or, better yet, those employers might opt to locate where workers already live.
Either way it would ease future stress on our transportation systems – and environment. As a taxpayer, I’m tired of paying for more road and transit expansions to meet the needs of multi-billion-dollar companies that refuse to do the responsible thing.
Some caveats to the housing mandate: The affordability of the required housing should be matched to likely jobs that would fill the new offices and commercial centers. And, to encourage public transit use, the mandates might include leeway for homes or business construction near commuter rail stations or existing major bus corridors.
Local and state leaders understand the Bay Area faces a housing crisis. Unfortunately, solutions under discussion are incremental steps that don’t address the fundamental problem: Not only have we failed to build enough housing, we’ve also failed to put it near jobs. It’s time to fix that.
The Bay is rising. Where does that leave a wave of big waterfront projects?
By Blanca Torres – San Francisco Business Times, Jan 24, 2019,
Water defines the Bay Area, even its name. For most if its history, though, much of the bayfront was closed off to residents. In the 1960s, only about four miles of the 400 to 500 miles of shoreline was accessible.
Today, the bayfront looks far different and another wave of change is coming. A slew of small and large development projects promise to bring tens of thousands of new homes, millions of square feet of commercial space, and hundreds of acres of public parks, trails and open space to the Bay Area’s waterfront.
Across the region, developers plan to pump billions of dollars into high-profile waterfront projects that include Brooklyn Basin, Oakland’s largest housing development; the Chase Center professional basketball stadium in San Francisco; the revival of Pier 70 in San Francisco’s Dogpatch; and the 42-acre master-planned Hercules Bayfront community with more than 1,500 homes planned and 200,000 square feet of commercial space.
But all these projects come just as developers, public officials, planners, architects and engineers urgently confront a looming threat: rising sea levels. With the Bay expected to rise up to 10 feet in the next eighty years, it might seem foolish or dangerous to plant so much development right along the water’s edge.
“We can ignore sea-level rise until it is way more costly or we can starting thinking about adapting to and anticipating it now,” said Amanda Brown-Stevens, who runs Resilient By Design, an organization that studies and advocates for sea-level rise solutions in the Bay Area. The organization conducted a year-long competition to spur ideas and proposals for waterfront developments that address rising water levels.
With the right planning, project designs and innovative construction, new developments can not only survive the effects of climate change, but in some cases, can help protect the region from flooding and erosion.
“There is a win-win in what is an overall gloomy topic,” Brown-Stevens said. “We can reconnect the Bay Area with the waterfront — it’s a great amenity — if we do it in a way that creates more green spaces and development opportunities to live and work in the existing urban areas and reduce sprawl.”
The threat
A 2018 state report on sea-level rise estimates that waters will rise 1.1 to 2.7 feet by 2050 and between 2.4 and 10.2 feet by 2100. The range depends on factors such as how sharply greenhouse gas emissions are curbed over the next several decades.
Water levels also fluctuate based on weather, storms and king tides, unusually high tides that periodically crest.
“People think of sea-level rise as a problem that’s going to grow and grow over the next century, but we’re dealing with it now. We’ve had flooding with recent storms,” said Michael Martin, director of real estate and development for the Port of San Francisco. “When you have a built environment on the water, these are issues we have to deal with on a day-to-day basis.”
As a general rule, developers and project planners use the benchmark of 2 feet of sea-level rise by 2050 and 6 feet by 2100 to plan their projects based on state guidelines, said Richard Kennedy, a senior principal at architecture and planning firm James Corner Field Operations. He is working on projects including the 28-acre Pier 70.
“We find that the clients, the developers, public agencies, we are all aware of the issue, but much of the public is not, so much of our work is communicating the threat and risk,” Kennedy said. “In some ways, (sea-level rise) is not frightening enough. If there is not enough fear or concern to provoke action, we might be in a situation of not acting fast enough.”
Last fall, San Francisco voters approved Proposition A, which will raise $425 million to pay for repairs for a concrete seawall that runs along the Embarcadero. That money is just a start — the total cost of repairing the 3-mile-plus seawall is $5 billion. And that just protects one section of San Francisco.
Water isn’t just rising in the bay. Groundwater levels are also rising and causing more flooding in low-lying areas such as BART stations, waterfront roadways and the Oakland Coliseum, Brown-Stevens said. Walls and levies can’t help with mitigating those issues.
“We have a hard time even investing in our current infrastructure needs let alone thinking about how can we rebuild it in a way that is adaptable to climate change,” she said.
Double Trouble: rising water and sinking land
At the same time seas are starting to rise, some of the Bay Area is sinking. Scientists from the University of California, Berkeley, and Arizona State University published a study last year on “subsidence,” which refers to land that is sinking. The study identified areas such as Treasure Island and Foster City where land levels are going down. Those sites and many others along the bay shoreline were originally part of the bay that was later filled in to create more land. Infill in general is not as stable as natural land and is also prone to liquefaction during earthquakes.
Return to the water
Starting in the 19th century, much of the region’s waterfront was devoted to industrial uses and highways, said Sandy Mendler, principal with architecture firm Mithun, who participated in the Resilient by Design challenge.
“Homes were cut off from the waterfront, and you couldn’t access the bay or see it except from driving,” she said. “The shift toward development near the water, it seems like a natural progression that will only accelerate. There are not many big sites in other places, and there is still demand for places to live and quality of life.”
Waterfront projects pose more challenges and costs than building on other sites, but they are worth the trouble, said Mike Ghielmetti, head of Signature Development. The company spearheaded Brooklyn Basin, a master-planned community in Oakland slated for 3,700 homes along with a new marina, retail space and 30 acres of open space.
“People want to live closer to transit and existing infrastructure,” he said. “Just because we don’t know exactly what’s going to happen, we can’t stop developing. We have a severe housing shortage in the Bay Area.”
Enjoying the water — the views, water sports or hiking — is part of the Bay Area’s culture and allure, said Lou Vasquez, founder and head of Build. His firm is developing India Basin, a 1,500-home development on San Francisco’s southern waterfront.
“You don’t feel the urban crowd that you feel in other neighborhoods,” he said.
Being close to the water also opens up more transit options for prospective residents such as using water taxis or ferries to commute.
The solutions
The first homes in Brooklyn Basin will open later this year after nearly two decades of planning. The project was the first major development that had to address sea-level rise to secure city and regional approvals, Ghielmetti said.
One of the key strategies at Brooklyn Basin was to truck in dirt to raise the site by three feet, a common solution at various Bay Area developments.
The same method is being used on Treasure Island, where developers Lennar and Wilson Meany are preparing sites for 8,000 new homes, 500 hotel rooms, 300 acres of parks and open space, 140,000 square feet of retail and 100,000 square feet of office space to be built over the next 20 years at a cost close to $5 billion.
On Treasure Island, a man-made island in the middle of the Bay, the developers also situated much of the new construction away from the shoreline.
Other projects such as India Basin and Pier 70, both on San Francisco’s southern waterfront, are also using terraced designs with homes perched on sites that already sit significantly higher than the water.
“No one wants to build something that will be obsolete in 10 years,” Vasquez said. “We’re all building with a 100-year horizon…. (Sea-level rise) is more of a problem for existing buildings than for new construction. We can pull back from the shoreline and build to a higher level.”
Plans for Pier 70 call for 2,150 new homes, 1.75 million square feet of commercial office and up to 445,000 square feet of retail, light industrial and arts space. The total cost of the project, including infrastructure and public benefits, is estimated at around $2 billion.
The project incorporates historic finger piers, renovation of historic buildings and construction of new buildings.
Pier 70’s approach is three-fold: elevate, set back and buffer, said Jack Sylvan, senior vice president of development for Brookfield Properties, the master developer of Pier 70.
The developer will elevate the entire site by five to 10 feet. Buildings will sit at least 100 feet from the water’s edge. That gives the developer space to add retaining walls or levies in the future if necessary.
The goal for the project’s design “is to maximize public access today, while designing a shoreline that can adapt and retreat over time,” Sylvan said
Back to nature
Another way to address sea-level rise is via wetlands and marshes, known as a horizontal levy or a more back-to-nature approach.
In 1849, the San Francisco Bay spread out over 787 square miles, according to the Bay Conservation and Development Commission, a regional agency that regulates waterfront development and restoration. Today, after decades of filling in the water to create more land, the bay is only 550 square miles. Much of what was filled in were wetlands and marshes that helped control flooding. Also, many creeks and waterways were paved over, limiting the natural water flow.
“If you have more wetlands, they can absorb some of the water so it reduces your need for a higher levy or wall protection,” Brown-Stevens said.
How and when the water will rise is uncertain, which means all the planning and work developers are doing now could be insufficient.
“You have to have flexibility,” Ghielmetti said. “We did meet the guidelines of that BCDC adopted for climate change and sea-level rise. We can also adapt if it’s worse.”
Brooklyn Basin and Pier 70 both have a financing mechanism in place to direct future tax revenue to pay the costs of future sea-level rise.
“On the one hand, sea-level rise is a technical challenge, on the other hand, it’s a creative one,” Kennedy, the architect, said. “There is no one solution … Continuing to look for creative solutions is absolutely critical.”
Chinese Exiting U.S. Real Estate as Beijing Directs Money Back to Shore Up Economy
Third-straight quarter Chinese investors sold more commercial U.S. property than they bought
By Esther Fung, Wall Street Journal, Jan. 29, 2019
Chinese net purchases of U.S. commercial real estate last year dwindled to their lowest level since 2012, as Beijing kept up the pressure on Chinese investors to bring cash home during a period of worsening economic growth.
Insurers, conglomerates and other investors from mainland China were net sellers of $854 million of U.S. commercial property in the fourth quarter, according to Real Capital Analytics. That marked the third-straight quarter Chinese investors sold more U.S. property than they bought, the first time ever these investors have been sellers for that long a stretch.
The selling during most of 2018 marked a powerful reversal from the previous five years, when Chinese investors went on a massive buying spree, often handily outbidding other investors for U.S. trophy properties. They spent tens of billions dollars on luxury hotels like the landmark Waldorf Astoria in New York, a nearly $1 billion skyscraper development in Chicago, and a glitzy residential project in Beverly Hills, Calif.
Now, many of China’s biggest overseas real-estate investors are unloading some of the same prized assets, or at least reducing their U.S. exposure by selling stakes to new partners.
The turnabout last year reflects an effort by the Chinese government to stabilize its currency, reduce corporate debt, and help arrest the country’s economic slowdown by clamping down on certain overseas investments. Some Chinese developers, now facing tighter credit conditions at home, have tried to raise money instead by selling some of their U.S. properties.
Glen Bell – (510) 333-4460 jazzlines@sbcglobal.net


