
May 31, 2019 – Real Estate Market Numbers
By Glen Bell (510) 333-4460
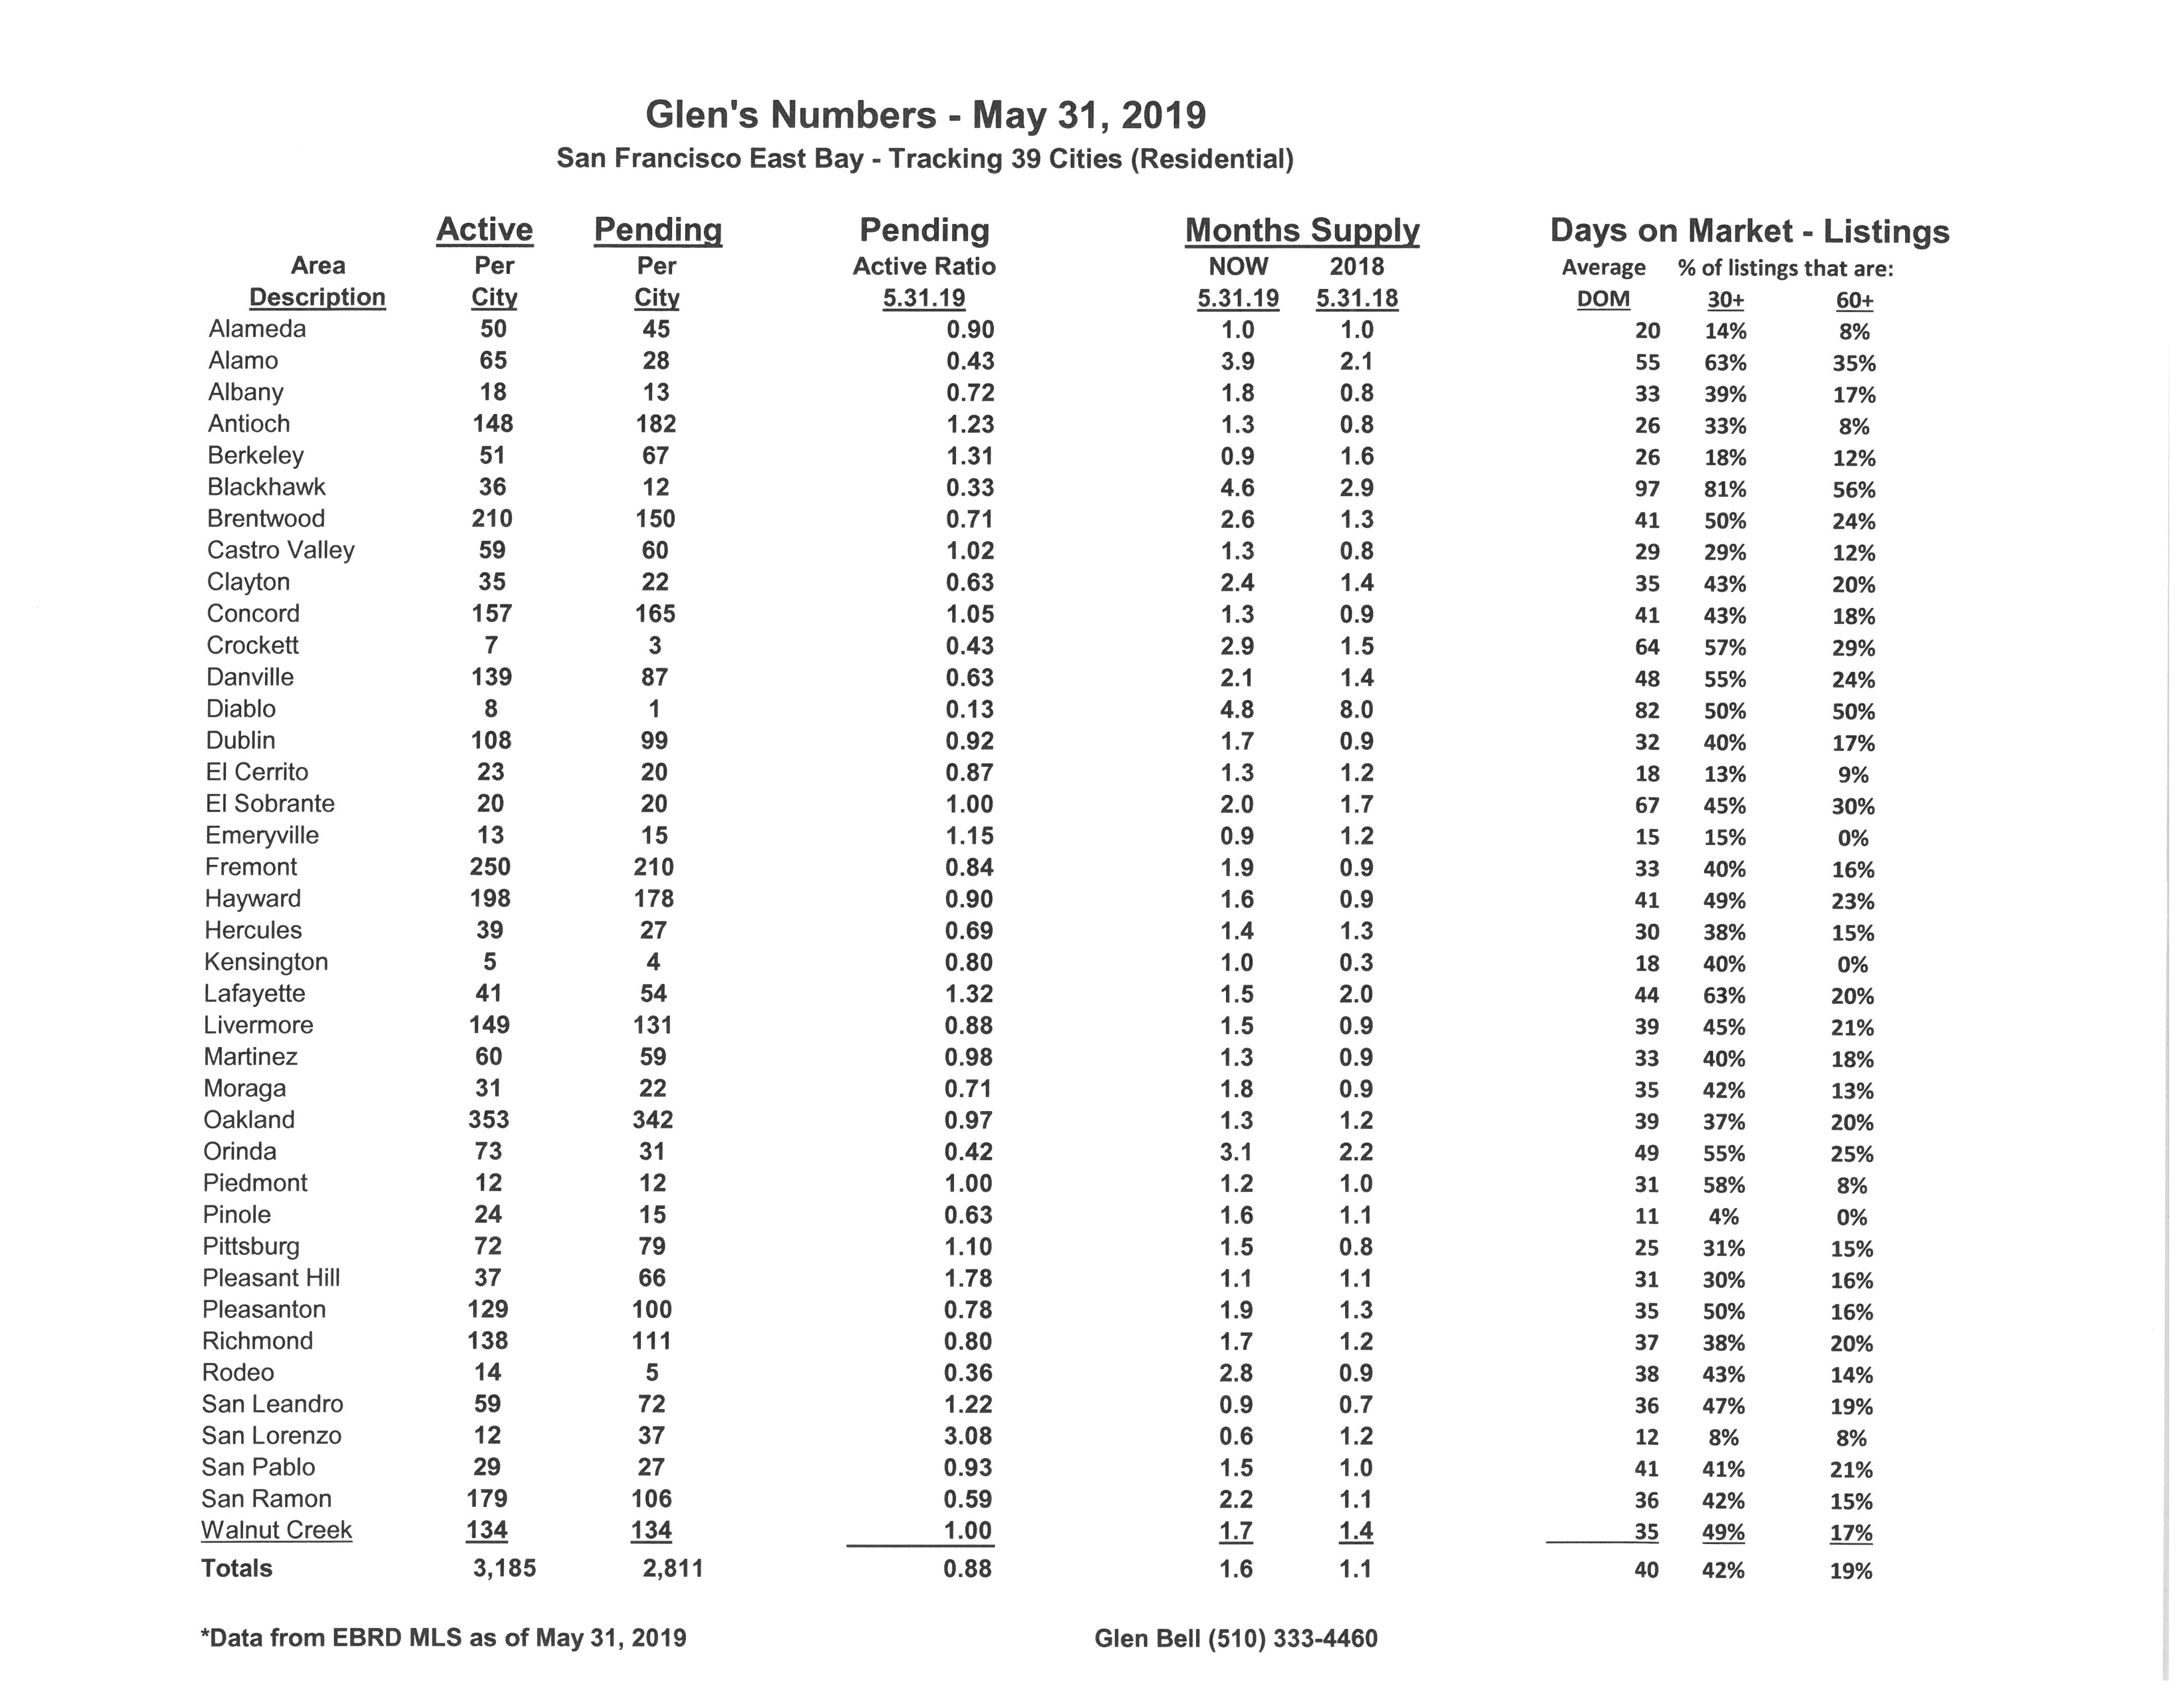
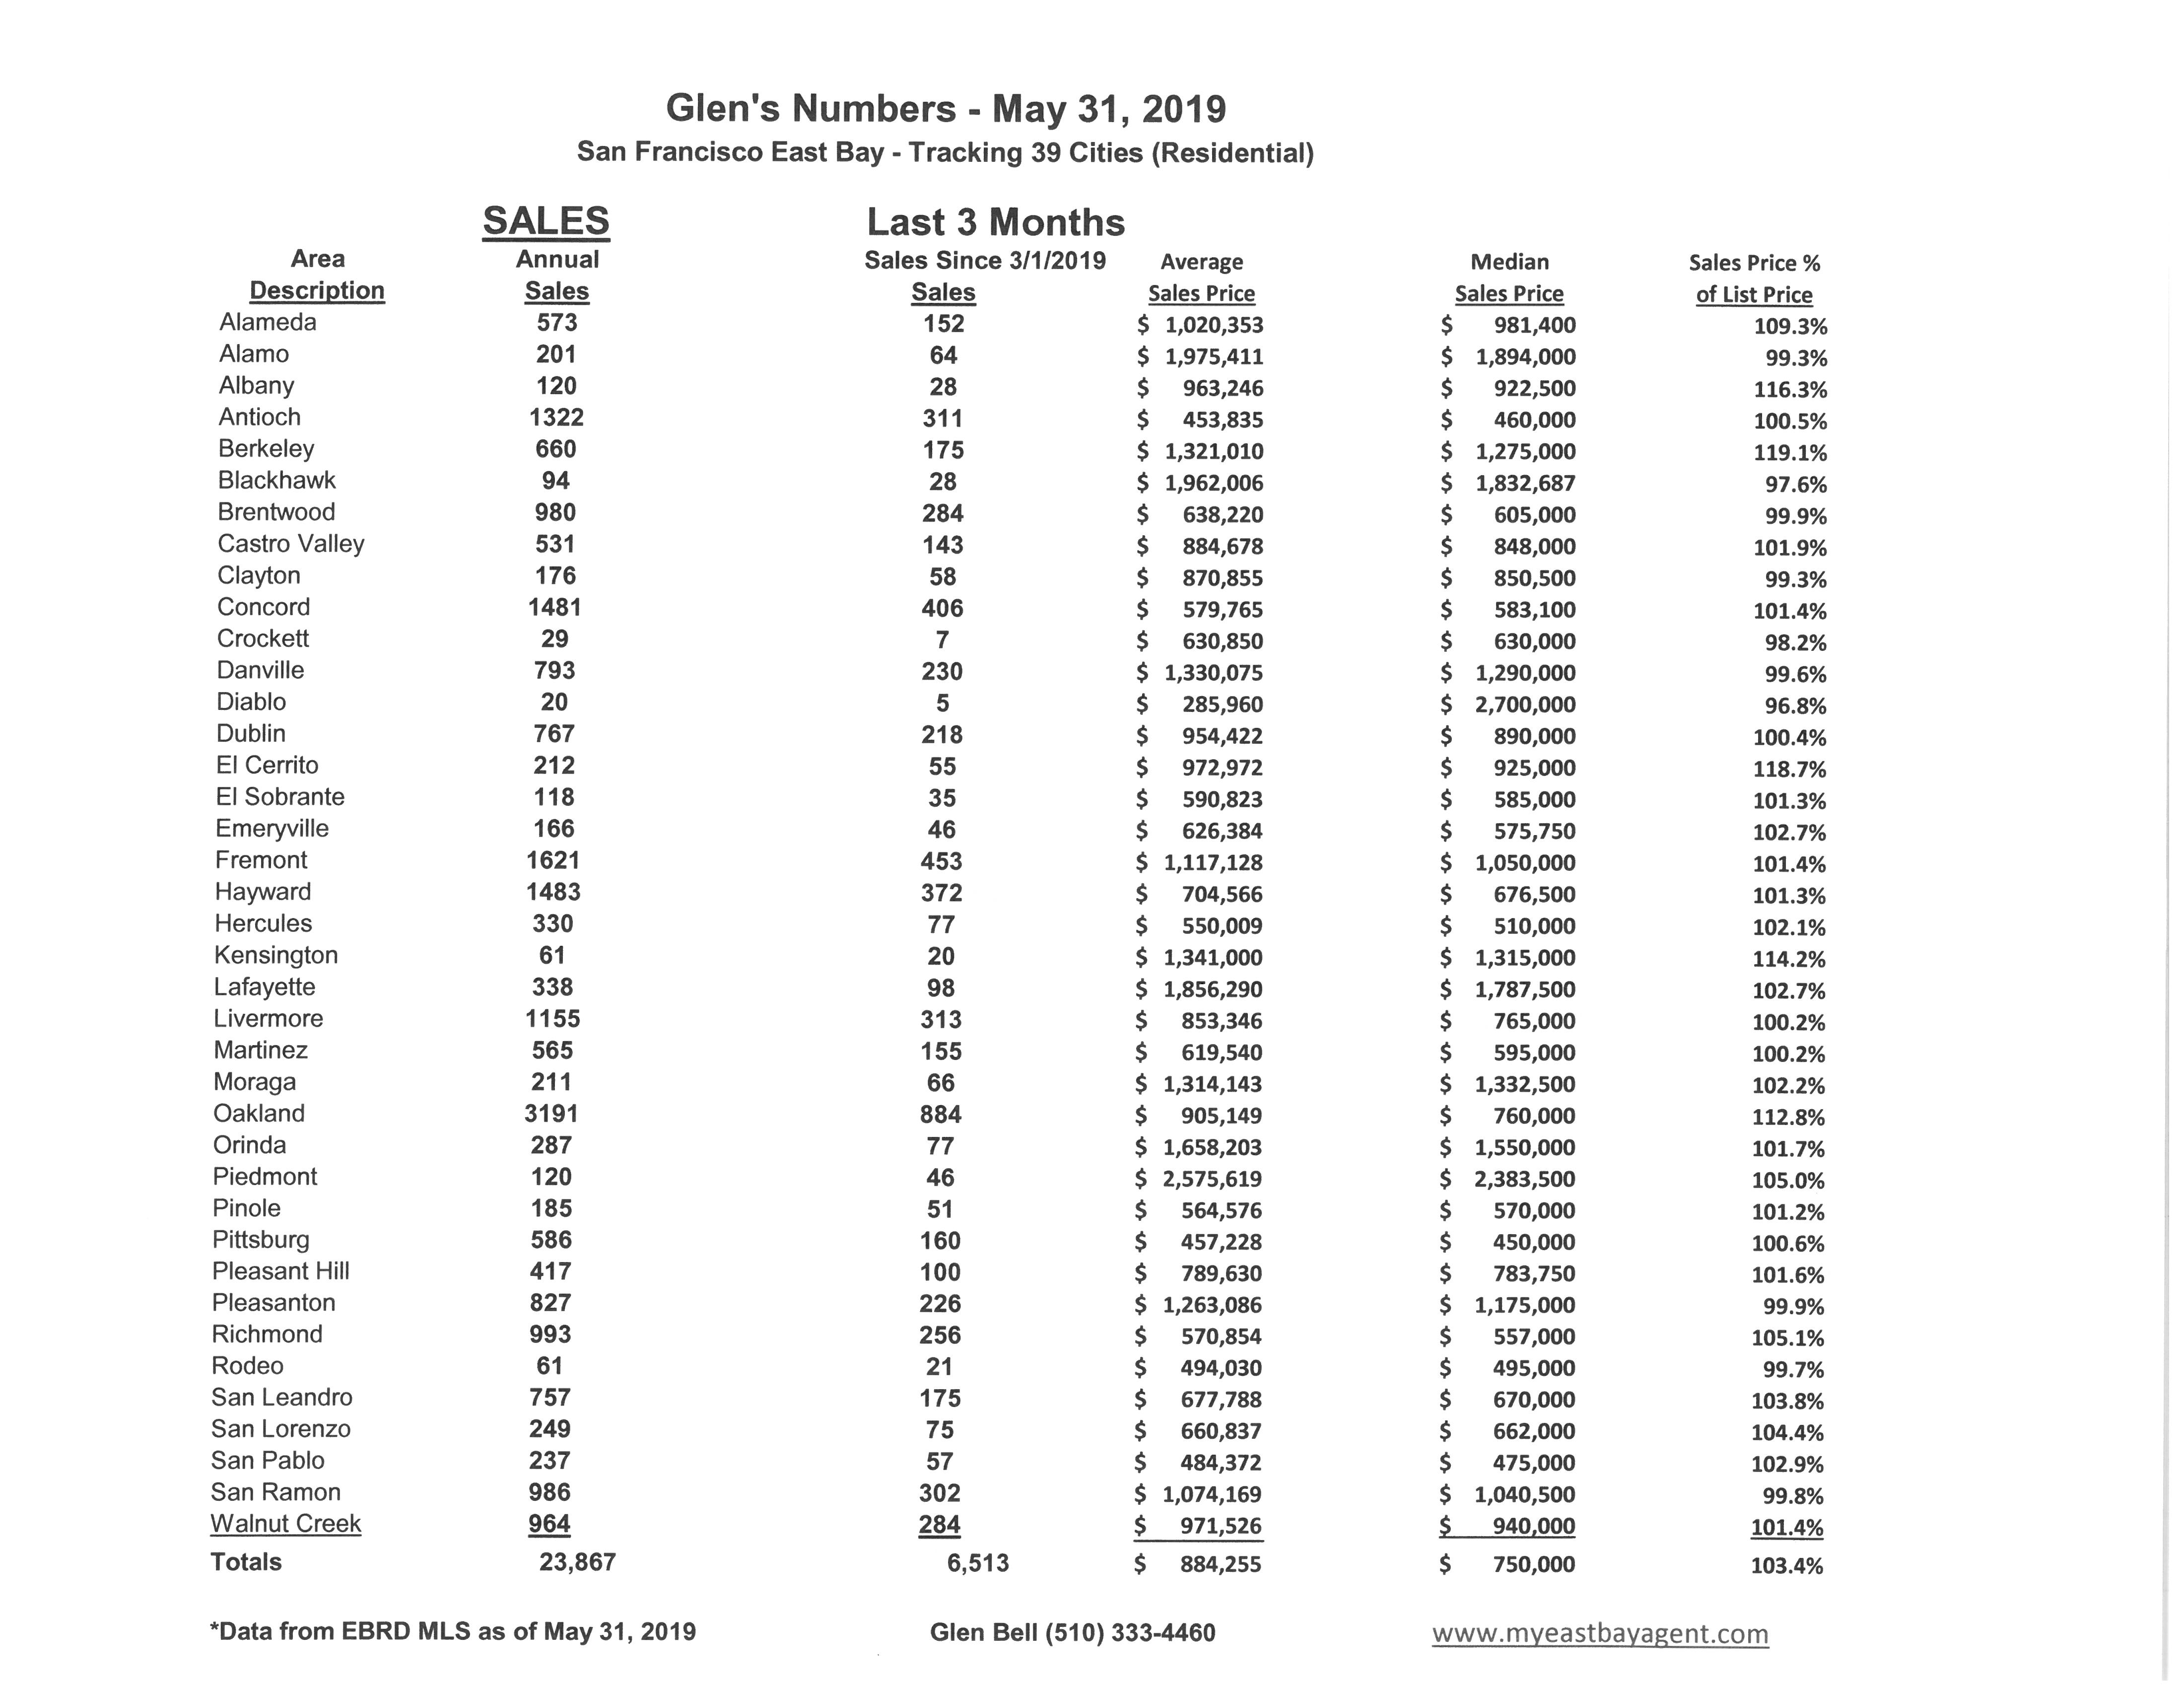
Here are some highlights for the 38 East Bay Cities that I track:
Affordability, increasing inventory, reduced sales, considerations of moving out of the Bay Area, are all topics of interest in a market in transition. Properties are staying on the market longer, we’re seeing fewer offers than before, more price reductions and some incentives now being offered, in effect, all favoring buyers. Yet indecision has many buyers on the fence with a wait and see attitude despite having more choices.
- Here’s where we stand as of the end of May. Typically, we see a dramatic drop in inventory during December followed by a modest steady increase in Spring and Summer. Inventory has increased by 80%, now sitting at a 48 day supply of homes for sale, (However, this is much higher in comparison to last year’s end of April of a 33 day supply). Pendings increased slightly with continued new inventory coming onto the market, but it still lags slightly behind last year by 5.4%. The pending/active ratio decreased slightly to .88, still below our neutral mark. However, our ratio last year at the end of May was a strong (seller’s) 1.26. This is quite a difference. This is the 11th month in a row that the ratio has fallen below 1.00. The pending/active ratio has been a benchmark that we’ve used as a measure of supply and demand to determine whether we’re in a buyer’s or a seller’s market. Typically, a number well above 1, (more inventory with fewer pendings) favors sellers. A number below 1 favors buyers. In short, we have moved from a strong seller’s market since the beginning of last summer towards a more normal and balanced market, and in many cases, now favoring buyers.
- The percentage of homes “sitting” has increased slightly to 42% of the homes listed now remaining active for 30 days or longer, while 19% have stayed on the market for 60 days or longer. Still there are many more homes that are “sitting” this year as compared to last year, (with then 27% remaining active over 30 days and 12% remaining active over 60 days).
- The “distressed” market, (foreclosures and short sales) are no longer a factor representing less than .05% of the market.
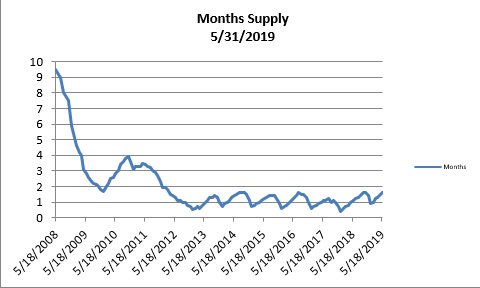
- The month’s supply for the combined 39 city area is 48 days. Historically, a 2 to 3 months’ supply is considered normal in the San Francisco East Bay Area. As you can see from the graph above, this is normally a repetitive pattern over the past four years. We are higher when compared to last year at this time, of 33 days.
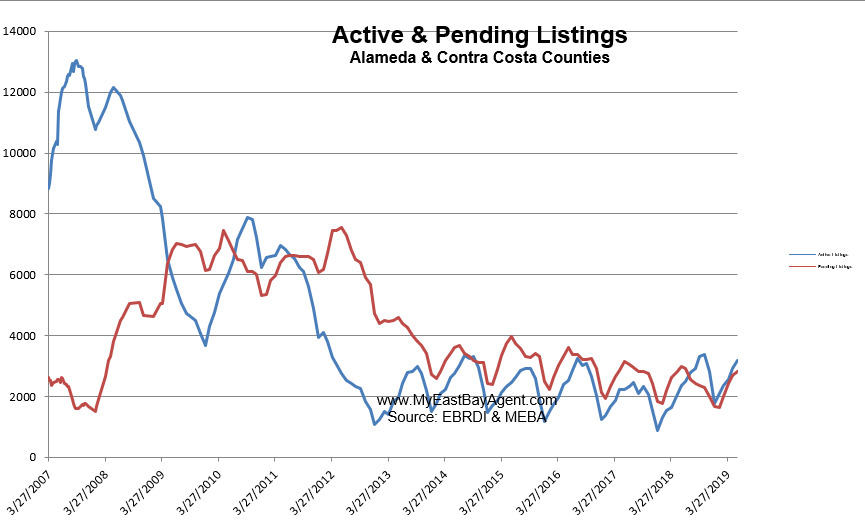
- Our inventory for the East Bay (the 39 cities tracked) is now at 3,185 homes actively for sale. This is higher than last year at this time, of 2,348 or (35.6% higher). We’re used to seeing between 3,000 and 6,000 homes in a “normal” market in the San Francisco East Bay Area. Pending sales increased to 2,811, less than what we saw last year at this time of 2,970, or 5.4% lower.
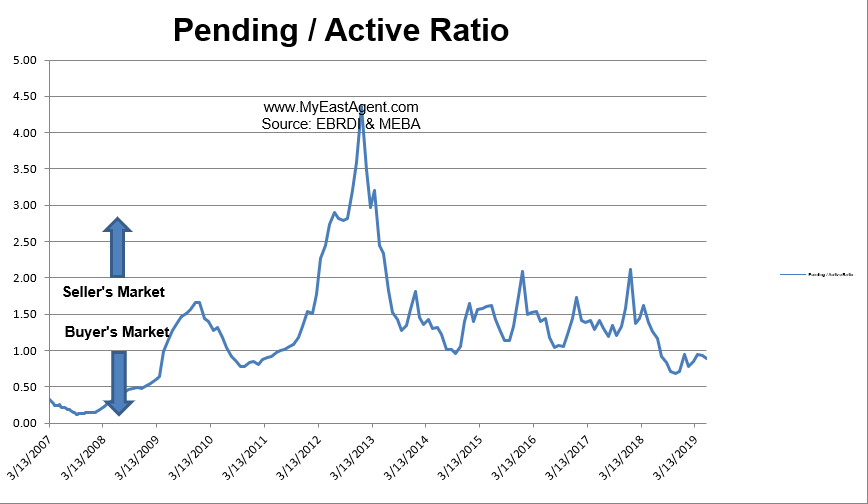
- Our Pending/Active Ratio is .88. Last year at this time it was 1.26.
- Sales over the last 3 months, on average, are 3.4% over the asking price for this area, lower than what we saw last year at this time, of 6.5%.
Recent News
Bay Area home prices flatten as buyers are ‘getting their sanity back’
Kathleen Pender, SF Chronicle, May 31, 2019
Bay Area home prices stalled out for a second straight month in April, a sign they may have reached their limit despite the region’s robust economy and rock-bottom unemployment.
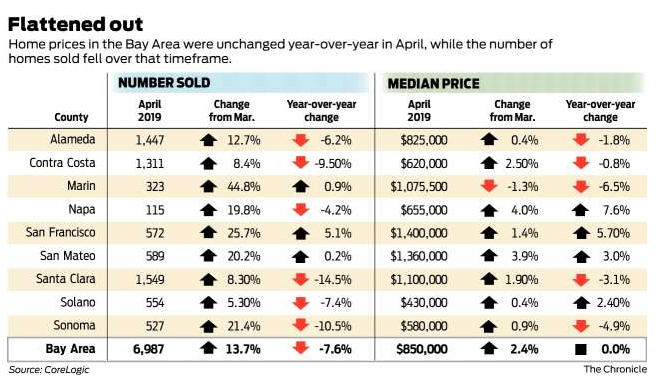
The median price paid for a new or existing home or condo in the nine-county region was $850,000 in April, up 2.4% from the previous month but unchanged from April 2018. In March, the median price dipped a scant 0.1% from the same month last year, according to a report released Thursday by research firm CoreLogic.
“We are seeing more price reductions, more contingent sales, we are not having the spring we had last year,” said Joan Ulibarri, a Compass real estate agent on the Peninsula.
In April of last year, the median home price was up 13.3% year over year, CoreLogic said, and in Santa Clara County alone, it was up a breathtaking 27.6%.
According to a separate study from the California Association of Realtors, the median price paid for an existing single-family home in April fell 2.2% from April 2018 in the Bay Area, the only region in the state with a price drop. Statewide, the median price rose 3.2%. For existing condos, the median price dropped 5.2% in the Bay Area and fell 0.3% statewide.
“There are more active listings, a lot more to choose from” in the Bay Area, said Jordan Levine, the association’s deputy chief economist. There has also been a shift in the mix of sales, with fewer high-end sales and more entry-level sales. That lowers the median price, which is the price at which half of homes sold for more and half for less.
Looking at the median price paid per square foot adjusts somewhat for the mix of homes sold. For the Bay Area, the median price paid for a single-family home was $563 per square foot in April, up slightly from $561 last April. For condos, the median price paid per square foot dropped to $596 from $629.
“Compared to other regions in the state, the Bay Area is way past previous highs set during the last cycle,” which ended around 2007, Levine said. “Affordability is undermining demand (in the Bay Area). It’s becoming harder and harder to see the same amount of price growth we sustained through the current cycle. The economy is strong, but at the end of the day, people still have to make those monthly mortgage payments. There is an upper bound in the Bay Area where people can actually afford homes.”
Compass agent Virginia Supnet put it another way.
“Buyers are being a lot pickier,” she said. “They’re getting their sanity back.”
Supnet, who works on the Peninsula and the Coastside, concurred that sales are still brisk at the lower end but sluggish at the higher end. Where those two ends meet depends on the location.
In Half Moon Bay, anything priced from $900,000 to $1.5 million is still moving quickly. But Supnet has a listing on Miramar Drive in Half Moon Bay that’s been on the market since December. After two price reductions, it’s listed at $2,390,000, with 4,140 square feet of space, ocean views, a home theater, gym and wine cellar.
“People love it,” she said, “but it’s either not in their price range or they could afford it but they think, ‘Do I really need all this space?’”
In Menlo Park, “anything under $2 million would be gone in an instant. Once you start getting to $3 million or $3.5 million,” things slow down. “I think people are tired of overpaying,” she said.
In some cases, they’re going elsewhere. New census data showed that the Bay Area’s estimated population growth over the past two years slowed dramatically compared with the previous six.
Steve Salta and his wife are moving July 1 from San Francisco to Portland because they’ve outgrown the two-bedroom, 1,000-square-foot home they’re sharing with their two boys, ages 6 and 2, and a dog.
“My wife and I really wanted to stay here,” he said. “I love the idea of raising my children in an urban environment, a major market where you step outside and any type of food is there, any type of people are there. We love that.”
But a three-bedroom home in a good school district would have cost at least $2 million, including likely renovations.
“If we tried to stay here, with our financial situation and income, we’d be house poor and in a very risky situation” if one of them lost their job, Salta said. “As much as we love the Bay Area, it would be irresponsible of us to spend our money this way considering we have two young kids we are trying to provide for.”
In Portland, where Steve Salta grew up, they can move into a home his family owns. His wife, Michelle, is self-employed and Steve can keep his job in business development at Healthline, a medical information website, and come to the San Francisco office once a month.
It’s too soon to say what impact this year’s crush of Bay Area initial public offerings will have on the housing market. The two biggest companies to go public — Lyft in March and Uber in May — are trading below their IPO prices. A number of smaller ones — such as Shockwave Medical, Zoom Video Communications, Silk Road Medical and PagerDuty — have soared.But employees generally can’t cash in their company stock or options until six months after their IPO dates, and that won’t be until fall.
Although the number of Bay Area homes on the market in April was higher than last April, it was still low by historical standards. That means “there is still lots of demand,” Levine said. “If you inject the local economy with lots of cash, that’s going to exacerbate the existing supply constraints.”
It’s worth noting that the median price in San Francisco County alone hit a record high — $1.4 million — in April, surpassing the $1.38 million record set in March, according to CoreLogic. Many of the companies with this year’s biggest IPOs, including Uber, Lyft, Pinterest and Levi Strauss, are based in San Francisco.
Zillow says era of easy gains appears to be over in Bay Area housing market
By Ted Andersen – San Francisco Business Times, May 21, 2019,
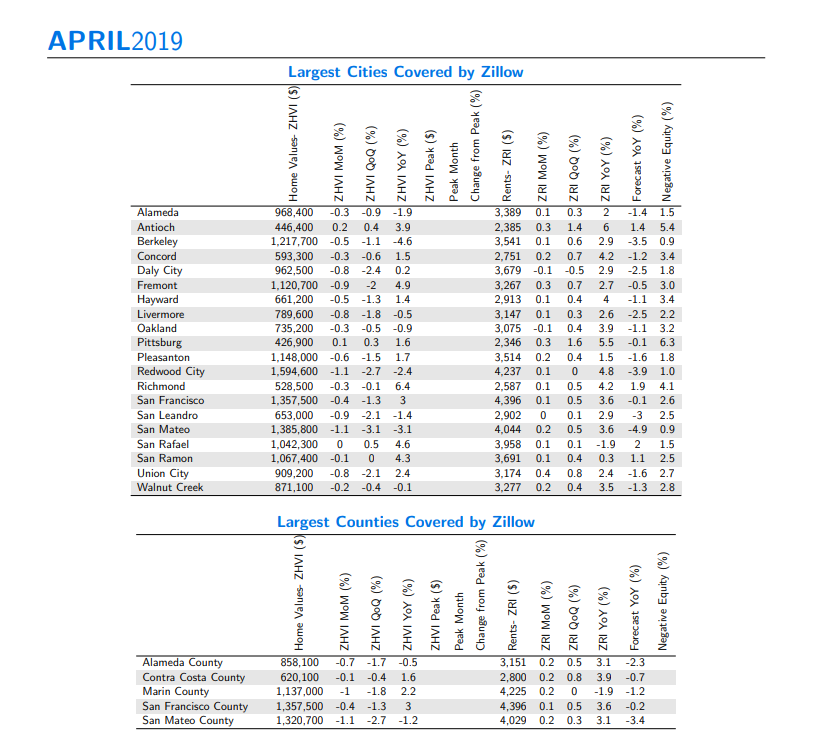
Home values have likely peaked in the Bay Area, according to Zillow’s April housing numbers, released last week.
This could mean that the solid year-over-year gains the market has experienced might be a thing of the past.
In San Francisco, home values have fallen in each of the past five months and are down quarter-over-quarter, indicating the start of a longer-term trend, according to the report. Residential real estate in the city is up 1.3 percent annually, but rapidly slowing as home values were growing 9.4 percent a year ago.
In San Jose, values have fallen in each of the past six months, as that city remains the only major market where home values are also down year-over-year, falling 2.7 percent from last year. The report stated that with the Bay Area leading the way, home values nationally have declined month-over-month for the first time in more than seven years, breaking a streak of 85 consecutive months of gains that brought home values to record highs.
But it’s far from all gloom and doom for the market, according to other experts who weighed in.
“As far as I can tell, the most expensive housing market in the country has stopped, for the time being, getting more expensive,” Patrick Carlisle, chief market analyst with Compass, told the Business Times. “I’m hearing that the S.F. market is pretty damn competitive right now with very low inventory and multiple offer bidding — though not quite as crazy as last year — so we really need to see the results for the rest of the spring selling season, which will show up in sales closing in May and June.”
However, Carlisle said the picture in the San Jose — or Santa Clara County generally — is clearer: That market appears to have peaked in 2018 and has seen significant declines in median sales prices since last summer.
2020 Vision: Experts Say Next Recession Looms at Decade’s End
By Zillow Research on May. 22, 2018
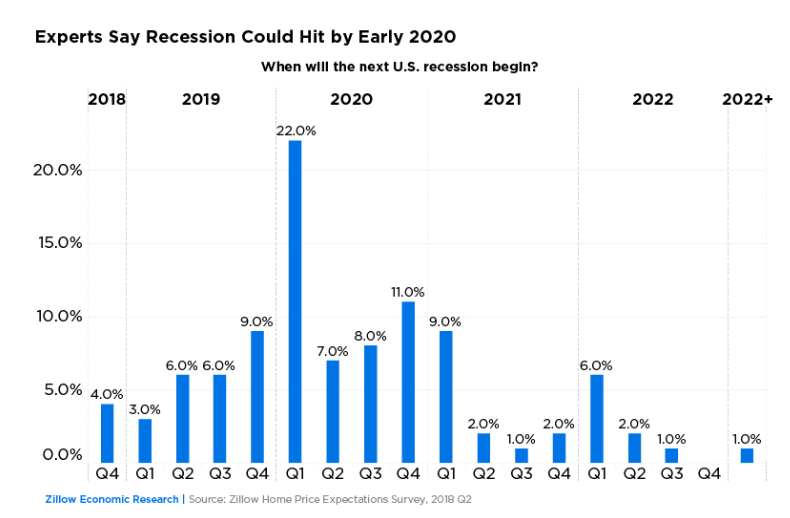
- Almost half of experts recently surveyed by Zillow said they expect the next recession to begin some time in 2020.
- The most likely trigger for the next recession is monetary policy, according to experts.
- Mortgage underwriting standards in general are about right, panelists said. But while credit has loosened for the best borrowers, it has tightened somewhat for those with low credit and/or a low down payment.
Experts largely expect the next recession to begin in 2020, in line with prior expectations expressed in the latter half of 2017. But unlike last year, experts these days are less worried that geopolitical events might tip the economy into the red, and more concerned over monetary and trade policy.
Almost half (48 percent) of those with an opinion said they expected the next recession to occur some time in 2020, with the largest portion of those (22 percent of all respondents) saying they expected that recession to begin in the first quarter of that year. The results are from the most recent Zillow Home Price Expectations Survey (ZHPE), a quarterly survey of more than 100 U.S. real estate experts and economists sponsored by Zillow and conducted by Pulsenomics. Roughly a quarter (24 percent) of all respondents with an opinion said they expected the next recession some time in 2019, while 14 percent said they thought 2021 was the year.
Of note, 9 percent of those with an opinion said they expected the next recession some time in 2022; 4 percent said by Q4 of this year; and just 1 percent said they expected the next recession to begin some time after 2022.
The expectations for the timing of the next recession are in line with a prior survey of the same panel, published in August 2017, when experts said there was a 73 percent probability for a recession by the end of 2020. Similar to the prior survey, panelists were also asked to choose and rank up to three likely triggers for the next recession – but the world moves fast, and the likely causes given in this most recent poll were widely different from the fears expressed just nine months ago.
Of the 99 panelists forecasting the timing and triggers of the next recession, 55 chose “monetary policy” as a likely recession trigger. The panel ranked likely triggers as 1, 2 and 3 – and with that weighting, monetary policy came out as by far the most expected catalyst, with a score of 137. That put it well ahead of trade policy (a score of 71), a stock market correction (69), higher-than-expected inflation (68) and fiscal policy (64). A potential geopolitical crisis triggering a recession ranked a distant sixth, with just 26 panelists selecting it as a likely recession spark, for a score of 44 – well below the 67 panelists (and score of 138) recorded previously.
And unlike last decade’s recession, caused in large part by speculation and bad actors in the housing market and felt most strongly by homeowners, experts said they do not think a similar housing crash is likely to trigger the next recession. A potential housing market crisis ranked ninth on experts list of potential recession triggers, with a score of just 17.
Mortgage Credit: Better for the Best, Worse for the Rest
Insomuch as it trickles down to consumer interest rates and on to consumer credit decisions, panelists’ concerns over the potential for monetary policy to trigger the next recession were not echoed in their assessment of residential lending standards more broadly. A majority of those with an opinion (51 percent) said today’s mortgage underwriting standards were just about right, neither too tight nor too loose. Similar portions of respondents said underwriting in general was somewhat tight (25 percent) as somewhat loose (21 percent).
But while panelists said lending standards were about right overall, their views on how availability of credit has evolved in recent years varied depending on the credit profile of certain mortgage borrowers – with things getting generally better for the best borrowers, but worse for the rest. For prime borrowers with the best credit histories, a large majority (70 percent) of panelists said lending standards were about the same or looser today relative to pre-bubble norms. For more typical borrowers with less-stellar credit histories, exactly half of panelists said credit has gotten somewhat tighter, with only 13 percent saying it had gotten easier.
The story was worse for those borrowers with low credit scores and/or those seeking a loan with a low down payment: 84 percent of respondents said lending standards have gotten somewhat or much tighter for the former, with 75 percent saying the same for low-down-payment borrowers.
A Slowdown in Appreciation Through the End of the Decade
Finally, panelists were also asked to project the pace of growth in the Zillow Home Value Index over the next five years. The average of all expectations among the 114 experts offering a prediction was for home values to end 2018 up 5.5 percent over the end of 2017, a slowdown from current annual growth of 8 percent. On average, panelists said they expected home value growth to slow further in coming years – to 4.1 percent by the end of next year, 2.9 percent in 2020, 2.6 percent in 2021 and 2.8 percent by 2022.
Why nearly half of San Francisco Bay Area residents plan to leave
By Patrick Chu, San Francisco Business Times, Jun 3, 2018
Nearly half of San Francisco Bay Area voters plan to leave the region in the next few years, fed up with exorbitant housing costs and the long commutes caused by the lack of available homes near their workplaces.
Less than 48 hours before polls open for the California election, the business-sponsored Bay Area Council advocacy group released its annual survey of registered voters in the nine-county Bay Area showing that 46 percent are likely to move away, the highest percentage in three years.
Bay Area employers are losing talent and many companies are relocating to more affordable housing venues in the state, or much more likely, leaving California altogether, the Council says, as rising housing costs far exceed the compensation to cover monthly payments. Housing costs topped the list of issues for the fourth straight year. Not surprisingly, 42 percent of those polled in an open-ended question said the housing crisis was the most troubling issue.
Just two weeks ago, the California Association of Realtors said a San Francisco household would need to make $333,270 a year to afford a median-priced home of $1.6 million using a 20 percent down payment and a 30-year mortgage with a fixed rate of 4.44 percent. The monthly payment would be $8,330, which includes property taxes and homeowner’s insurance. Only 15 percent of current S.F. households reach that compensation level, the Realtors said. For renters, the average rent for a one-bedroom unfurnished apartment in the city is about $3,258 per month.
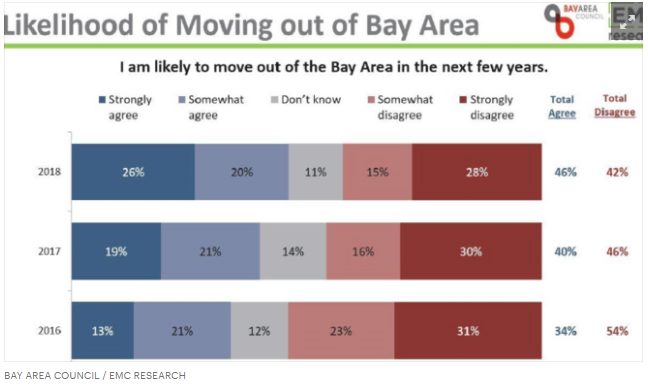
Most troubling for the future of the regional economy, is that millennials plan to flee; 52 percent said they will depart vs. 46 percent last year, the Council poll says.
Despite full employment, only 25 percent of those surveyed say the regional economy is going in the right direction; in 2014, 57 percent said the economy was favorable.
This year, 47 percent said they expected “a significant economic downturn” within three years, the Council said.
Leaving? For where?
Of the people surveyed in the online poll who said they want to leave, only a quarter plan to stay in California. Sixty-one percent said they would relocate outside California and 10 percent are eyeing Texas. Oregon, Nevada and Arizona were mentioned, too. Six percent said they want to go anywhere that was affordable with lower taxes.
Bay Area traffic congestion was the No. 2 most-mentioned problem and homelessness followed.
“These results are tough to report, but we can’t let this growing pessimism become a self-fulfilling prophecy,” Bay Area Council President Jim Wundermansaid. “There’s still time to get a handle on our housing and transportation problems, but it will require strong leadership and partnership across the region to do it combined with bold thinking and decisive action. We can’t wait until our economy tanks to fix these problems and letting our economy tank is not a solution.”
In a possible sign of voter dissatisfaction in the coming election, 56 percent of the survey respondents said local governments are responsible for making housing more affordable and 66 percent said those same bodies should be reducing traffic congestion and providing more and better transportation solutions. About 19 percent of voters believe the tech industry should fix housing and traffic problems in the region.
California Housing Market Driving Millennials Back to Parents’ Doorsteps
By Mike Albanese, MReport, June 3, 2019
More millennials are moving back in with their parents in the San Francisco and San Jose, California, areas, according to a report by The Mercury News. More than a fifth of millennials (ages 23-37) lived with their parents in 2017, according to information from Zillow and U.S. Census Data.
The report states that the number of millennials returning to live at home has increased 65% in San Francisco and 56% in San Jose since 2005.
“Millennials are facing a double-whammy,” said Matt Regan, a housing and public policy expert for the Bay Area Council. “They are behind a couple of eight balls. They are living through one of the biggest housing crises in history while saddled with the biggest student loans in history. They are often at the bottom of the income ladder and they are getting forced out of the region or moving back to their old rooms at home.”
Affordability remains in issue in the Golden State, as a report last month from Trulia found that California had four of the five priciest metros in the nation: San Francisco, San Jose, Los Angeles and San Diego.
The report stated that San Diego, which has a median home value of $569,700 and median income of $75,110, has only 8% of its zip codes with 100% of homes considered affordable.
While millennials struggle in California, the rest of the nation is reporting a sense of urgency, and priority from millennials, to get into the housing market.
A survey from SunTrust last month stated that among more than 2,000 U.S. adults, nearly half of millennials (48%) who have been married say they, or their spouse, owned a home prior to marriage, compared to 35% of baby boomers (ages 55-73).
“People are choosing from many different paths and reaching common life milestones at a wider age span than before, changing when they decide to purchase a home,” said Sherry Graziano, Mortgage Transformation Officer at SunTrust.
SunTrust also found an increasing number of couples are entering marriage with both individuals owning a home. The survey stated that 25% of unmarried women and 21% of unmarried men said they would prefer to sell both residences and buy a new one after marriage.


 Facebook
 X
X
 Pinterest
 Copy Link

