


 Facebook
 X
X
 Pinterest
 Copy Link

SF East Bay Real Estate Market Update
April 30, 2020
By Glen Bell (510) 333-4460
Everyone seems to be asking the question of how will the COVID-19 “shelter in place” mandate effect the real estate market and how will we come out of it later in the year. There’s been so much speculation with a number of different opinions coming from a number of sources. Keep in mind that this is “unchartered territory” and we won’t have definitive answers for quite some time. So much has changed. We as agents are very limited in what we can do during this period. A lot will be riding on how long it takes before we’re able to really go back to work, how long it takes for the COVID-19 fears to subside, how will the economy fair and what will the jobs situation looks like by then.
As agents, the market has paused as our lives have. Preparing a home for market has been delayed, and fewer new listings are coming on, due to the many challenges of being able to properly market them. Brokerages temporarily closed their doors with agents primarily working remotely from their homes. There are no open house showings while physical individual showings are discouraged and have come to a crawl. COVID-19 has disrupted all of our lives. The uncertainty and concern for our health and well-being for not only ourselves, but our family and friends, is foremost in all of our minds.
That being said, let’s take a look at how the market stands at the end of April. We haven’t seen dramatic changes just yet. What we have seen is a “mixed” bag. However, I say that only by looking at the numbers up until April 30th. Everyone asks me to pull out your crystal ball and tell us what’s going to happen.
For me, I’ve always been a firm believer in supply and demand concepts. For example, in real estate, the number of houses for sale always represented our supply, while the number of homes that have gone into contract, or pendings, represented our demand. What kind of a market, a buyers’ or a sellers’, is determined based on the relationship of these two numbers at any given time. During the REO days, there was a huge inventory, with few buyers, thus a buyers’ market. For most of the past 6 years, markets experienced a strong sellers’ market with very few listings and lots of buyers. For most of last year, we had moved back towards a more neutral or balanced market. When inventory “fell off the cliff” in November 2019, a month earlier than normal, it set up for a strong sellers’ market again early spring and that’s exactly what happened. Very little to look at with lots buyers trying to take advantage of extremely low interest rates. We saw more competition and increased prices early on. Then COVID-19 hit.
What we’ve seen since COVID-19, is that if sellers did not already have their home listed for sale, many decided to delay or postpone coming onto the market until some of the uncertainty subsides. Many buyers have jumped back on the fence and are holding off. The uncertainty of their job being in jeopardy, a loss in income, health fears, or seeing a “big hit” in their stock portfolio has taken its toll.
The lack of inventory early this year had “flipped” our markets back into a sellers’ market temporarily. However, it seems to be setting up for another big change to come by as early as this summer. There’s a large number of sellers who took a wait and see attitude over COVID-19 who may come back onto the market then. This could come in waves with some wanting to see first how the market is doing before they put their home up for sale. There may even be more who took financial hits and feel that they now “must sell.” So, we’ll probably see a fairly large supply of homes come onto the market over the summer. Many buyers on the other hand have backed off and may not be in a financial position to purchase by then. So perhaps the strong demand that we’re used to seeing in the Bay Area will begin to decrease. This will probably pull us back into a more neutral or balanced market, or possibly even into a buyers’ market for the first time in years.
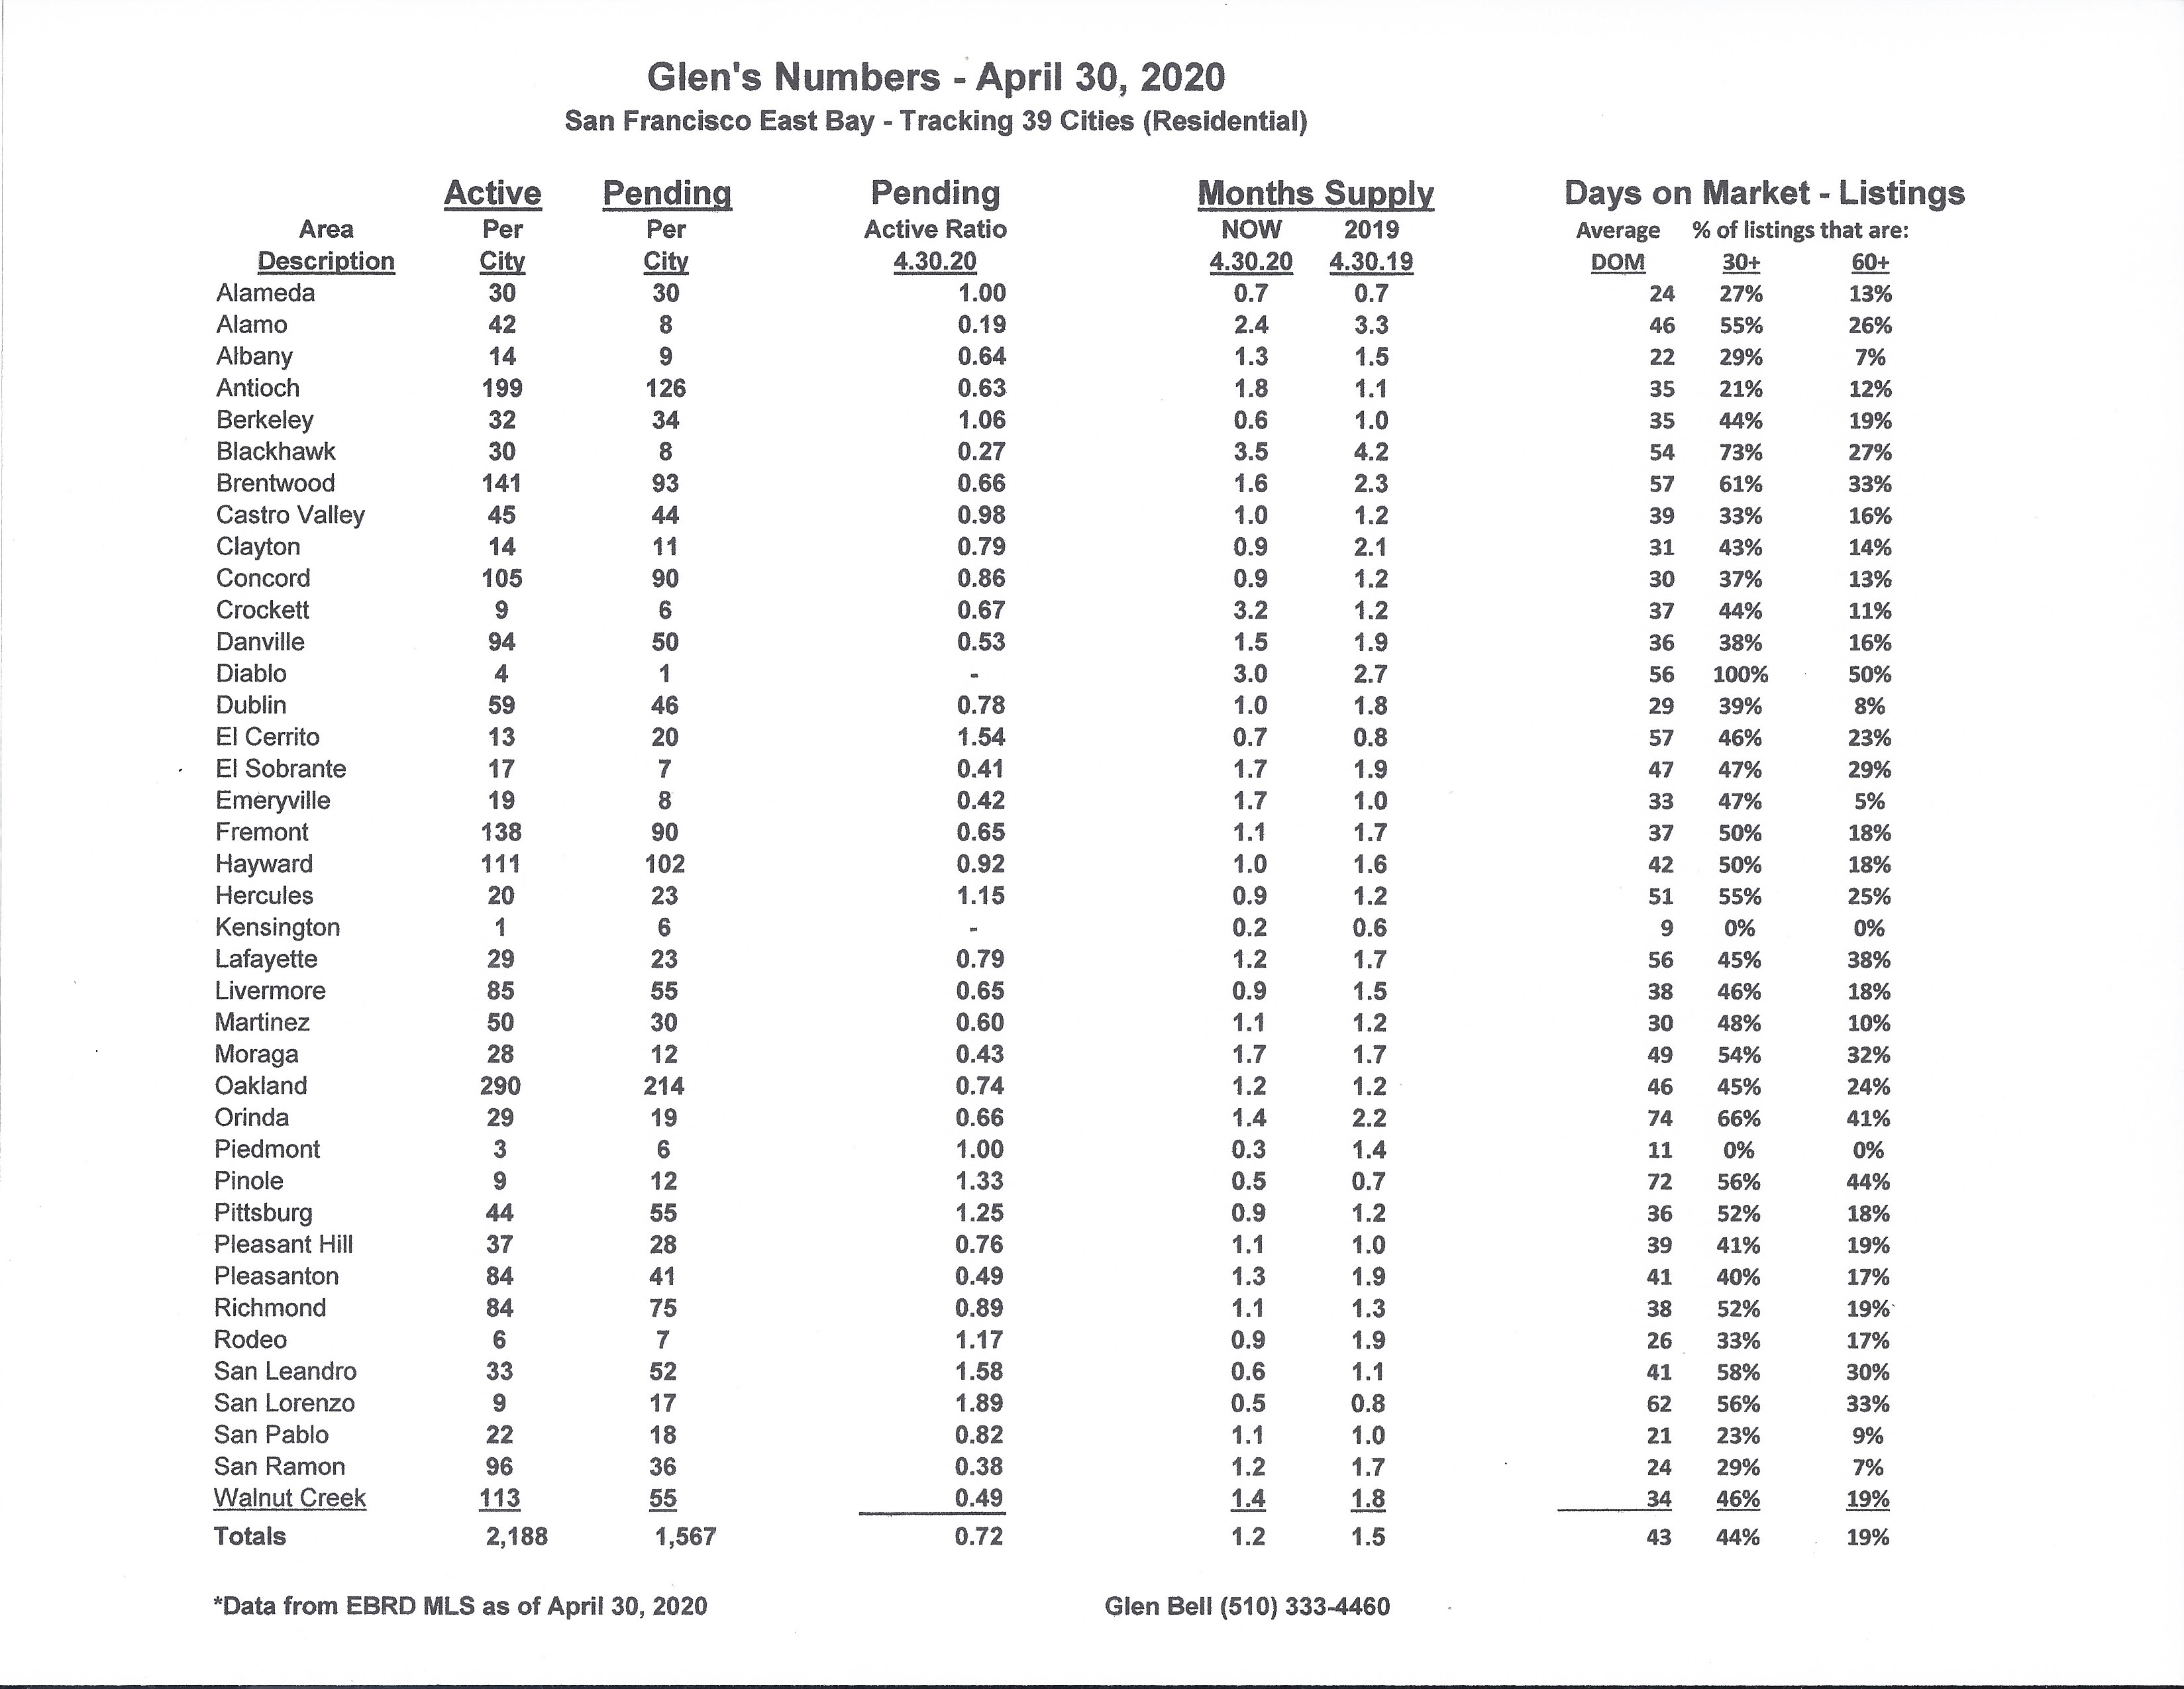
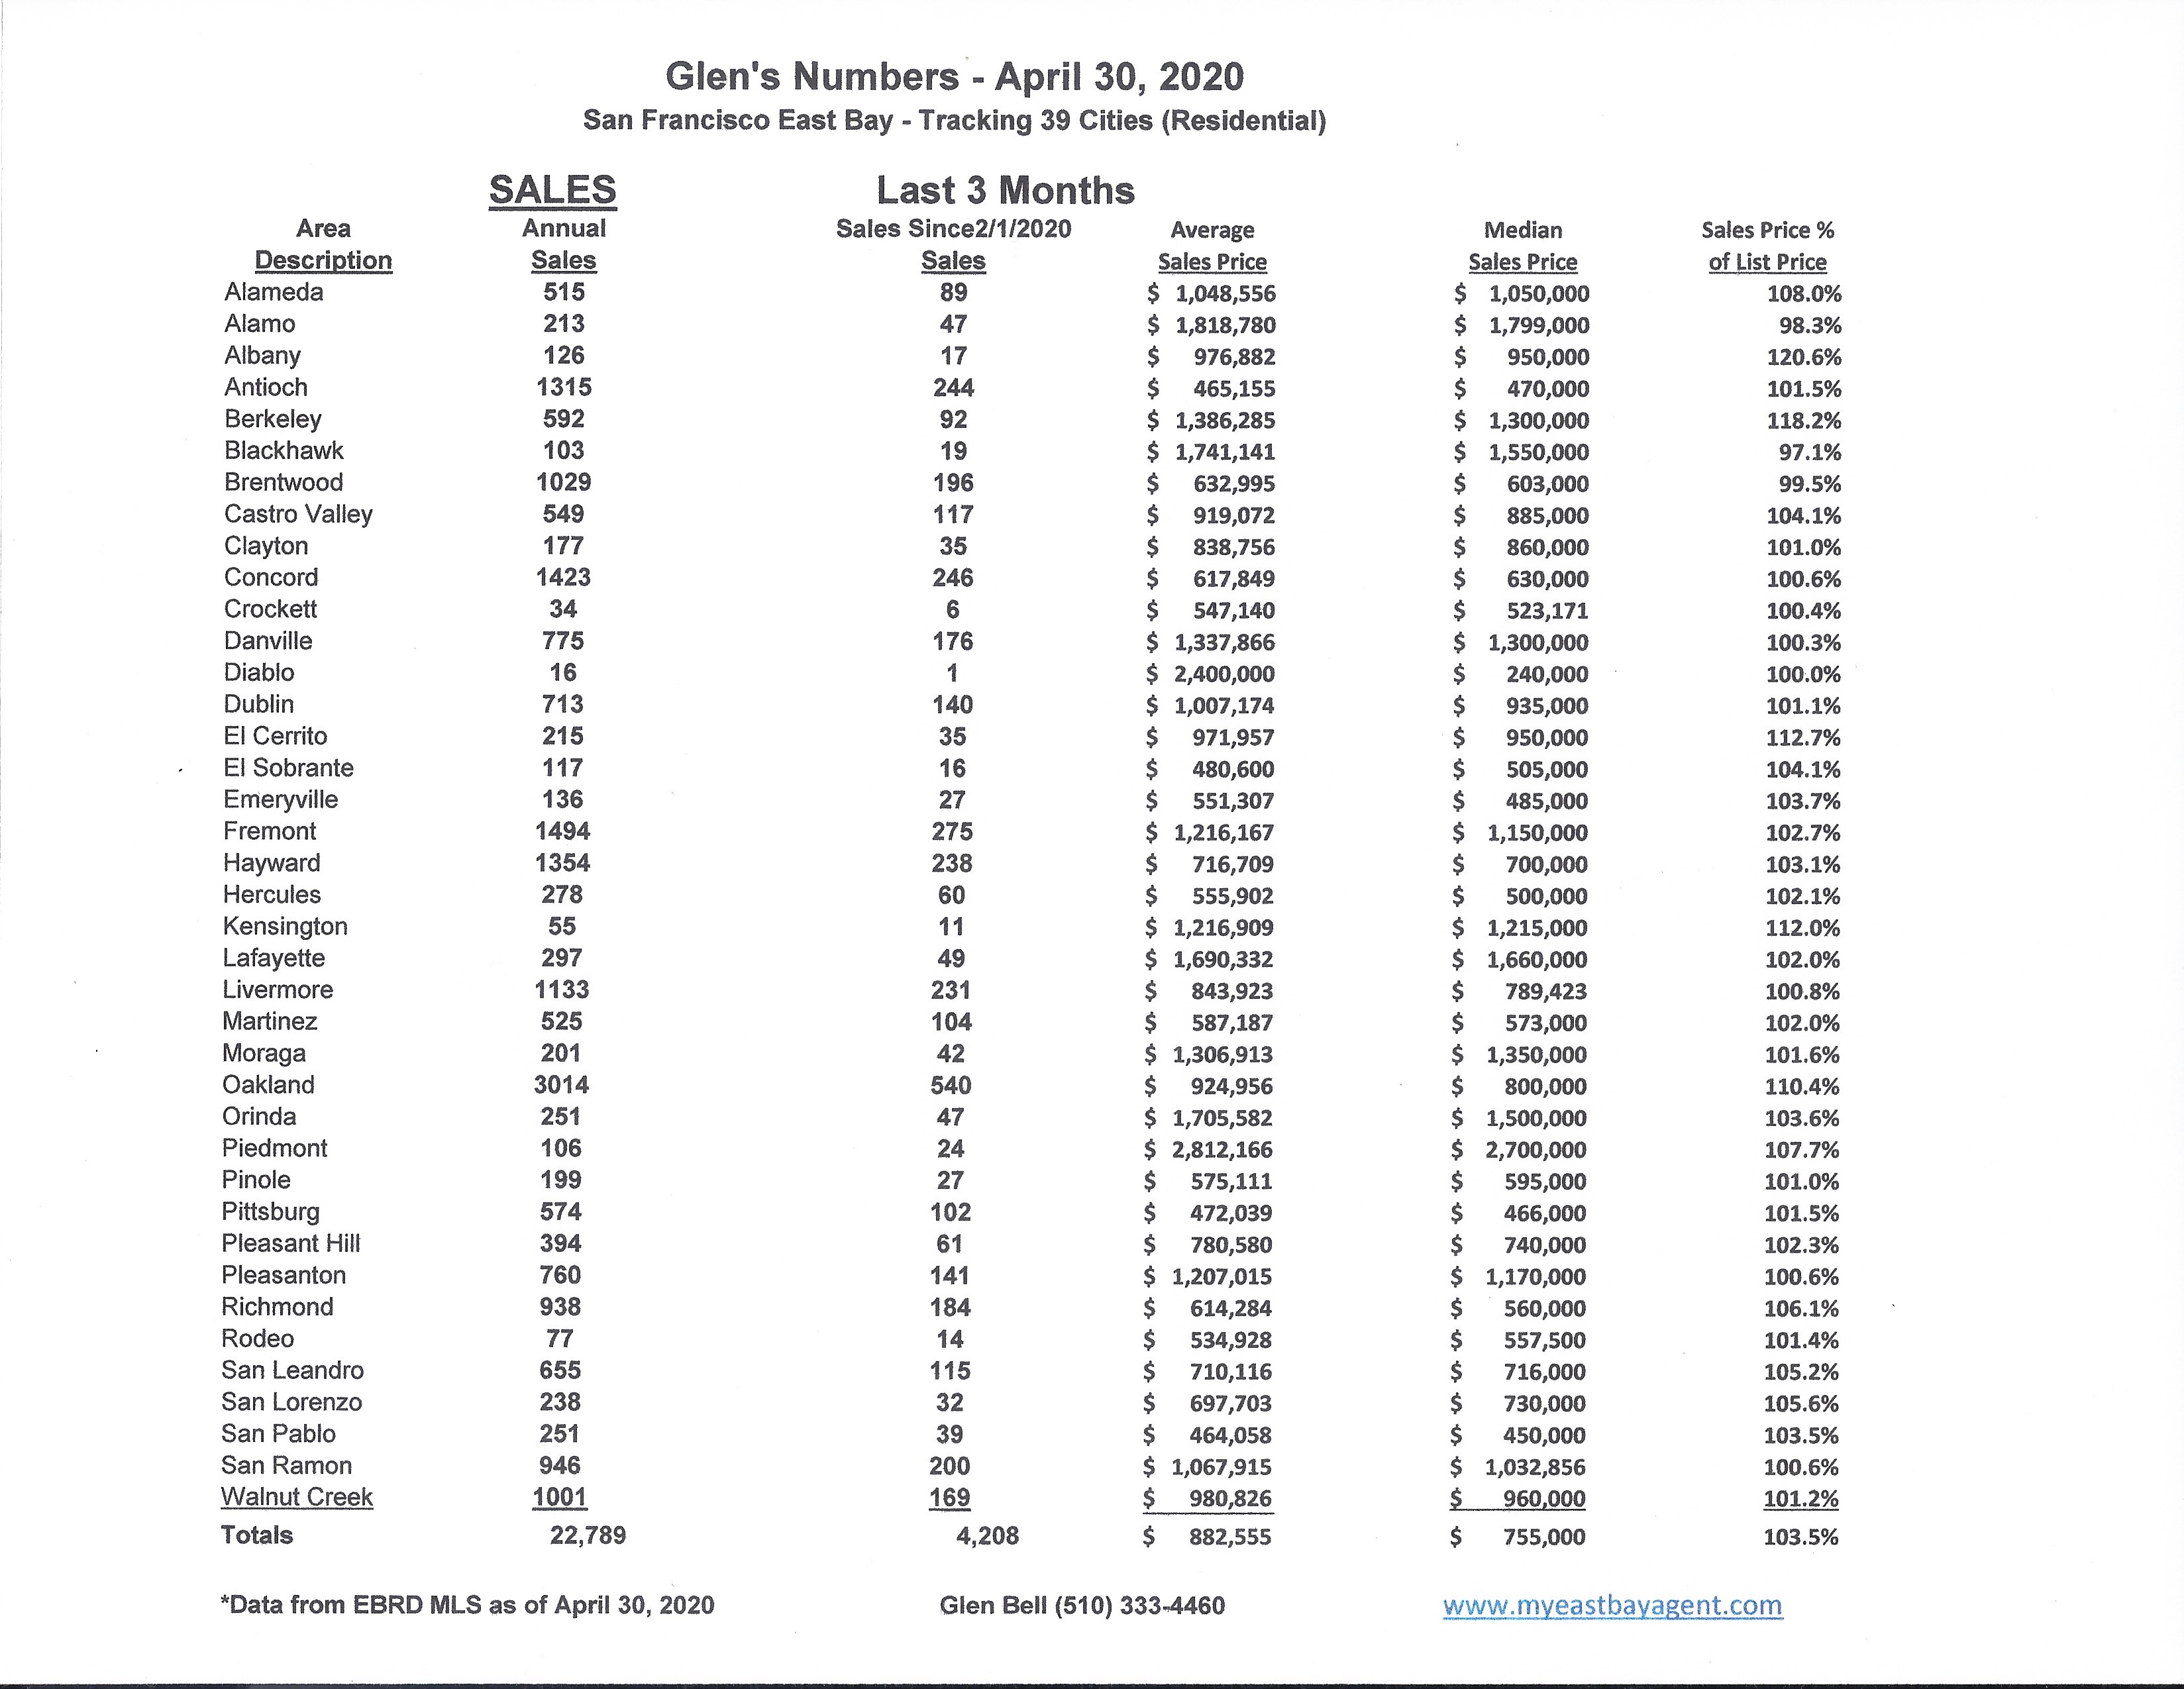
Here are some highlights for the 39 East Bay Cities that I track:
Sales are up slightly, but still 18.5% lower than last year’s numbers. Prices are up slightly as well. However, that looks to be more of a result of our earlier spring influence. This looks to be changing. Now, more homes are “sitting,” taking longer to sell, and we’re seeing more transactions fall out. Fewer buyers are going into contract.
The seasonal drop in inventory followed our normal pattern during the holidays. We watched the number of homes decrease by nearly 60% over November and December. Last year was somewhat unusual because we saw a late season start and early season end. Inventory at the end of December was at its’ 2nd lowest level since I began tracking these 39 cities in 2006, with only 1163 homes for sale at the end of December. Our expectations normally are that new home listings begin to appear on the market as early as mid-January with a steady increase of inventory every month through to September, traditionally our high point.
Inventory increased in April by 41%, however, that’s still 25% lower than what we saw last year at this time. This represents a 36 day supply of homes, compared to a 45 day supply last year at the end of April. The trend with pendings continued to slide, dropping by 21% in April. This is the second decrease in a row during a period of time when we normally see an increase. This is the lowest number I’ve seen since January 2008. This is primarily due to low inventories as well as the influence of the COVID-19 and the “shelter in place” mandate during the last month and a half.
The pending/active ratio saw a huge decrease to .72. This is lower when compared to last years’ number of .92. We were at 1.28 just last month. I can’t remember ever seeing such a large drop in just one month. The pending/active ratio has been a benchmark that we’ve used as a measure of supply and demand to determine whether we’re in a buyer’s or a seller’s market. Typically, a number well above 1, (less inventory with more pendings) favors sellers. A number below 1 favors buyers..
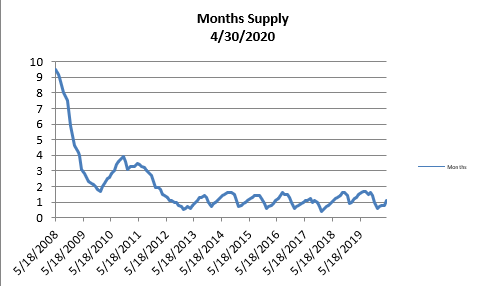
- The month’s supply for the combined 39 city area is 36 days. Historically, a 2 to 3 months’ supply is considered normal in the San Francisco East Bay Area. As you can see from the graph above, this is normally a repetitive pattern over the past four years. Supply is less when compared to last year at this time, of 45 days.
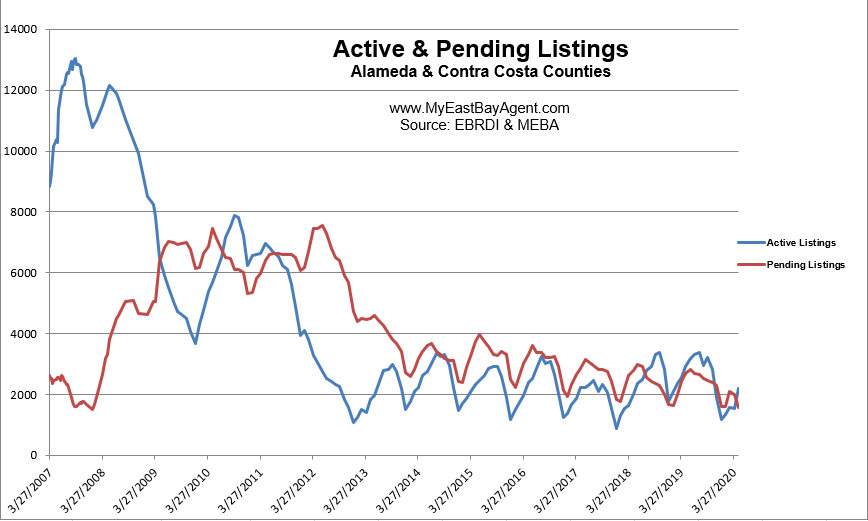
- Our inventory for the East Bay (the 39 cities tracked) is now at 2,188 homes actively for sale. This is fewer than what we saw last year at this time, of 2,915. We’re used to seeing between 3,000 and 6,000 homes in a “normal” market in the San Francisco East Bay Area. Pending sales decreased to 1,567, much lower than what we saw last year at this time of 2,695.
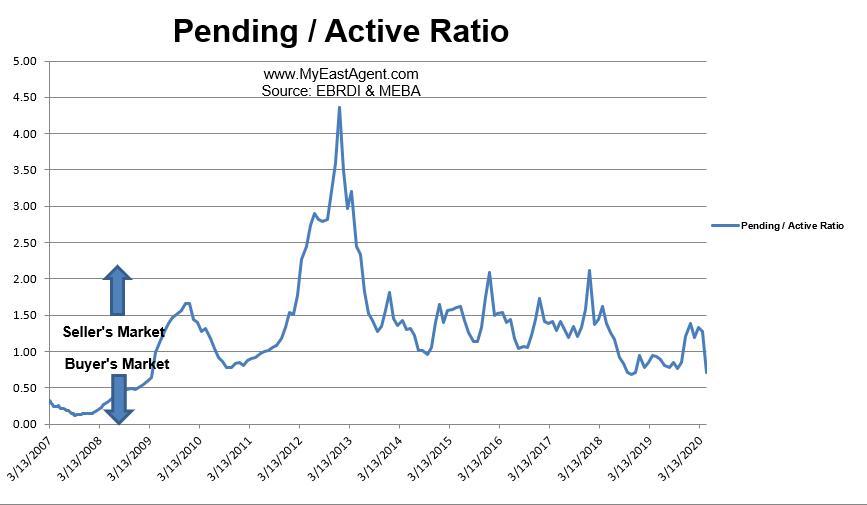
- Our Pending/Active Ratio is .72. Last year at this time it was .92.
- Sales over the last 3 months, on average, are 3.5% over the asking price for this area, slightly higher than what we saw last year at this time, of 2.8%.
Recent News
Zillow Forecasts a Dip in Home Prices, Rebounding By Next Year
By Claire Boeing-Reicher – Matthew Speakman on May. 4, 2020
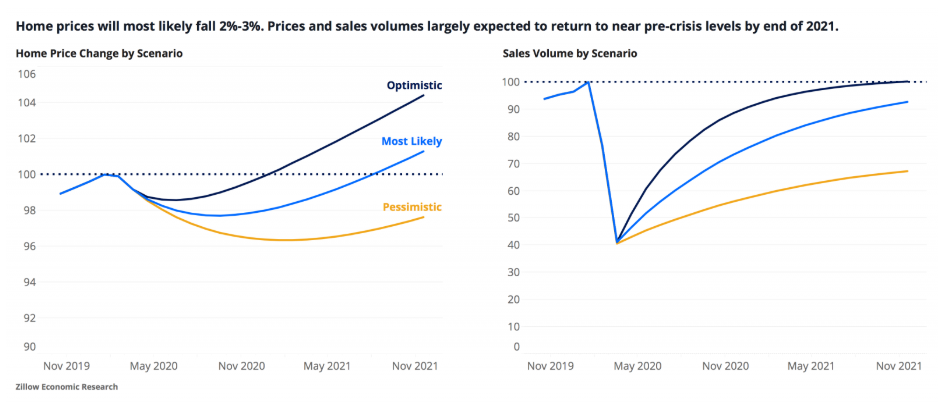
The continued economic fallout from the spread of COVID-19 has introduced immense uncertainty into the housing market as consumers step back from large purchases and social distancing puts a chill on necessary market services. As a result, Zillow expects home prices will most likely fall 2%-to-3% through the end of the year from pre-coronavirus levels, and home sales to fall as much as 60%, before both begin to slowly recover to baseline levels by the end of 2021.
The latest forecasts, based on published and proprietary macroeconomic and housing data, also include more pessimistic or optimistic projections based on the duration of the pandemic and the depth of its impact on the broader economy.
The forecasts center around a baseline prediction of a 4.9% decrease in United States GDP in 2020 and a subsequent 5.7% increase in 2021. Under the baseline scenario, we expect:
- A 2%-3% drop in prices through the end of 2020, followed by a slow recovery throughout 2021. Prices will return to Q4 2019 levels by Q3 2021.
- A 50% decline in home sales from their pre-coronavirus levels, as measured at the end of 2019. Home sales will bottom out in Q2 before beginning to improve near the end of Q2 2020.
- Sales volume will recover to about 97% of Q4 2019 levels by the end of 2021.
- The pace of recovery is what distinguishes our three scenarios from one another.
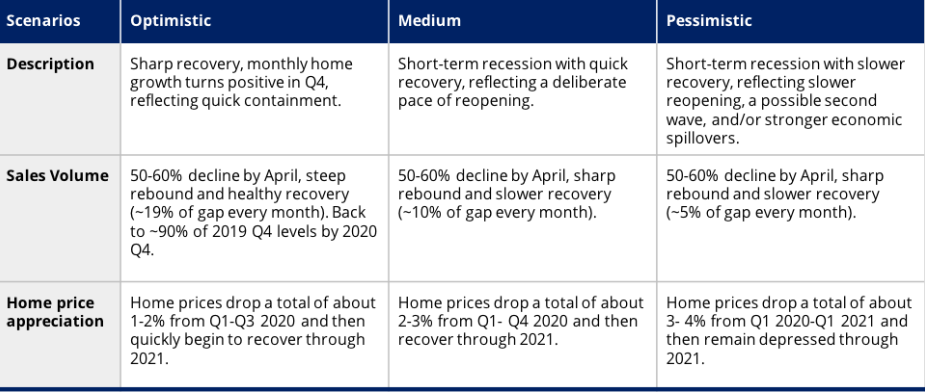
Each of our scenarios implies very different paths for home prices and sales volumes. Our optimistic scenario features a small dip in house prices in Q2-Q3 followed by a robust recovery. The baseline medium scenario features a U-shaped trough in Q4 followed by a slower recovery and our pessimistic scenario features continued weakness through all of 2021 (more of a “long U” shape). Under our more-optimistic assumptions, the market could experience a fast, V-shaped “snapback” similar to what happened in the Hong Kong real estate market after the 2003 SARS outbreak. The medium scenario features a “check-mark” shaped recovery and our pessimistic scenario features more of a “wide-U” recovery, with a longer bottom and more gradual pace of improvement.
Overview of Our Scenarios
At time of publication, we believe the medium scenario to be the most likely outcome, followed by the pessimistic scenario and then the optimistic scenario. These scenarios and our assessment of their likelihoods are open to revision and will be revisited periodically as more information regarding the timing, scale and success of relaxed social-distancing measures, among other factors, is released.
How Did We Get Here?
The housing market was beginning to heat up at the end of 2019 and into early 2020. Home price appreciation had begun to reaccelerate after a fairly tepid 2019. Sentiment across most market participants (buyers, sellers, lenders, homebuilders) were all at or near their survey highs. Sales volume and construction levels were both rising at an increased rate. Mortgage delinquency rates were near all-time lows, and record-low for-sale inventory was fueling competition for the few homes on the market.
In addition to a generally strong housing market, the broader U.S. economy was also showing signs of strength, despite some looming concerns. The labor market was riding high: The overall unemployment rate was 3.5%, tied for its lowest level in 50 years; an average of 224,000 jobs were created in the three months ending February 2020; and labor force participation was near a seven-year high. The manufacturing sector, which struggled through much of 2019, was beginning to recover as global tensions (trade war, Brexit etc.) eased and simplified. And consumer spending levels remained steady through February.
Of course, not everything was perfect. Corporate debt levels have risen markedly in recent years, and the quality of debt was beginning to be questioned even before the pandemic. Non-financial corporate debt securities and loans increased to almost 47% of GDP in the last quarter of 2019, up from a post-recession low of 40% in Q4 2010. As of January, only two U.S. companies (Microsoft and Johnson & Johnson) had AAA debt ratings — indicating the highest level of credit-worthiness. Businesses were also scaling back on investments in capital, suggesting they viewed their longer-term prospects as tenuous. Manufacturers’ spending on nondefense capital goods was lower in February 2020 ($68.8B) than it was in February 2012 ($69.7B), despite eight years of economic expansion. And ten years into a record-long economic expansion, the key Federal funds rate as set by the Federal Reserve was very low, leaving the Fed with less wiggle room than usual to stimulate the economy in the case of a downturn.
Even before the onset of the crisis, these factors combined to somewhat dampen our forward-looking outlook. But in general, macroeconomic conditions were sturdy heading into the spring. And this relatively strong economy, coupled with strong demand from home buyers and relatively friendly buying conditions thanks to low mortgage interest rates, meant the housing market was well-positioned for a strong spring selling season.
But over the course of just a few weeks, that all got turned on its head. More than 30 million (and counting) unemployment insurance claims have been filed since the middle of March, representing about one-in-six of all previously employed people counted in the March jobs report. Retail sales levels plummeted in March, falling 8.7% from February, the biggest one-month decline since the Commerce Department began tracking the data in 1992. Industrial production fell 5.4% over the same period, the largest one-month decline since the 1940s.
These and other disruptions have been shocking in both their speed and scale. But even so, we believe many of them to be transitory and will be addressed as the economy opens up again.
Scenario Specifics
In creating this forecast, we relied heavily on macroeconomic forecasts created by Goldman Sachs and the International Monetary Fund, both of which call for a 5%-to-6% decline in GDP in 2020, followed by a 4.5%-to-5.5%% increase in GDP in 2021. A number of high-frequency data points published by Goldman Sachs offering insight into many industries and sectors, including housing, also allowed our team to make frequent updates to our outlook based on hard, industry-specific data.
Our forecast follows a similar structure to Goldman’s, which estimates how much of the gap between actual and potential GDP disappears in the following month for different industries. Our baseline forecast for GDP assumes the same persistence in the gap between actual and potential GDP as Goldman Sachs does. To translate the GDP forecast into a forecast of home prices and transactions, we conducted two separate econometric analyses — relating both long-term home price growth and home sales to GDP — and applied the findings to our GDP scenarios. For home price movements over time we used data from the S&P CoreLogic Case-Shiller home price indices. For sales volume over time we used data from the National Association of Realtors. More information on the specifics of our econometric analysis can be found in the appendix below. We also overlaid scenario-specific factors based on the spread of COVID, the strength of social distancing measures and early signals of recovery in order to come to our conclusions. Specifically, our baseline predicts that about 10% of the gap between actual home transactions and baseline trend disappears in the following month. Differences in the persistence of this gap are what differentiates the three scenarios from one another. The optimistic scenarios for home prices and transactions suggest this gap will recede about twice as quickly as it would in the medium scenarios. The pessimistic scenarios, meanwhile, suggest the recovery rate will be half that of the medium scenarios.
To track the probabilities of these scenarios and to alert us to the need for potential changes (especially to the shape or speed of recovery paths), we are focusing mainly on forward-looking indicators, outside forecasts and empirical studies. On the forward-looking indicator side, we are most-closely tracking survey data and selected financial statistics. The survey data are currently telling us that we should expect much more short-term disruption than longer-term. For instance, the Philadelphia Fed Manufacturing Business Outlook Survey from April 2020 indicated that while most manufacturers view current conditions negatively (worse than 2008-09), they are much more optimistic about future conditions (unlike 2008-09). Similarly, the University of Michigan Surveys of Consumers for April 2020 show a large fall in consumer sentiment reflecting current conditions, while the fall in consumer expectations has been less extreme. Meanwhile, financial data (especially measures of implied volatility such as the VIX, policy uncertainty, mortgage rates and bond spreads) are indicating that financial risks during late March briefly approached the conditions of late 2008, but have since subsided somewhat. That said, we will closely monitor financial data to see if we need to revisit the possibility of creating an even more pessimistic scenario that includes a more fully fledged financial crisis.
Housing-specific data have also validated our assumption of a ~50% decline in sales, while also beginning to offer some clues as to what the next phase of this crisis is going to look like. For-purchase mortgage applications have fallen 31% from a year ago, but have recently shown some signs of stabilization. At their worst, home showings fell as much as 50% since the beginning of the year, but subsequently rose to a level “only” 27.5% below where they were to start the year. Internal measures of newly-pending home sales and new for-sale listings have also shown signs of turning the corner.
Downside Risks and Go-Forward Plan
While our internal and external data currently point to a bottom in real estate transactions at the beginning of April 2020, we are watching for signs of either a renewed contraction or other indicators of a slowing recovery. We are also monitoring the results of ongoing epidemiological studies showing the efficacy of efforts to help curb the spread of the coronavirus and early economic reopening efforts, to help inform us on the likely speed and shape of a recovery. We are also monitoring and commenting on macrofinancial data including corporate bond spreads, mortgage rates, implied volatility and delinquency rates for signs of unexpected weakening. Widespread deterioration in these and other key data risks the economy landing closer to a 2008-style financial crisis scenario, on top of the direct effects of the pandemic.
On top of the broader economic dangers, there are also a number of public health and/or policy risks that, if worsened, might warrant an adjustment of our probability weights and possibly the creation of a more pessimistic scenario to consider. These include:
- A relative lack of coordination between states in their plans to reopen their respective markets, risking the introduction of state-to-state disease transmission, false restarts, risks of new outbreaks and a deeper/longer downturn.
- A continued shortage of testing and personal protective equipment (PPE), limiting the ability to track and contain the virus’s spread and placing continued stress on the health care system.
- Ineffective or insufficient federal fiscal relief efforts, resulting in a larger-than-expected impact to labor and financial markets and threatening state balance sheets.
- As-yet-unquantified risks to the balance sheets of households (people’s ability to pay their debt obligations, willingness to resume normal spending activity) and businesses (how many businesses close and/or resume activity with lower employment?).
- Ineffective relief in the mortgage industry.
Charting the Trends in the Current Housing Market
By Alina Ptaszynski, Redfin, April 30,2010
In our weekly market update, Redfin reported home-buying demand continued to recover last week, as states began making plans to begin to reopen businesses. Here are five additional charts that illustrate the latest developments in the housing market as the world continues to grapple with the coronavirus pandemic. Additional charts and local data are available for download in the Redfin Data Center.
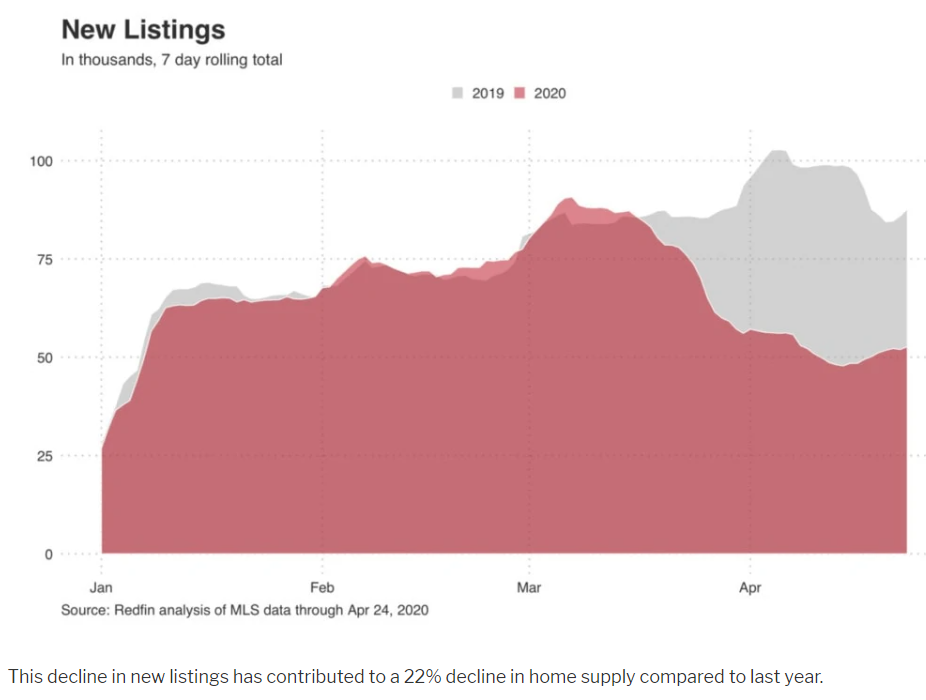
Sellers Continue to Hold Off on Listing
There were almost 53,000 new-home listings last week, down about 40% from a year ago. That’s an improvement from the 50% decline we reported last week. The improvement may be partly due to the Easter holiday falling around this time last year. Looking over the past four weeks, new listings are down 45%, with just 210,000 new homes put on the market. The five preceding years averaged 378,000 new listings during the same period.
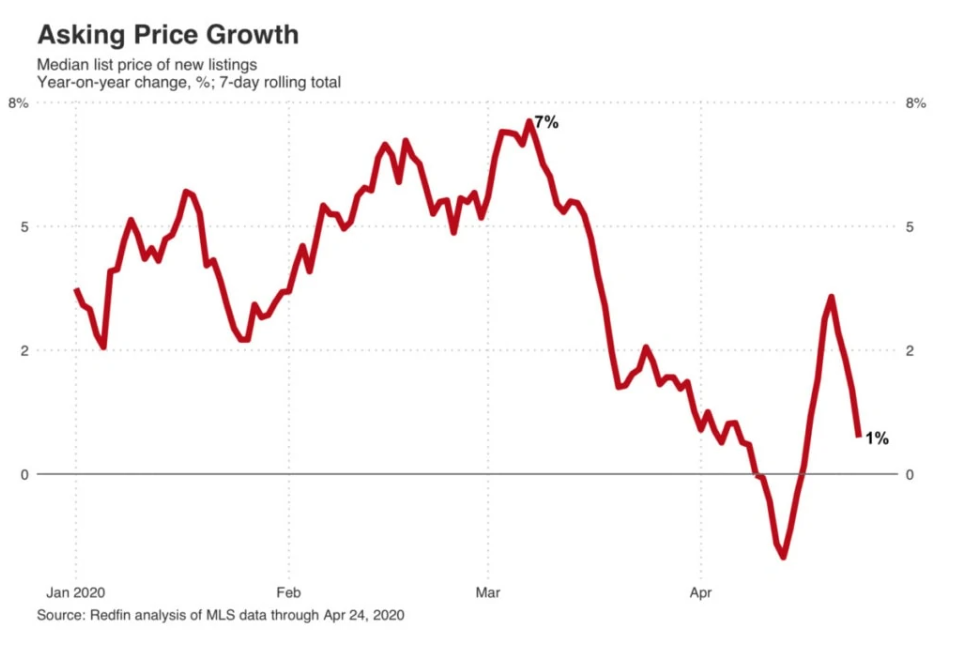
Price Growth is Now Nearly Flat
Last week the median listing price was $308,000, up just 1% compared to the same period the prior year. The week prior, we reported that asking-price growth had stopped its rapid descent and reversed course, increasing 3% year over year. Redfin lead economist Taylor Marr says, “Asking prices may be settling into a flat trend line for now. The primary reason for the shift over the past month though hasn’t been an increase in sellers listing below their Redfin estimate, but instead fewer higher-end properties coming to the market—bringing down the average.”
While Redfin agents are still seeing bidding wars, competition has slowed, giving some buyers a chance to negotiate a better price. In the previously red-hot sellers’ market of Seattle, Redfin agent David Palmer says buyers are now able to be a little more aggressive. “There’s fear on both sides. We have a bunch of buyers who want $40,000 price reductions or credit that really should have been $15,000 to $20,000. We’re calling it the ‘coronavirus credit’. I’d say it is getting a little closer to a level playing field, but sellers know that inventory is low and they’re trying to stick to their guns.”
Sellers Aren’t Dropping Prices
While sellers may be more willing to negotiate, they aren’t dropping their prices. Just 3% of homes on the market had a price drop last week, which is the same as last year and below the average in January and February of 4%.
“Sellers are opting to delist and wait for a more favorable market rather than take a haircut on the price,” says Marr. Sellers who do reduce the price are dropping it by an average of just 1.6% compared to 3.3% last year. “This may be a sign that sellers are using a price drop as a strategy to drum up new interest in the home. They worry buyers overlooked their home in the early coronavirus panic and know that a price drop triggers a notification to be sent to buyers who have a saved search.”
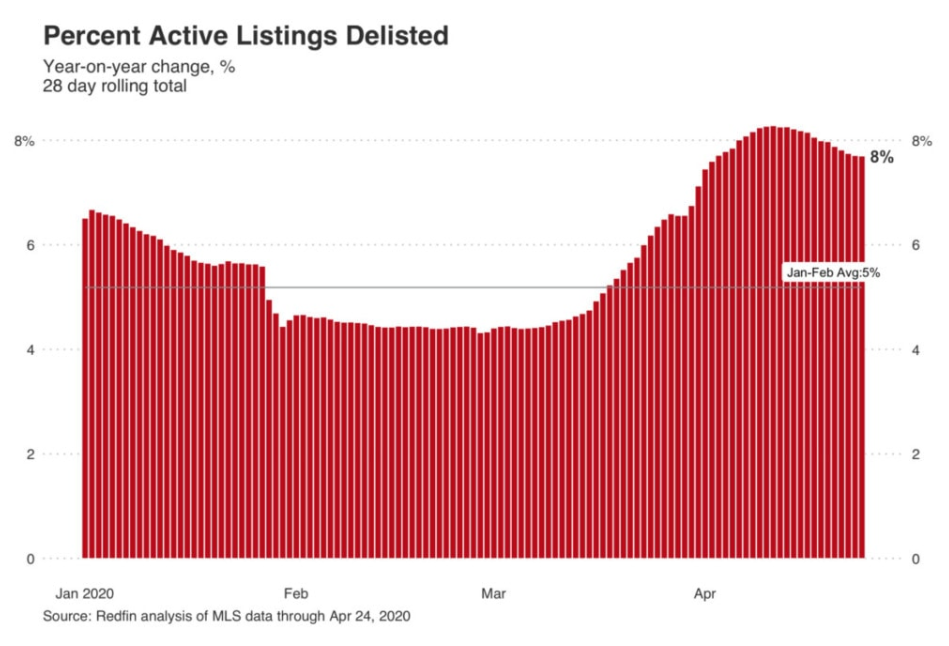
Sellers Continue to Pull Homes Off the Market
In the four weeks ended April 24, 8% of active listings were pulled from the market. While we appear to be past the peak of delistings, sellers are still removing their homes from the market at a significantly higher rate than they were at this time last year. During the week ended April 24, delistings rose 56% year over year to 15,900 homes, down from the peak of over 100% during the final week of March.
Pending Home Sales Drop to Lowest Level Since 2011 as Coronavirus Takes Its Toll
By Jacob Passy, Realtor.com, Apr 29, 2020
The numbers: The index of pending home sales dropped 20.8% in March as the coronavirus pandemic took a significant bite out of real-estate activity, the National Association of Realtors reported Wednesday.
This represented the lowest level of pending sales since 2011.
The index measures real-estate transactions where a contract was signed but the sale had not yet closed, benchmarked to contract-signing activity in 2001. It serves as an indicator for existing-home sales reports in the coming months.
What happened: Compared with March 2019, signings were down 16.3% nationally.
On a monthly basis, pending sales dropped in every region with the West seeing the largest decline at 26.8%, followed by the Midwest (down 22%) and the South (19.5%). In the Northeast, contract signings only decreased 14.5%.
The big picture: While the coronavirus outbreak has not caused real-estate activity to stop entirely, it has put a major damper on what economists had anticipated would be a strong spring home-buying season thanks to low mortgage rates and pent-up demand among buyers. Without the spring home-buying season, home sales are expected to drop 14% in 2020.
“As consumers become more accustomed to social distancing protocols, and with the economy slowly and safely reopening, listings and buying activity will resume, especially given the record low mortgage rates,” said Lawrence Yun, chief economist at the National Association of Realtors. “The usual spring buying season will be missed, however, so a bounce-back later in the year will be insufficient to make up for the loss of sales in the second quarter.”
With stay-at-home orders and social-distancing guidelines in effect for most of the country, the process of buying a home (and then moving) has become more complicated. Nearly one-fifth of Realtors said that stay-at-home orders made it nearly impossible to finish deals, according to a recent poll by the National Association of Realtors. (Another 40% of Realtors meanwhile said some aspects of the home-buying process still required in-person interaction, but that wearing masks and gloves could make it safer.)
Amid these orders, open houses have gone virtual, and documents are now being signed in parking lots rather than the offices of title insurers and attorneys. In some parts of the country, the closure of government offices means that sales cannot be recorded as quickly as usual.
Some would-be sellers have held off on listing their homes, worried about a potential dip in prices or demand. Between the first and last weeks of March, the number of new listing was down 30%, according to data from Realtor.com. Comparatively, the number of listings grew by 15% during that same stretch of time last year.
What they’re saying: “New listings continued to fall in April, as COVID-19 concerns prompted sellers to wait, which means additional declines in pending and closed home sales are likely ahead,” said Danielle Hale, chief economist at Realtor.com. “Although fewer buyers signed contracts to buy as they stayed home to prevent the spread of COVID-19, surveys suggest that most home buyers expect just a few months delay in their journey.”
“How infection rates respond in states reopening will be a telling sign as we move forward on how long we can expect a slump in sales to persist,” said Ruben Gonzalez, chief economist, Keller Williams. “If we see no resurgence in infections, we could see sales begin to stabilize in early June; however, if there is a resurgence in infection rates, a substantial backslide across all sectors of the economy is likely.”
Market reaction: The Dow Jones Industrial Average and the S&P 500 were both up in Wednesday morning trading in spite of the downturns in pending home sales and GDP. The yield on the 10-year Treasury note was down slightly.
Coronavirus eviction ban: What Bay Area renters and landlords need to know
By J.K. Dineen, SF Chronicle, April 9, 2020
With many Californians facing economic distress because of the coronavirus, state officials have taken steps to block evictions and protect renters. Here’s what Bay Area tenants and landlords need to know.
Answers for renters
Q: Can my landlord evict me while the health emergency is in place?
A: No. On April 6, state judicial leaders barred courts from enforcing eviction orders against renters. In ruling that eviction orders “threaten to remove people from the very homes they have been instructed to remain in,” the state Judicial Council went a step further than a March 27 executive order by Gov. Gavin Newsom, which required a statewide, two-month halt on evictions of tenants who could not afford to pay rent because of the coronavirus pandemic. The action halts legal procedures used by property owners to initiate and enforce evictions.
Q: What sort of evictions does the ruling cover?
A: The ruling applied to all evictions, regardless of cause.
Q: How long with the ruling be in effect?
A: The order will remain in effect until 90 days after Newsom declares an end to the current state of emergency. That’s likely at least through July.
Q: What if I was served an eviction notice before the Judicial Council order went into effect?
A: Tenants who were served with a eviction court summons prior to the new order cannot be penalized for failing to respond, unless they pose a public danger. For tenants who have already responded, trials are postponed for at least 60 days.
Q: What happens when the order is lifted? How soon will my rent be due?
A: It’s unclear. While these emergency rules effectively put evictions on hold at least through the summer, they do not “establish any new tenant rights or defenses to an eviction, address requirements for notifying landlords or providing documentation when tenants are unable to pay rent due to loss of income or other coronavirus-related reasons, or address how repayment will be handled,” according to the San Francisco Tenants Union. It is likely the state Legislature will address those issues when it returns in May.
Q: Can my landlord raise my rent during the health emergency?
A: It depends on the city. San Francisco Supervisor Aaron Peskin introduced legislation on April 7 that would freeze rent increases and pass-throughs. That legislation passed. The San Francisco Apartment Association has already asked its members not to raise rents during the health emergency. Some cities have also enacted rent freezes. Concord has enacted a rent freeze for most people. Oakland has has capped rent increases at 3.5% in most cases and landlords can’t charge late fees.
What Your Real Estate Agent Wants You To Know About the Housing Market Right Now
By Ana Durrani, Realtor.com, Apr 29, 2020
Spring is typically a busy time for buying and selling homes, but the coronavirus pandemic has pushed homeowners and shoppers into new, uncharted territory. Shelter-in-place orders and concerns about contagion have forced many real estate agents to cancel open houses, while unemployment is at a historically high level.
But even in the midst of a deadly pandemic that is devastating the economy, many Americans still want or even need to buy a home in the near future.
“I definitely have clients that are still interested in viewing homes but have been honest that they won’t put pen to paper and write an offer until they know the health crisis has passed and they can assess the impact on real estate and the economy,” says Noah Grassi, a Realtor® for Compass in San Diego.
So, what does the current state of the housing market mean for buyers? With so much uncertainty these days, buying—or planning to buy—a home during a pandemic requires extra careful consideration. That’s why we reached out to real estate agents to get their honest takes on what’s really happening in the housing market in the time of COVID-19, how buyers can prepare, and what we can likely expect when the pandemic subsides.
There may be some reductions in home prices
The federal government has provided relief through cash payments, and lenders are also offering mortgage forbearance options. But with unemployment numbers rising, more people could be forced to sell their homes or enter foreclosure, potentially leading to reductions in home prices.
“Due to millions of job losses per week, and the long-term impact of COVID, I expect housing prices to shift into a downward trend,” says Justin Brennan with Brennan Real Estate Group, Pacific Sotheby’s International Realty. “To what extent they go down will be determined by how many job losses become permanent versus temporary.”
If the price cuts materialize, that would be good news for buyers in locations where affordability was already stretched thin.
More homes will come onto the market
A bigger inventory of homes on the market may soon be on the horizon for buyers.
“There’s an inventory of sellers on the sidelines, and it is growing every day,” says Grassi. “These are owners that still reside in their property and don’t want strangers—agents and potential buyers—walking through their home at the moment due to the health crisis. Once it is clear the risk is minimal, I think we are going to see a big increase in the number of homes for sale.”
There’s a chance that buyers are also waiting in the wings for the coronavirus pandemic to end and the economy to get back on its feet. But the likely big inventory of homes for sale could put buyers in a good position.
Interest rates are likely to stay low
Over the past few months, mortgage interest rates have been lower than we’ve ever seen. And experts expect that trend to continue.
“The general consensus of the experts is that mortgage interest rates will remain attractive for many months to come,” says Grassi. “If buyers are hoping to try to find a deal on their mortgage during this health crisis, they should be writing offers now.”
If low mortgage rates and being stuck indoors have convinced you it’s time to find a new home, this may be a time to consider buying.
Keep in touch with your mortgage lender
Serious buyers should always have their mortgage lender on speed dial, but in these unprecedented times, this advice is more relevant than ever.
“Make sure you are constantly speaking with your lender on updates in the lending market,” says Brennan. “If you fall in love with a home, focus on the long term and getting a great interest rate and payment versus trying to time the market.”


