


 Facebook
 X
X
 Pinterest
 Copy Link

September 30, 2020 – Real Estate Market Numbers
By Glen Bell (510) 333-4460
Here’s a quick summary of what’s going on in the San Francisco East Bay real estate market as of September 30th.
I’d like to start out with a quick quote coming from Zillow and Rismedia:
“More sellers are making their way onto the market, but it’s still not enough to offset a supply shortage as a frenzy of buyers look to take advantage of low interest rates. According to Zillow’s most recent Weekly Market Report, buyer demand is still outpacing new supply.”
Yes, sales are up. Pendings are up by 30% compared to last year. Inventory on the other hand is down. It’s been flat over the last 5 months. Based on normal seasonal influences, we typically see a steady increase from the beginning of the year through to the end of September. Since May 1st our inventory is actually down by 2.7%. In fact, it’s the lowest I’ve seen for a September since I started tracking statistics going back to 2008. I’ve made this same statement each month since May. We have a 36 day supply of homes for sale today. Last year at this time, there was a 48 day supply.
Although there was a big “pause” in the market mid-March through mid-May due to COVID-19 Shelter in Place, we’ve bounced back, picking up where we left off early spring in what now looks like a strong sellers’ market again.
You can see this based on the supply and demand ratio that I keep track of. We’re at 1.51 indicating a “sellers’ market.” Last year at the end of September, we were .76. The year before that; .71. In fact this is the highest we’ve seen this number in September since our recovery began in 2012 and 2013.
Days on market are also starting to come down.
We’re seeing a bit of a migration coming out of SF and South Peninsula. Some movement to the East Bay, some to the Central Valley and some even out of the state altogether. This is primarily due to being able to work at home, high costs, smoke, traffic, etc
We’re seeing a softening in some of those markets plus rents have been coming down
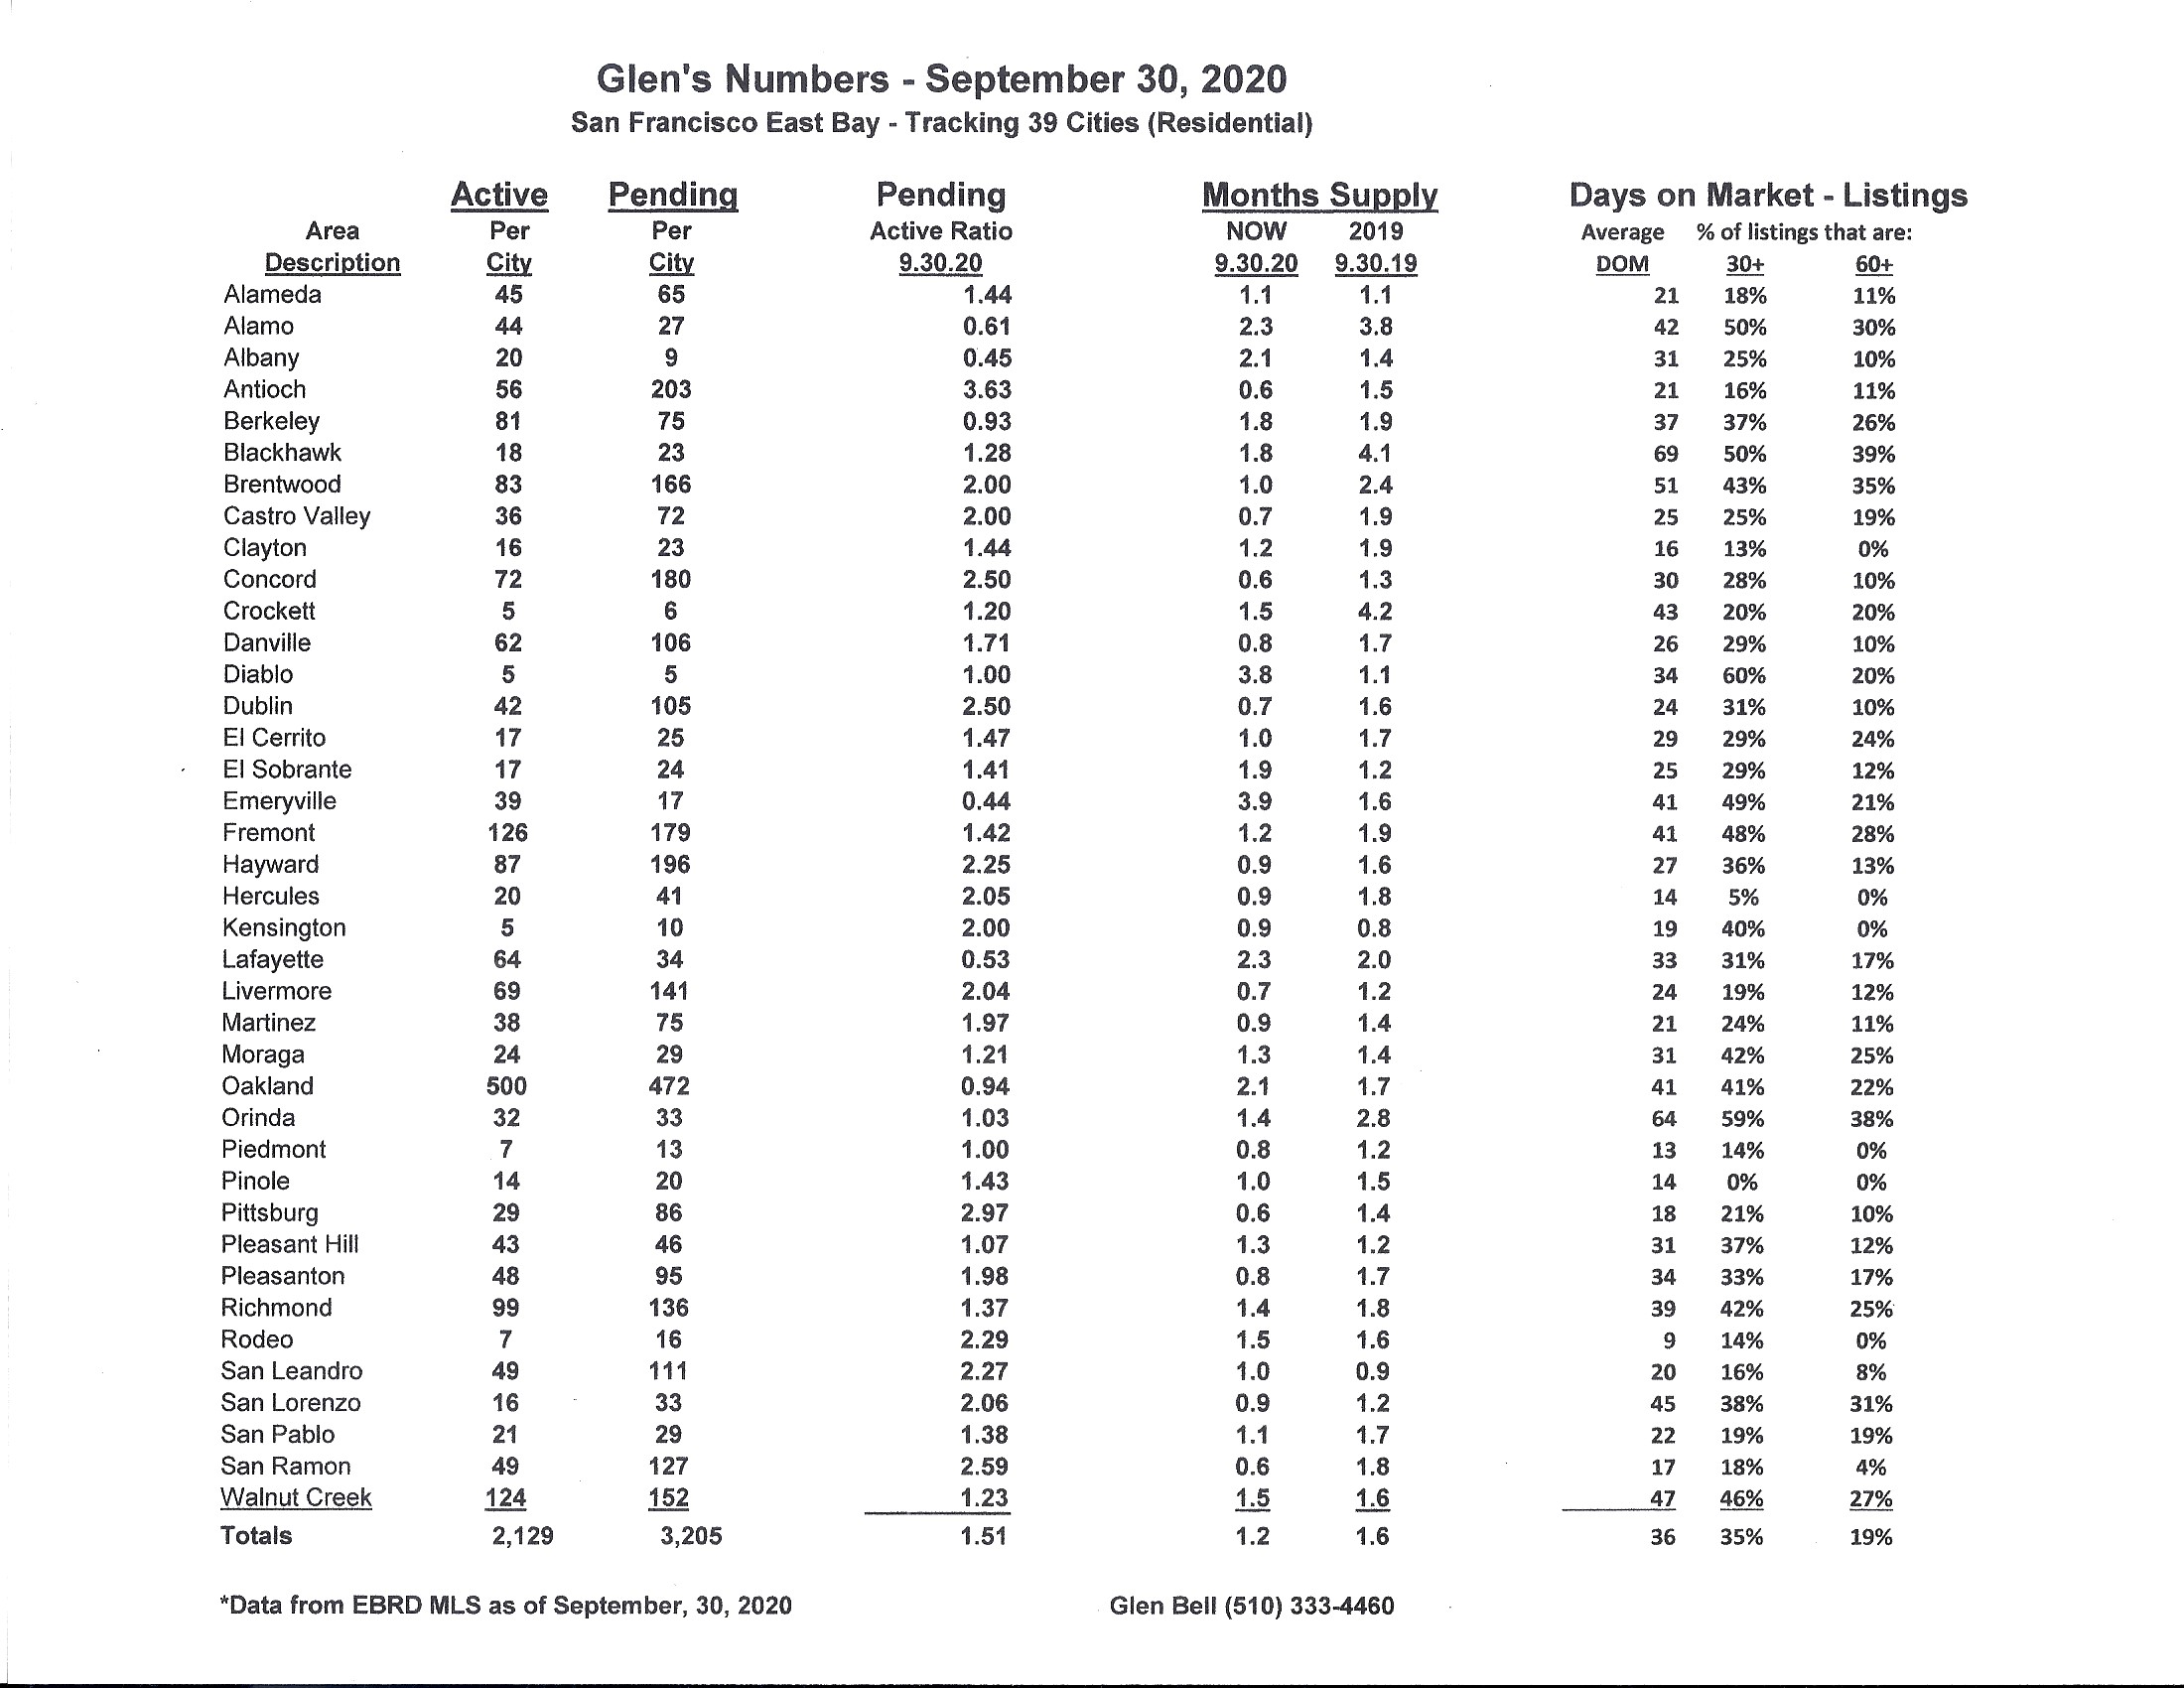
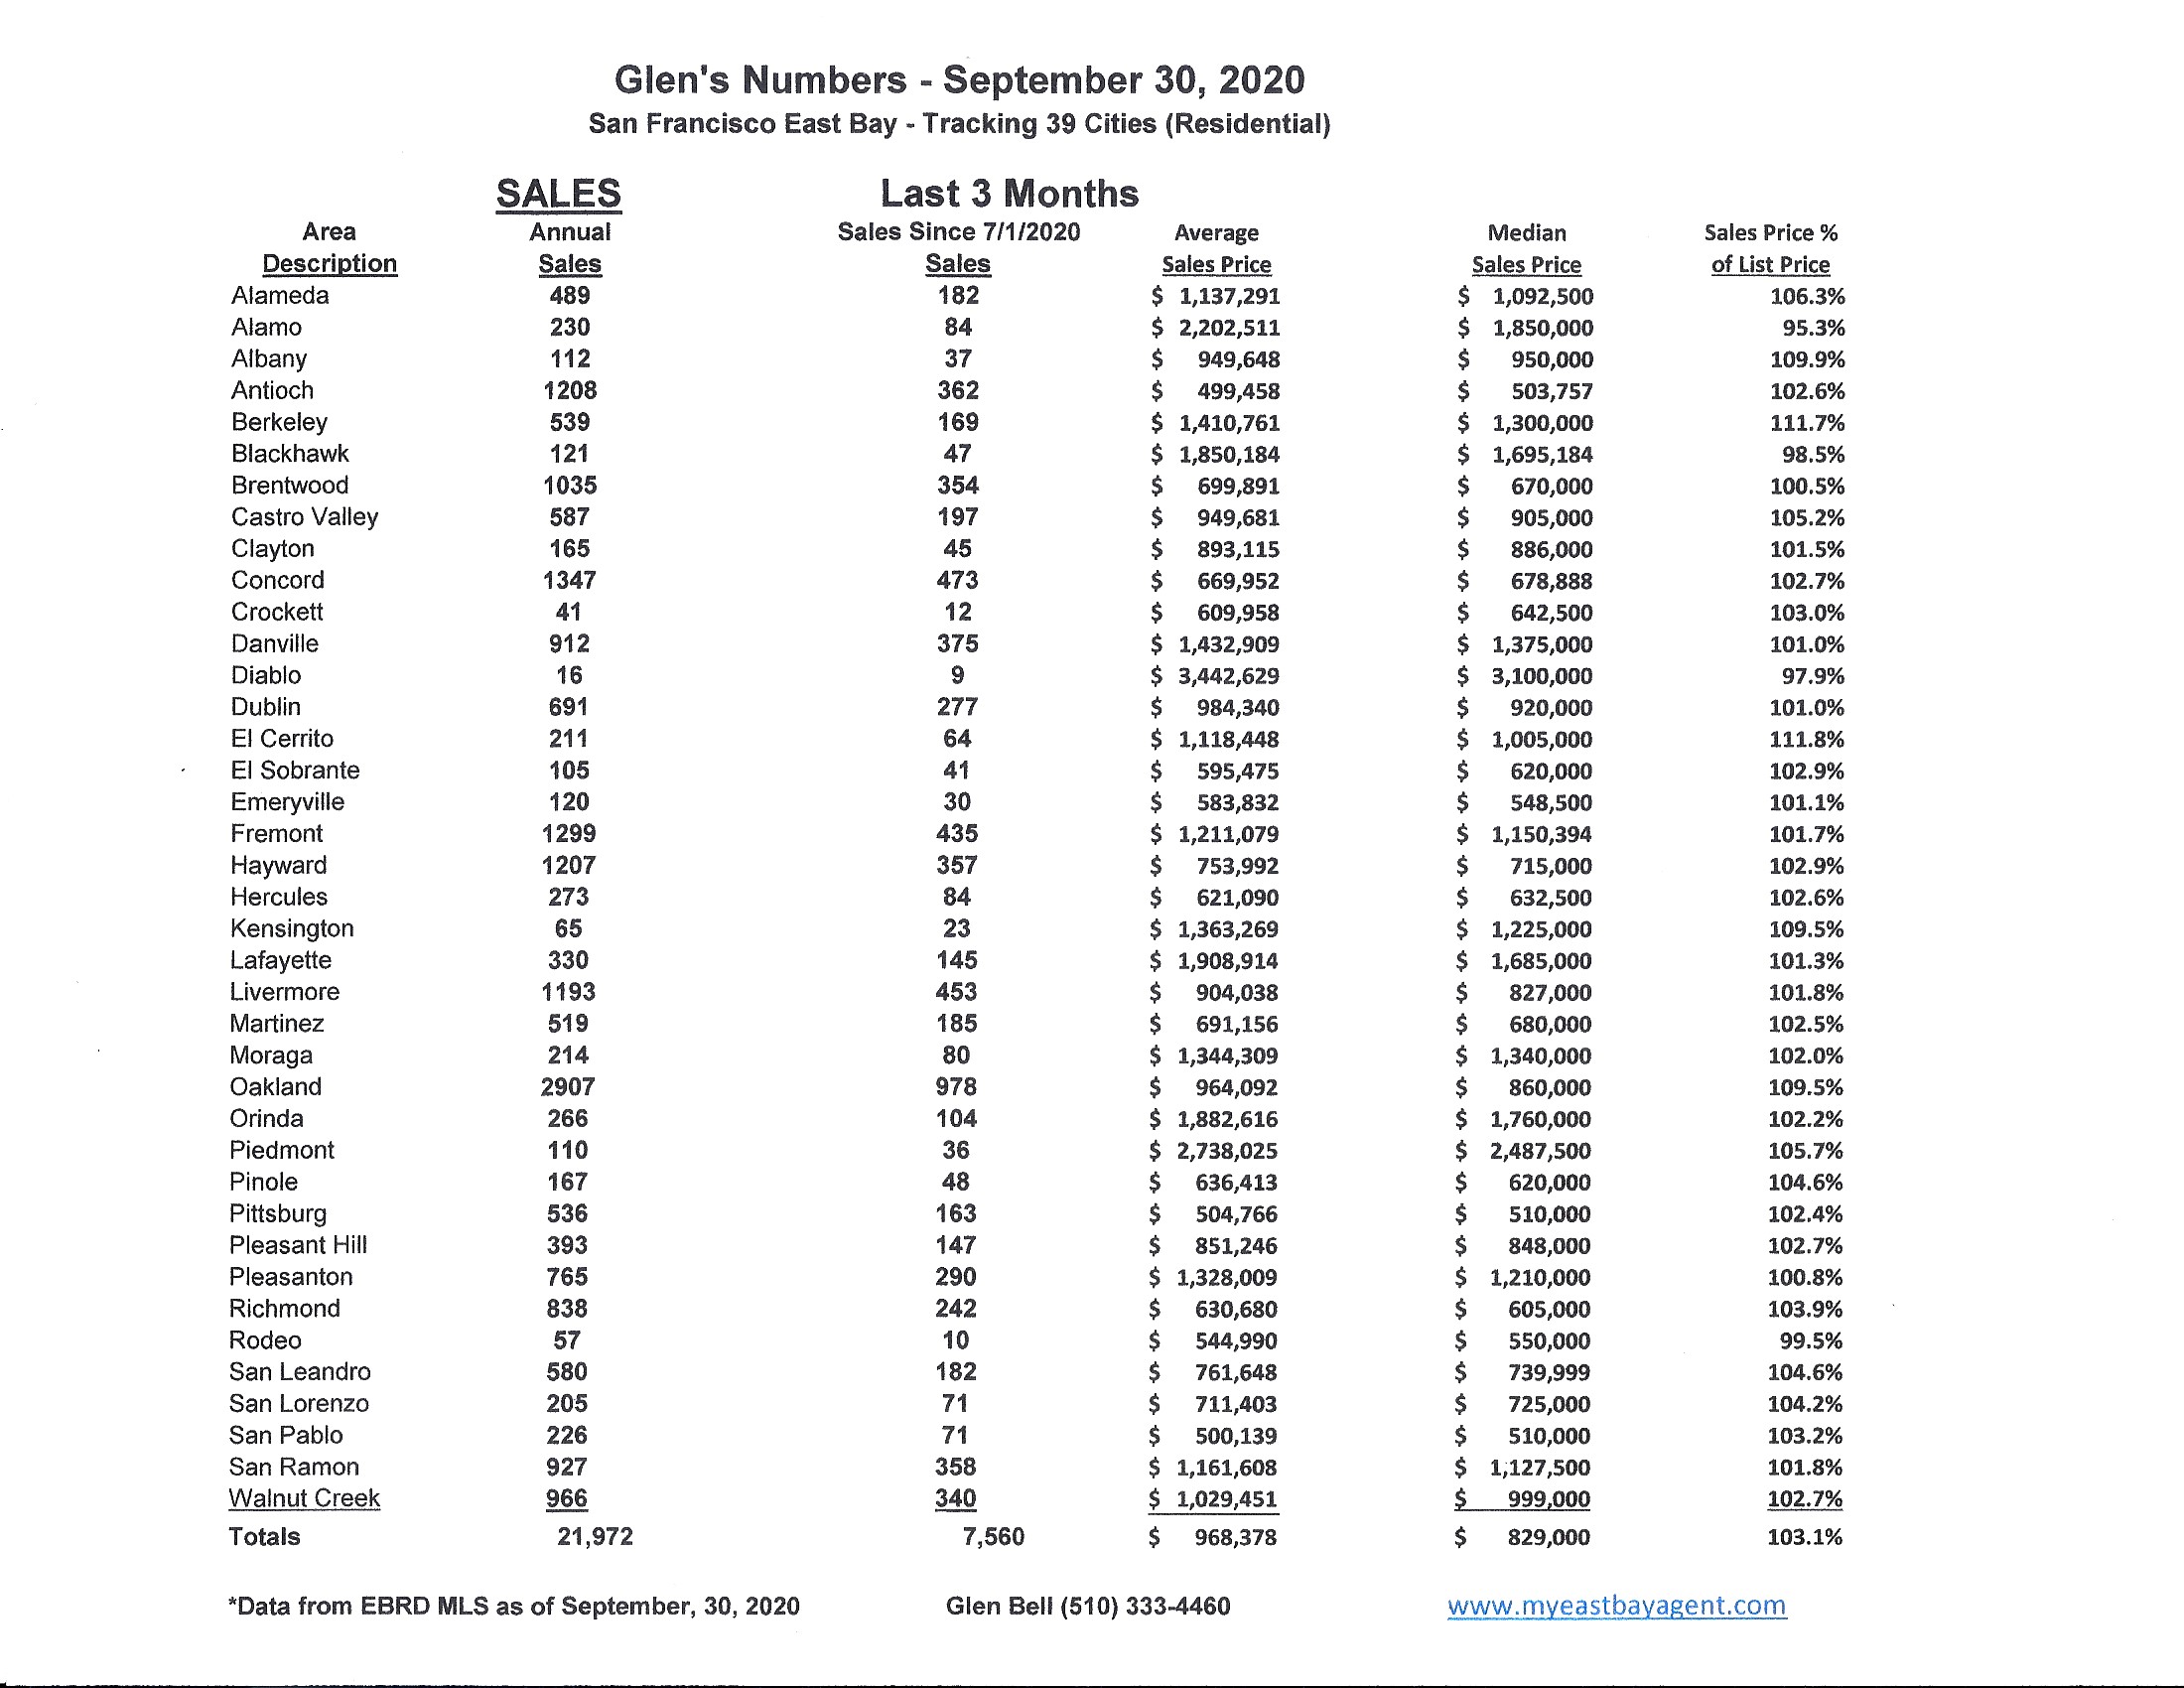
Here are some highlights for the 39 East Bay Cities that I track:
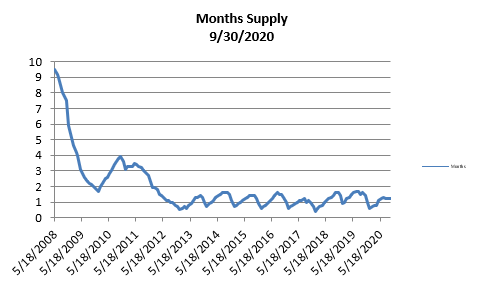
- The month’s supply for the combined 39 city area is 36 days. Historically, a 2 to 3 months’ supply is considered normal in the San Francisco East Bay Area. As you can see from the graph above, this is normally a repetitive pattern over the past four years. Supply is less when compared to last year at this time, of 48 days.
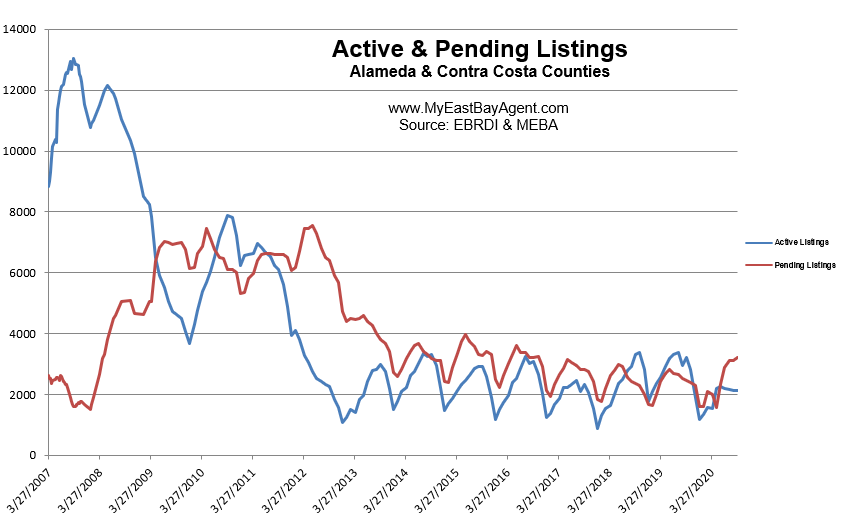
- Our inventory for the East Bay (the 39 cities tracked) is now at 2,129 homes actively for sale. This is fewer than what we saw last year at this time, of 3,226. We’re used to seeing between 3,000 and 6,000 homes in a “normal” market in the San Francisco East Bay Area. Pending sales increased to 3205, higher than what we saw last year at this time of 2,463.
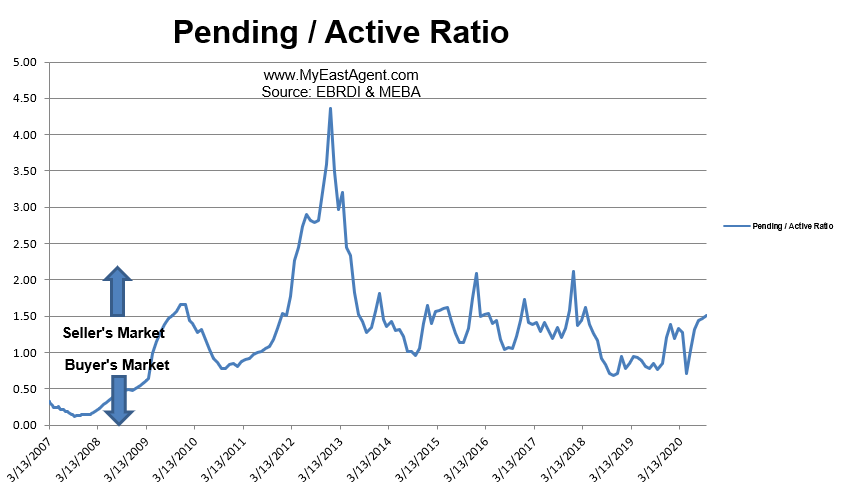
- Our Pending/Active Ratio is 1.51. Last year at this time it was .76.
- Sales over the last 3 months, on average, are 3.1% over the asking price for this area, Higher than what we saw last year at this time, of 2.7%.
Recent News
Bay Area home buyers scoop up shrinking inventory at furious pace
By Kathleen Pender, SF Chronicle Oct. 19, 2020
The Bay Area real estate market continued its roaring recovery in September, as buyers took advantage of ultra-low mortgage rates to scoop up a shrinking number of homes for sale at an astonishing pace.
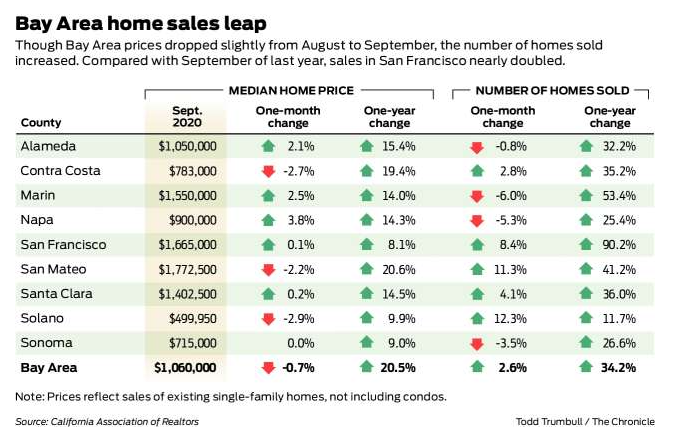
The median price for an existing, single-family home in the Bay Area was $1,060,000 in September, which was down 0.7% from August’s all-time high but up 20.5% from September of last year, according to a California Association of Realtors report issued Monday.
Statewide, the median price set a fourth consecutive monthly record, rising to $605,680, up 0.8% from August and 17.6% year over year.
More alarming for prospective home buyers: The median number of days it took to sell a California single-family home fell to 11 in September, the lowest number recorded since the association started keeping track in 1982 and down sharply from 24 in September 2019. In the Bay Area, the median time on market narrowed to 13 days in September from 15 in August and 23 in September 2019.
“Buyer demand remains robust. We see that in the mortgage applications, we see that in the price numbers for the Bay Area, in the unsold inventory numbers which declined. That is driving this rebound in sales, but it is also making the market more competitive. Homes are selling quicker and for buyers, there’s not a lot of inventory to choose from,” said Jordan Levine, the association’s deputy chief economist.
Agent Justin Palmer of Avenue 8 represented a family that is closing this week on a home in the Oakmore section of Oakland. It was listed at $1.2 million, attracted multiple offers and sold in less than two weeks for $1.45 million. It has almost 3,200 square feet so on a price-per-square-foot basis, “it was really good and it appraised for a higher number than they bought it for,” Palmer said.
The buyers had been renting in San Francisco. “Like most people, this year made them reevaluate their lives and preferences. They were seeking a little more space so they could both work from home and wanted more space for their young child,” Palmer said. The seller was a widow ready to downsize.
The sale epitomized what has been going on in the Bay Area. “Oakland in general this year has been on fire,” although condos are cooler than single-family homes. “We’ve seen such a large migration from San Francisco, people needing more space, whether that’s outdoor space or room for a second office,” Palmer said. The pandemic has absolutely pulled sales forward. “I think a lot of people’s five-year plans were condensed into 2020.”
On a month-to-month basis, the median price paid for a home in September fell in Solano, Contra Costa and San Mateo counties, (down 2.9%, 2.7% and 2.2%, respectively), and rose in all other Bay Area counties, led by Napa and Marin (up 3.8 and 2.5%, respectively).
Year over year, prices rose in all Bay Area counties, ranging from 8.1% in San Francisco to 20.6% in San Mateo.
Sales remained brisk, up 2.6% month-to-month and 34.2% year over year. They were especially strong in San Francisco and Marin counties, up 90.2% and 53.4% respectively, year over year. The report includes sales of existing, single-family detached homes advertised on a Multiple Listing Service. It excludes new construction and condominiums, which make up a larger percentage of sales in San Francisco than in other counties.
Condos, especially in the city’s downtown and South of Market areas, have been arguably the weakest spot in the Bay Area as buyers have cooled on communal, high-rise living during a pandemic. However, separate data from the Realtors association shows that San Francisco condo sales in September were up about 30% from August and 63% from last September, not as robust as single-family home sales but hardly a slowdown. The median price paid for a San Francisco condo in September was about $1.2 million, down 4.2% from August and down 7.8% year over year.
Condos were “more of a mixed bag,” with a “big increase in sales even as the price has softened,” Levine said.
For the Bay Area as a whole, condo sales last month were up 11% from August and 36% from last September while prices rose 2.5% and 6.4%, respectively.
“We do see more weakness on the rental side of the market due to the nature of the downturn we are in, where the effects of this pandemic-related shutdown have been borne by folks at the lower end of the income spectrum,” who tend to be renters, Levine said.
That could deter some investors from buying lower-end properties to rent out, which could explain some of the relative weakness in condo pricing.
Sales in resort communities remained especially brisk in September as buyers unable to travel clamored for vacation homes, often where they could work remotely. South Lake Tahoe home sales increased 105.4% year over year.
Ultra-low mortgage rates and constrained supply, especially for lower-priced homes, have fueled price increases. The number of active listings statewide fell 56% year over year for homes priced at less than $1 million, compared to a 30.4% drop for those listed between $1 million and $3 million and a 19.4% decrease for homes over $3 million.
Mary Edwards, a Coldwell Banker agent in San Anselmo, said the market is still “going pretty crazy,” partly because “we didn’t have a true springtime like we usually have in February, March and April” because of shelter-in-place restrictions.
She and her business partner, Linda Gridley, listed a home on Paradise Drive in Tiburon in late September for $2.8 million. “We were marketing it as, ‘Have a resort in your own backyard staycation.’ It had a boat dock and a private beach,” Edwards said. More than 60 people, most from San Francisco, came to see it. “We took offers a week later and it closed in seven days, all cash, no contingencies” to a San Francisco couple for $3,088,888. “I know several clients who were going to buy a second home in Tahoe but decided to stick around and get a bigger place” in Marin.
“With the statewide home price hitting new highs for the past four months, it’s sounding like a broken record as California home sales and prices continue to outperform expectations,” the association’s chief economist, Leslie Appleton-Young, said in a press release. “However, with the shortest time on market in recent memory, an alarmingly low supply of homes for sale, and the fastest price growth in six and a half years, the market’s short-term gain can also be its weakness in the longer term as the imbalance of supply and demand could lead to more housing shortages and deeper affordability issues.”
California home prices to grow more slowly next year, Realtors forecast, but sales may be stronger
Kathleen Pender, San Francisco Chronicle, Oct. 13, 2020
Ultra-low mortgage rates and pent-up demand for single-family homes will offset continued economic uncertainty and a supply shortage in 2021, with the net result being a 3.3% increase in California home sales and a modest 1.3% increase in the median price next year versus 2020, according to a California Association of Realtors forecast published Tuesday.
With only a few months left to go, sales this year are expected to be 4.5% lower than last year but prices are likely to be 8.1% higher. Last year at this time, the association predicted that 2020 sales would increase 0.8% and prices would rise 2.5%, but that was before the coronavirus pandemic upended forecasts of all kinds.
Sales this year were weaker than expected mainly because shelter-in-place orders brought the real estate market to a near standstill for several months starting in March, although sales have since rebounded.
“Prices were a lot stronger (than anticipated) because we were not forecasting mortgage rates to go down to 2.8%,” said Jordan Levine, the association’s deputy chief economist.
Some of this year’s price increase was driven by sales of luxury and second homes. The median is the price at which half of homes sold for more and half for less, and can be influenced by a change in the mix of high- and low-end homes being sold. Robust sales of multimillion-dollar homes are “pumping up the median price,” Levine said. “The stock market came back a lot faster than the labor market. That enabled a quicker recovery at the upper end.”
It’s more evidence that pandemic “really had a disproportionate impact. People in professional services tend to be higher-income individuals and were able to carry on” better than people in lower-paying occupations.
In 2021, “we do expect the market to shift more toward owner-occupant, entry-level homes,” Levine said. That’s why price gains next year will be “a little more muted” than this year.
Rising interest rates could threaten affordability, but the association predicts that 30-year fixed mortgage rates will average 3.1% in 2021, down from 3.2% in 2020 and from 3.9% in 2019, and still low by historical standards.
The association’s forecast covers existing single-family homes, not condos or new construction. It did not break out forecasts for regions within the state, but San Francisco is expected to be the strongest in the state, according to Selma Hepp, deputy chief economist with CoreLogic.
She predicted that between August 2020 and August 2021, the median price of existing, single-family homes and condos will rise 7.8% in San Francisco and San Mateo counties, 6.9% in Santa Clara and San Benito counties, 4.5% in Alameda and Contra Costa counties, 2% in Marin County, 13.2% in Napa County and 0.6% in Sonoma County.
By comparison, she expects prices will be 5% higher throughout California and flat nationwide.
One reason the Bay Area will do better than most is because it has a lower percentage of homes in forbearance and higher average homeowner equity than most places.
Homeowners with government-backed mortgages who have a financial hardship because of the coronavirus can request a forbearance, which allows them to postpone payments, without incurring penalties, for up to 12 months. Next year, as their forbearance period expires, many will be able to work out a modification and keep their homes, but if they can’t, some may be forced to sell and that could put downward pressure on prices.
The more equity they have in their homes, the more options they will have, such as refinancing, Hepp said. The average homeowner equity in San Francisco and San Mateo counties is just over $1 million, she said. The statewide average in the second quarter of this year was $408,000, second only to Hawaii with $450,000 in average homeowner equity. The U.S. average was $185,000.
In September, economists with the UCLA Anderson School of Management said construction of new housing will be an area “of particular strength” in the California economy next year. They predicted “a quick recovery to pre-recession levels, with residential building permits almost back to their 2020 first quarter level by year’s end.”
Jerry Nickelsburg, director of the UCLA Anderson Forecast, said low interest rates, the state’s chronic housing shortage, pent-up demand and “some movement on the regulatory side,” making it easier to build new units, will encourage developers to build. By the fourth quarter of 2022, he expects permit issuance, for rental and owner-occupied housing statewide, will hit 130,000 units on an annualized basis, compared with an estimated 117,400 units at the end of this year and 110,000 units at the end of last year. That increase of about 12,600 units over the next two years includes the replacement of some homes destroyed by wildfires.
“That means an increase in demand for construction workers. That is a bright spot when some of our sectors that are lagging behind,” Nickelsburg said. “It’s not a barn-burner, but it’s a bright spot.”
Home Prices Up 14%, But Price Growth May Wane Soon
Redfin, October 5, 2020
he median home sale price increased 14% year over year to $319,769—the highest on record, according to a new report from Redfin (redfin.com), the technology-powered real estate brokerage. The 14% jump was the largest since August 2013. Since the four-week period ending July 5, home prices have increased 6.5%. Over that same period in 2018 and 2019, prices declined an average of 4.2%
Below are other key housing market takeaways for 434 U.S. metro areas during the 4-week period ending September 27.
- The median asking price of new listings was up 12.8% from a year earlier. This growth rate has been declining since the four-week period ending August 30, when it peaked at 15.7%.
- Pending home sales climbed 30% year over year.
- New listings of homes for sale were up 5% from a year earlier. Year-over-year growth in new listings have been above 5% since the four-week period ending August 16.
- Active listings (the number of homes listed for sale at any point during the period) fell 28% from 2019 to a new all-time low. The rate of year-over-year supply declines has remained consistent at this level for the past few months.
- 45.8% of homes that went under contract had an accepted offer within the first two weeks on the market. This has also held relatively steady for the last 17 weeks.
- The average sale-to-list price ratio, which measures how close homes are selling to their asking prices, rose to 99.4%—an all-time high and 1.2 percentage points higher than a year earlier.
- For the week ending September 27, the seasonally adjusted Redfin Homebuyer Demand Index was up 34.8% from pre-pandemic levels in January and February.
- Mortgage applications decreased 2% week over week during the week ending September 25. For the week ending October 1, 30-year mortgage rates fell to 2.88%. Rates have been below 3% since late July.
“The question on everyone’s mind is ‘how fast can prices keep rising?’,” said Redfin chief economist Daryl Fairweather. “Although the housing market is still red-hot, there are some early signs we may be nearing peak price growth. Sellers’ asking prices are still up significantly from last year, but by a lower rate than they were growing during the summer. Mortgage applications are also beginning to wane, and more new listings are coming onto the market. This is likely to be as good as it gets for home sellers, who definitely have had it very good for a very long time.”
Lack of strong growth in new listings is likely a direct result of the ongoing pandemic. In a recent survey of over 1,400 homebuyers and sellers, 20% of respondents said that now is a bad time to sell a home, up from just 9% in the first quarter of the year. In the same survey 38% of home sellers said that they have health or safety concerns due to the coronavirus pandemic, compared to just 8% of homebuyers who cited coronavirus as a concern.
People are leaving San Francisco. After decades of growth, is the city on the decline?
By Roland Li, SF Chronicle, October 10,2020
Plunging BART and Muni ridership. The weakest online sales tax collections in the state. A 20% drop in apartment rents. Spiking office vacancies.
PEOPLE ARE LEAVING SAN FRANCISCO. AFTER DECADES OF GROWTH, IS THE CITY ON THE DECLINE?
San Francisco’s bleak economic vital signs over the past six months strongly suggest residents are leaving amid record job losses, the entrenchment of remote work, and a coronavirus pandemic that shows no signs of ending.
It’s still unclear how many people have left, but moving vans and Medium posts tell the story of an ongoing migration. Weakness in the rental market and virtually flat online spending during shelter-in-place show that residents aren’t just staying home, they’re leaving, experts say. The city’s ability to attract new residents or lure old ones to return will be critical to avoid punching a giant hole in a local budget that has swelled to almost $14 billion.
In an increasingly virtual economy where daily goods are delivered not for convenience but out of pandemic-driven necessity, all you have to do is count the Amazon boxes.
Between April and June, the nine counties across the Bay Area saw big drops in brick-and-mortar sales taxes as orders to stay home took effect, ranging from a 17% drop in Santa Clara County to a 53% drop in San Francisco, compared to the prior year. But eight of the counties — everywhere but San Francisco — saw major jumps in online sales taxes, as high as 36% for Contra Costa County.
San Francisco saw only a 1% increase in the tax collected on online sales. That figure was by far the worst not only in the region, but among California’s 20 largest counties. Los Angeles County saw a 31% increase in online sales taxes, San Diego County saw a 38% jump and Sacramento County saw a 32% spike.
“That’s a sign to me that people aren’t here,” said Ted Egan, San Francisco’s chief economist.
The empty streets are reminiscent of the aftermath of the dot-com bust of the early 2000s, said Noni Richen, president of the Small Property Owners of San Francisco, an advocacy group.
Her members have former tenants who have left the city because, after losing their jobs or having classes shifted to online, they saw no reason to stay.
“There is a decline in occupancy,” Richen said. “They’re moving home to mom and dad or somewhere cheaper.”
Real estate data firm Zumper reported a 20% annual decline in San Francisco’s median one-bedroom rents this month, the largest drop among major cities. Inventory of for-sale homes and condos reached a 15-year high amid a flood of new listings, though prices for single-family homes are still rising, according to brokerage Compass.
One difference compared to the dot-com days is that tech titans like Google and Facebook, which have major offices in both San Francisco and Silicon Valley, have not cut jobs. Richen said she was encouraged that the companies have not scaled back, though they are allowing workers to stay remote until next summer.
“I think San Francisco will recover,” Richen said. “I think they will bounce back.”
Between February and August, the labor force in the San Francisco-Redwood City-South San Francisco metro area was down 4.5%, higher than the 4.1% drop for the state and 2.3% drop nationally. It’s consistent with evidence that urban areas have been hit harder than the rest of the country and could reflect people moving out of San Francisco, according to the Federal Reserve Bank of San Francisco.
Chris Thornberg, founding partner of research firm Beacon Economics, said talk of San Francisco’s doom and decline is overblown.
“As soon as the virus is under control, the economy is going to bounce back like nobody’s business,” he said, predicting a recovery in San Francisco by next spring. “I don’t think you need a vaccine.”
He said that excessive restrictions on business reopenings were unnecessary and ineffective. “I don’t think there’s any way to stamp this disease out by shutting down the economy,” he said.
But San Francisco officials remain cautious. There is still no timetable for when nonessential office workers can return. More tech companies — who now dominate the ranks of San Francisco’s largest private employers — are embracing remote work, for longer time periods or in some cases indefinitely.
“That opens up a huge question: When are they going to come back? Are they going to come back?” Egan said.
Bay Area rents keep plummeting, especially in S.F. — the latest data by city
By Kellie Hwang, SF Chronicle, October 2, 2020
Housing rents continue to decline in the Bay Area amid the coronavirus pandemic, especially in San Francisco, which has notoriously had the country’s highest rental prices after overtaking New York City years ago.
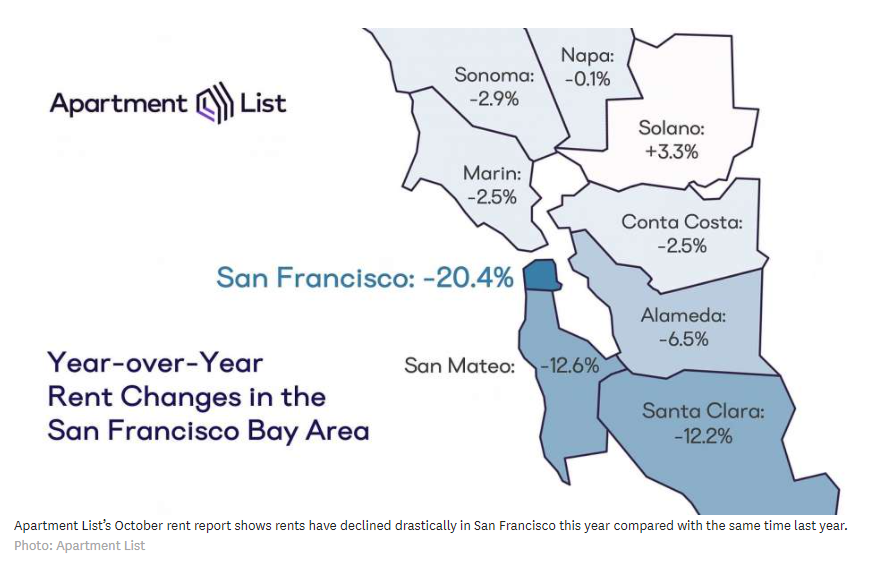
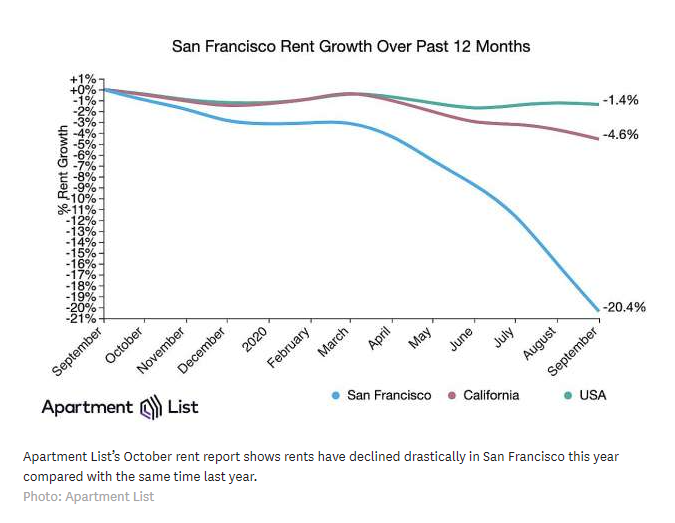
According to the most recent reports from private listing websites Apartment List and Zumper, rental prices have plummeted 20% in the city so far this year compared with the same time last year.
Zumper found the median cost of a one-bedroom in San Francisco last month was $2,830. The company analyzes rental data from more than 1 million active listings across the country. It includes new construction and excludes listings that are currently occupied or no longer available.
“Not only is this drop among the largest yearly decreases Zumper has ever recorded in our history of tracking rental prices, but it was also the first time the median one-bedroom price in San Francisco dipped below $3,000,” said data analyst Neil Gerstein in an email. “These combined trends show just how drastically the market has changed in the nation’s most expensive city to rent.”
Apartment List reported a considerably lower September median cost for a one-bedroom in San Francisco, at $2,240. The median for a two-bedroom apartment was $2,590, a 5.2% decline from the previous month. Its methodology differs from Zumper’s: It starts with statistics from the Census Bureau and Department of Housing and Urban Development, and it includes rents for older units and those in lower-income neighborhoods.
By either measure, the Bay Area continues to be the priciest market for renters in the nation. Zumper found that the top five rental markets in the country includes three Bay Area cities: San Francisco tops the list, with San Jose and Oakland coming in fourth and fifth, respectively.
San Jose’s rental prices haven’t changed much from last month at $2,230 for a one-bedroom, and decreased 1% for a 2-bedroom at $2,770. In Oakland, the median cost for a one-bedroom declined 3% to $2,130, and decreased 1% for a two-bedroom to $2,770.
Nationally, Zumper listed New York as the No. 2 most expensive rental market and Boston as No. 3. New York’s rents dropped 4% from the prior month to $2,600. Gerstein said that while New York City has also had historic price drops during the pandemic and renters appear to be taking advantage of declining rent in both cities, there is a notable difference.
“New York’s migration inflows have returned to pre-March levels, while San Francisco’s have not,” he said. “Both cities continued to experience large migration outflows, but the differences in the two cities’ migration inflows may explain their diverging price trends and could lead to rental prices in New York stabilizing faster than in San Francisco and overtaking the top spot.”
And nationally, Zumper’s report shows a decrease of 0.1% from the previous month for a one-bedroom to $1,231, with the year-over-year decline at 0.6%.
In the San Francisco metro area, Apartment List showed Oakland had the least expensive rents, at $1,770 for a one-bedroom and $2,090 for a two-bedroom.
A number of East Bay cities did not see much of a rent decline from the previous year: Pleasanton and Walnut Creek each decreased only 0.1%, and Hayward went down 0.9%.
High housing costs keep Californians poor
By DAN WALTERS | Orange County Register, September 20, 2020
Congratulations California, you’ve done it again.
The Census Bureau has once again found that California has the highest real-world poverty rate of any state, 17.2 percent over the previous three years and much higher than the national rate.
The “supplemental” poverty rate includes factors ignored by the outdated “official” poverty rate, such as living costs. And our sky-high living costs, particularly for housing, impoverish at least 7 million Californians.
We topped the poverty charts even as California’s overall economy was booming in the 2017-19 period. The state now is mired in its worst recession since the Great Depression, thanks to the COVID-19 pandemic, and poverty has surely increased.
A new report from the California Policy Lab at the University of California reveals that in August nearly 20 percent of California’s workers were drawing unemployment insurance benefits, calling it “startlingly high.”
Moreover, even before recession struck, the Public Policy Institute of California, using methodology similar to that of the Census Bureau, had calculated that as high as our “supplemental poverty rate” may be, roughly the same number of Californians are in “near-poverty.” Combining the two categories means that about a third of the state’s residents are struggling to keep their heads above water.
The major driver of California’s high poverty indices is, as mentioned earlier, that too many Californians must spend too much of their incomes on housing due to meager construction.
The reasons for the failure to meet housing demand are many but one long-ignored factor — the insanely high cost of building so-called “affordable” housing — is beginning to be recognized.
Last year, I wrote about a $28 million city-financed project to rehabilitate 74 dilapidated, low-rent apartments in Sacramento and noted that it worked out to $378,000 per unit, markedly higher than the median cost of a detached, single-family home in Sacramento at the time.
Last week, two more examples found their way into print.
The Los Angeles Times did a deep dive into the tortured history of a low-income housing project in Solana Beach, a wealthy seaside community in San Diego County. Times reporters found that it originally was to cost $414,000 per unit, but by the time the developer pulled out after a decade of trying to line up financing and permits, it had exploded to $1.1 million.
The Times called it “an alarming example of how political, economic and bureaucratic forces have converged to drive up the cost of such housing at a time when growing numbers of Californians need it.”
“California leads the nation in the cost of building government-subsidized apartment complexes for low-income residents,” the Times said, reporting that its “analysis of state data found that apartments cost an average of about $500,000. In the last decade, the price tag has grown 26 percent, after adjusting for inflation.”
Solana Beach is not alone. The Times reported that in Alameda, an island community in San Francisco Bay, a low-income development called Everett Commons cost $947,000 per unit.
Meanwhile, back in Sacramento, city housing officials are still spending too much to get too little. The Sacramento Bee reported that redeveloping the downtown Capitol Park Hotel into tiny, 250-square-foot units for low-income residents costs more than $445,000 per unit, higher than the median price for a detached single-family home. At $1,100 per square foot of living space, it is double what a luxury suburban home would cost.
These are outrageous numbers, driven by bureaucratic tangles, misplaced environmental restrictions and high mandated labor costs, and unless state officials do something about them, we will never solve our housing shortage and we will continue to have shamefully high rates of poverty.


