Facebook
 X
X
 Pinterest
 Copy Link

Glen’s SF East Bay Real Estate Market Update
July 31, 2020
As a reference in describing the market we’re in, I’d like to start by quoting Leslie Appleton-Young, the Chief Economist for the California Association of Realtors, from an issue in the July/August magazine.
“Since the pandemic hit the 2020 forecast has been a moving target. We are now monitoring market stats on a daily and weekly basis — waiting for the monthly sales and price report is not helpful in a market that is constantly changing. In a normal year we model demand and supply, making reasonable assumptions about the strength of the economy, frequently creating different scenarios to prepare, at least mentally, for exogenous factors. This year that has all been thrown out the window because just about everything is unknown. At the end of the day, the recovery in the economy is inextricably tied to the path of the virus, the relief response of the government and consumer behavior. In short, we simply don’t know.”
No doubt that the COVID-19 has had its effects on our local real estate market. We haven’t seen dramatic changes just yet. What we have seen is a “mixed” bag. Low inventory levels and low interest rates continue to be the story of this market.
What we’ve seen since COVID-19 began, is that many sellers decided to delay or postpone coming onto the market until some of the uncertainty subsides. Many buyers have jumped back on the fence and are holding off. The uncertainty of their job being in jeopardy, a loss in income, health fears, or seeing a “big hit” in their stock portfolio has taken its toll. Although there may be fewer buyers out there, there are still even fewer homes for sale. Many are getting gobbled up now.
The C0vid-19 market is such a “mixed” bag right now that it’s difficult to wrap your hands around it or even try to predict what’s coming down the pike. As I’ve said before; this is unchartered territory. Affordable homes in the right location that are in somewhat move-in condition seem to be getting the most attention. For a while, many buyers were reluctant to make big commitments on cash reserves for the “high end” market or big time fixers. That market seemed to be a little “soft” in many areas but now looks to be changing yet again. Buyers may also be shying away from the “close quarters” of the more expensive condos. However, the “right” house, in the “right” location will still experience a competitive market with multiple offers.
Income properties are more sensitive to risk aversion. Eviction moratoriums, rent reductions, local pre-tenant ordinances being passed, COVID-19 related payment deferrals, have all taken their toll and made these properties less attractive to buyers.
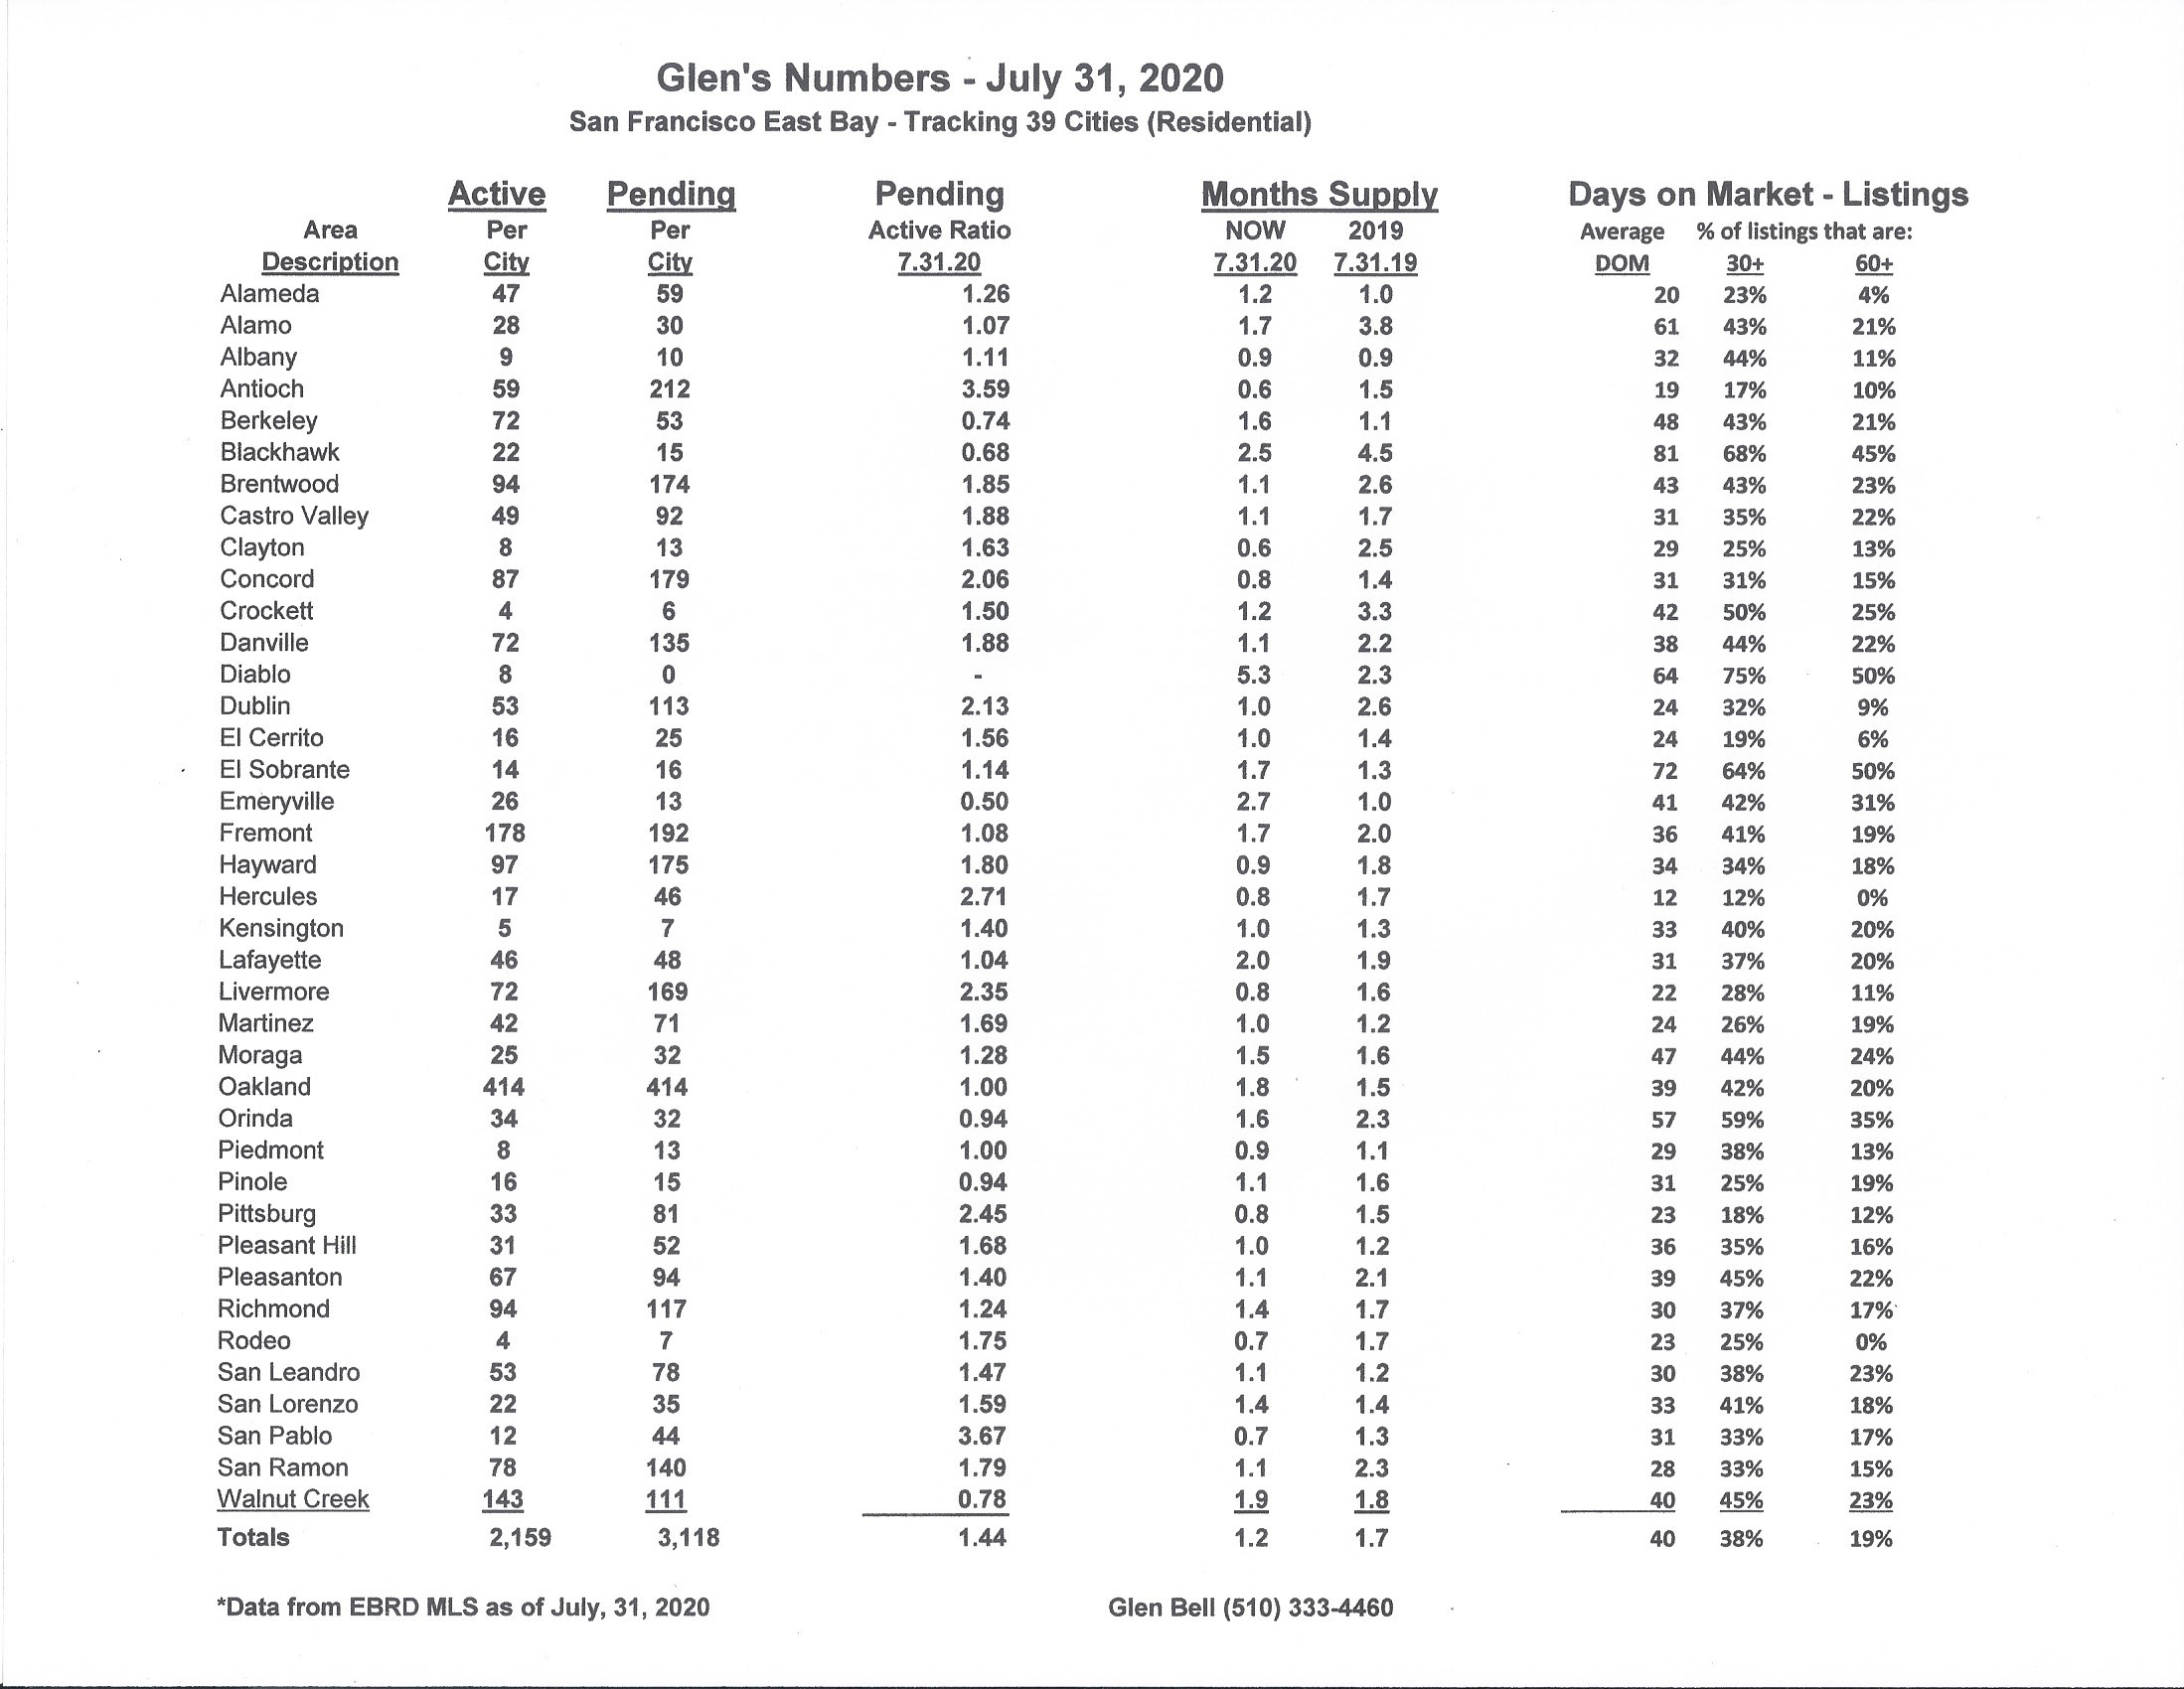
Here are some highlights for the 39 East Bay Cities that I track:
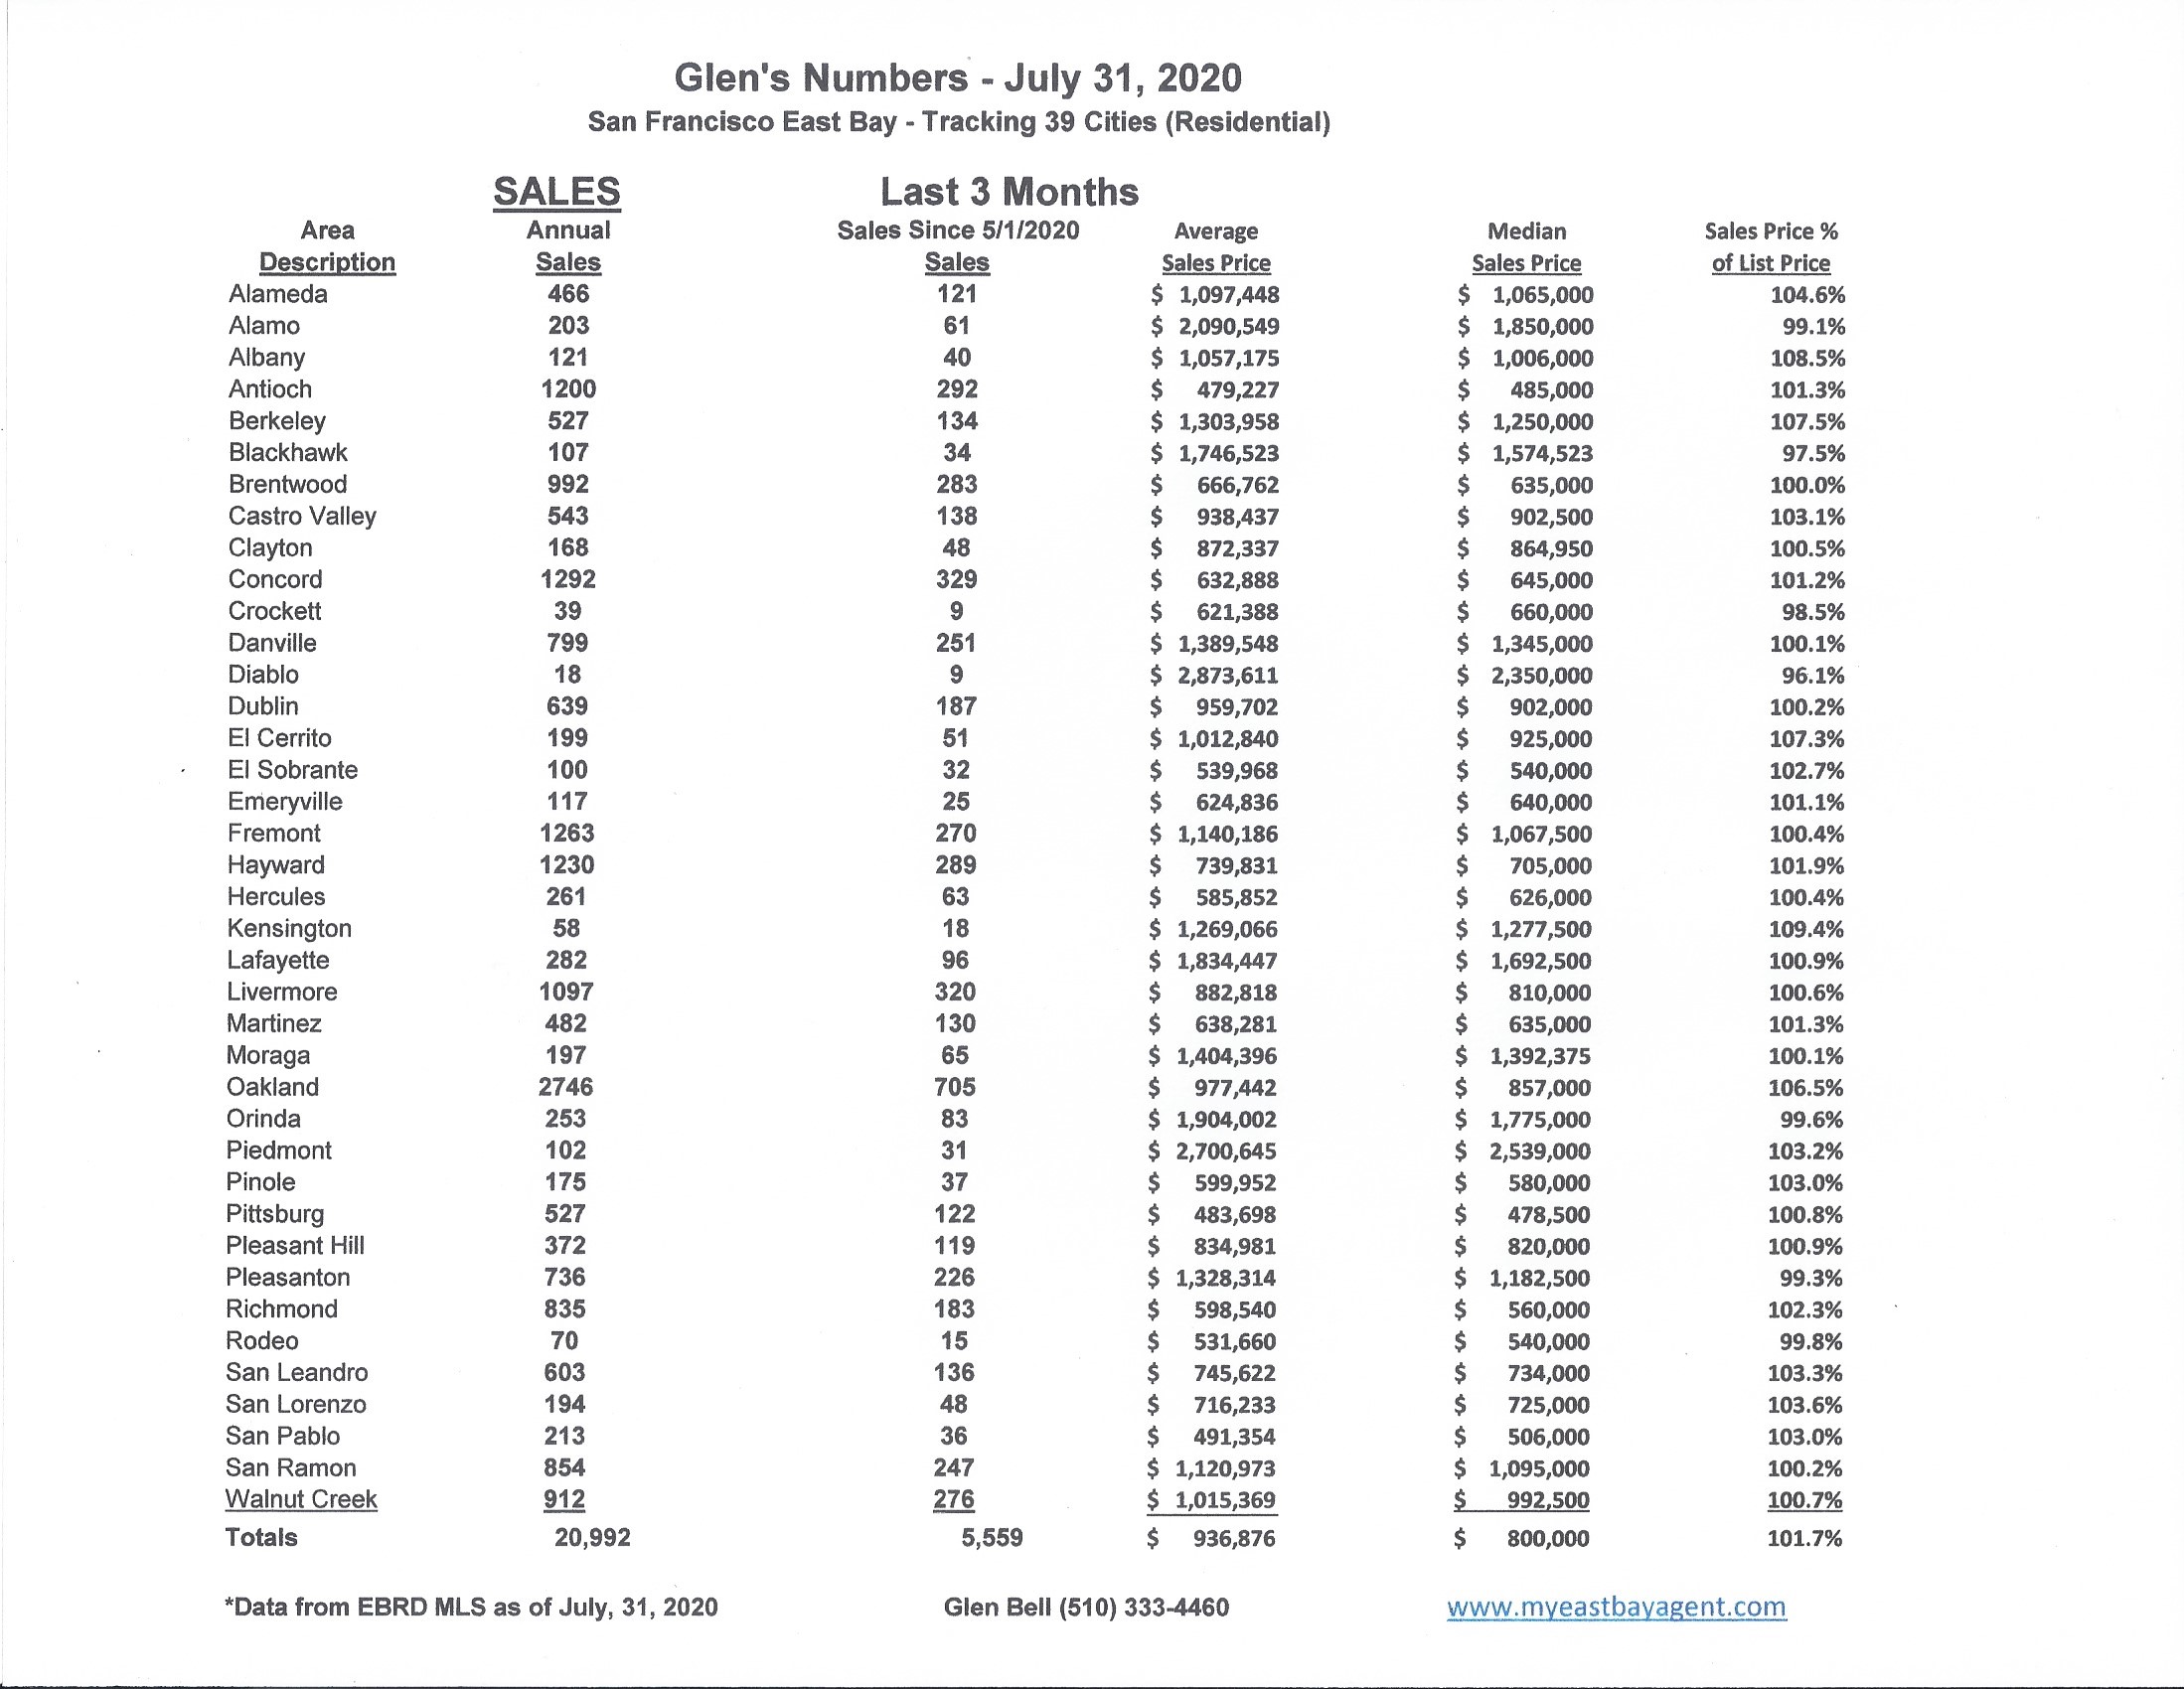
Sales are up from last month, but 23.3% lower than last year’s numbers. Prices have been up slightly through spring but are now beginning to flatten out during the summer months. More homes seem to be “sitting,” and taking longer to sell. We’re seeing more price reductions with more transactions falling out.
The seasonal drop in inventory followed our normal pattern during the holidays. We watched the number of homes decrease by nearly 60% over November and December. Last year was somewhat unusual because we saw a late season start and early season end. Inventory at the end of December was at its’ 2nd lowest level since I began tracking these 39 cities in 2006, with only 1163 homes for sale at the end of December. Our expectations normally are that new home listings begin to appear on the market as early as mid-January with a steady increase of inventory every month through to September, traditionally our high point.
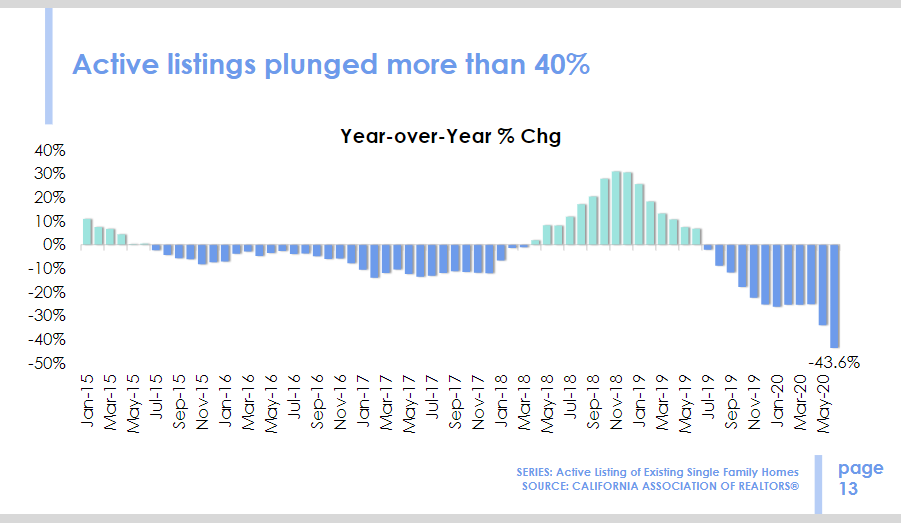
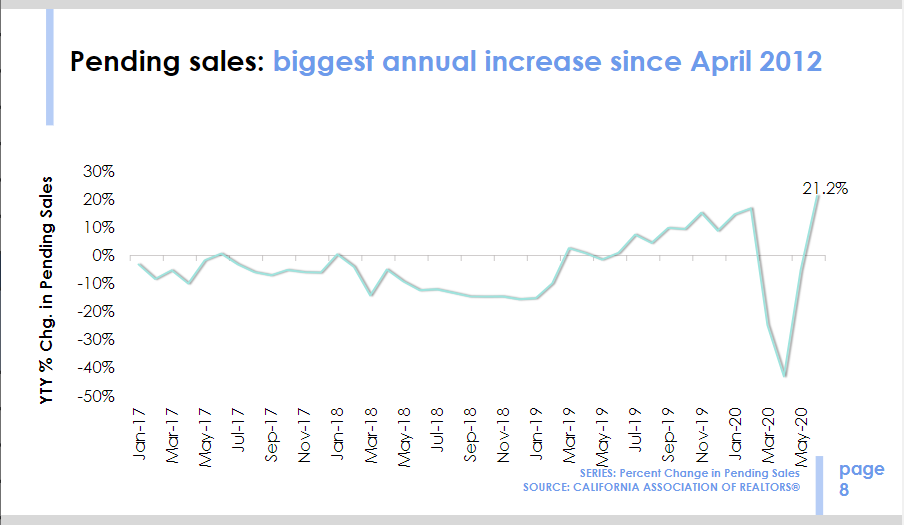
Inventory decreased slightly in July by 1.2%. This again, as in June, was unexpected. We normally expect to see more than that in both months. That’s 36.4% lower than what we saw last year at this time. This represents a 36 day supply of homes, compared to a 51 day supply last year at the end of July. This is the lowest I’ve seen for a July since I started tracking numbers in 2008. I’ve made this statement now three month in a row. The number of pendings improved by a 8.3.7% compared to June, a good sign that we still have buyers. We’re also 17.8% higher when compared to last year at this time.
The pending/active ratio continued to move upwards, moving even more into a sellers market similar to what we saw at the beginning of the year. This is much higher when compared to last years’ number of .78. We’re now at 1.44. It’s the strongest market favoring sellers since the beginning of 2018. The pending/active ratio has been a benchmark that we’ve used as a measure of supply and demand to determine whether we’re in a buyer’s or a seller’s market. Typically, a number well above 1, (less inventory with more pendings) favors sellers. A number below 1 favors buyers.
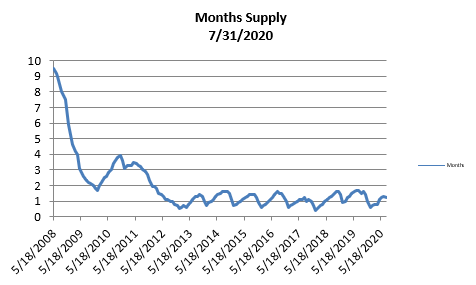
- The month’s supply for the combined 39 city area is 36 days. Historically, a 2 to 3 months’ supply is considered normal in the San Francisco East Bay Area. As you can see from the graph above, this is normally a repetitive pattern over the past four years. Supply is less when compared to last year at this time, of 51 days.
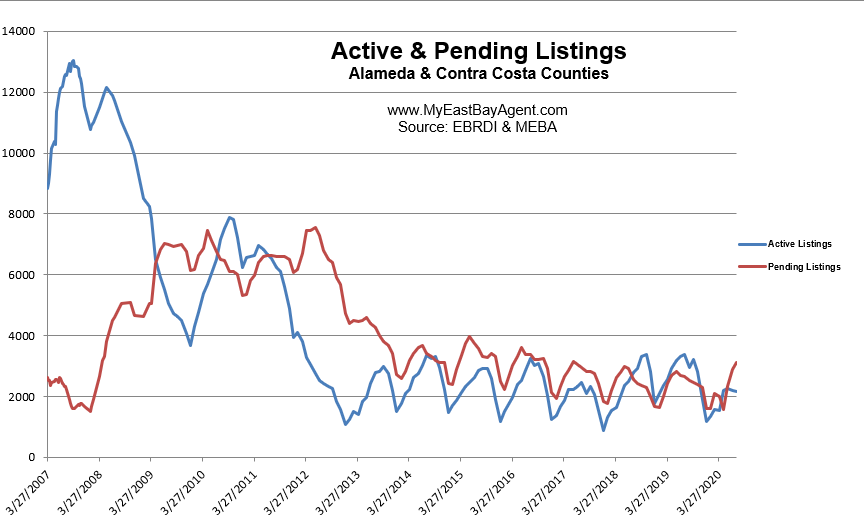
- Our inventory for the East Bay (the 39 cities tracked) is now at 2,159 homes actively for sale. This is fewer than what we saw last year at this time, of 3,395. We’re used to seeing between 3,000 and 6,000 homes in a “normal” market in the San Francisco East Bay Area. Pending sales increased to 3,118, higher than what we saw last year at this time of 2,646.
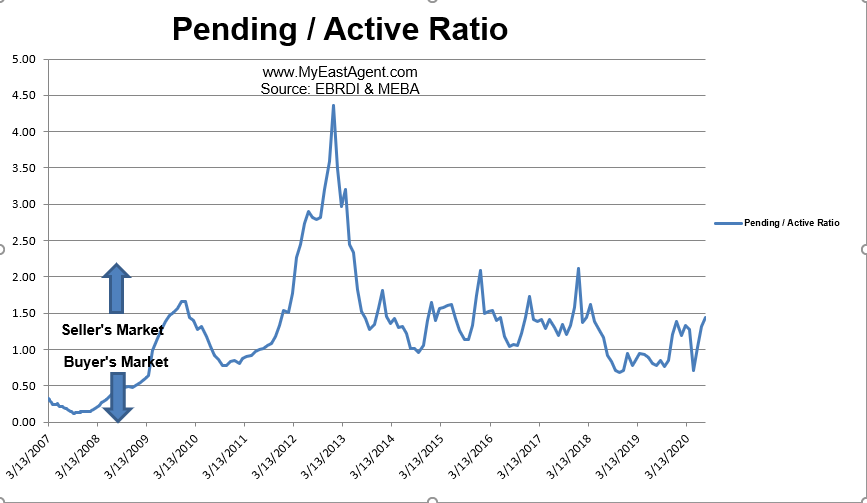
- Our Pending/Active Ratio is 1.44. Last year at this time it was .78.
- Sales over the last 3 months, on average, are 1.7% over the asking price for this area, lower than what we saw last year at this time, of 3.4%.
Recent News
Leslie Appleton-Young Chief Economist, CALIFORNIA ASSOCIATION OF REALTORS®
July/August 2020 Magazine Issue
How has C.A.R. revised its housing forecast for 2020 to account for the coronavirus pandemic?
Since the pandemic hit the 2020 forecast has been a moving target. We are now monitoring market stats on a daily and weekly basis — waiting for the monthly sales and price report is not helpful in a market that is constantly changing. In a normal year we model demand and supply, making reasonable assumptions about the strength of the economy, frequently creating different scenarios to prepare, at least mentally, for exogenous factors. This year that has all been thrown out the window because just about everything is unknown. At the end of the day, the recovery in the economy is inextricably tied to the path of the virus, the relief response of the government and consumer behavior. In short, we simply don’t know.
Last August when we developed the 2020 forecast, we were looking at a good market constrained from being great by the twin hurdles of affordability and supply. On the foundation of a strong economy and attractive mortgage rates, we forecast that sales would be up slightly by 0.8 percent and the statewide median price would be up 2.5 percent to $607,900.
Fast-forward to the beginning of May with two months of pandemic-infused data under our belts, including horrific job losses: We revised the 2020 forecast done last fall to reflect the realities of the COVID marketplace with a -16.7 percent in sales and -3.7 percent in the median price. Just one month later, we had a few more weeks of data that were stronger than expected, revising the outlook for 2020 to -12.7 percent and the median price off just -1.1 percent. So we are updating our projections regularly, hoping for the best but always committed to getting an accurate picture of how the market is likely to evolve.
Some are worried about a repeat of the housing slump we saw during the Great Recession. How does the current situation compare to that of 2008?
So far it is very different. The Great Recession started in the housing finance sector with subprime lending and cash-out refis, putting those homeowners in harm’s way without a cushion to protect against falling prices. At the same time, the mortgage-backed securities created from these loans were rated to be less risky than they were and sold to investors around the world. When borrowers started to default on their loans, the crisis reverberated throughout the global financial system, financial institutions required government bailouts to survive, stock markets dove, and the economy slowed — the Great Recession was on.
Looking back, we can appreciate how relatively gradual the ramp up to September 2009 was compared to the speed of today’s drop. For example, it took two years for the cumulative total of initial claims for unemployment assistance to reach 37 million people. In 2020, there were 42.6 million Americans in this category in 11 weeks. Yes, 11 weeks.
Back to the housing slump. The key characteristic of the housing market in this period was the high level of foreclosed properties, the increase in inventory and, in California, the almost 60 percent drop in the statewide median home price. U.S. foreclosure filings increased 81 percent in 2008; in January 2009, 60 percent of the closings in California were REO (bank-owned properties). It was a time when short sales were the growth opportunity in real estate. Could that happen again today? It’s not likely for several reasons. The underwriting behind mortgages today is solid, household wealth is robust, the underlying fundamentals of the economy are strong, and demand for housing far outstrips the limited supply. Never say never, but a realistic look at today’s landscape does not suggest a repeat of the housing slump of 2009.
Do you think the pandemic will have a long-term impact on housing prices in California?
Not likely. The trajectory of California with a robust economy and an inadequate supply of housing is for continued appreciation of home prices over the long run. There are always scenarios in which a fall in prices in possible, but I don’t see any of them as likely at this point. In fact, as the economy emerges from its forced hibernation, the demand for different types of housing to accommodate the work-from-home world, along with geographic shifts fueled by the “work-from-anywhere” reality, will be game-changing. And on the foundation of low mortgage rates, these changes bode well for a continuation of the strong demand, constrained supply world the California market has inhabited for quite some time. That’s been our new normal.