
January 31, 2021 – Real Estate Market Numbers
By Glen Bell (510) 333-4460
Here’s a quick summary of what’s going on in the San Francisco East Bay real estate market as of January 31st, 2021.
I’d like to start out with a quick quote coming from CAR chief economist Jordan Levine:
“Home prices, which usually peak during the summer, were unseasonably strong in December,” he said in a news release accompanying the report. “The imbalance between supply and demand continues to fuel home price gains as would-be home sellers remain reluctant to list their homes during the pandemic.”
“Home sales should remain elevated into the first half of 2021, as motivated buyers take advantage of the increased purchasing power,” he said.
Yes, sales were up in December but down slightly in January. Pendings are down by 5% from December but up by 34.7% compared to last year. Inventory on the other hand has increased by 20% from last month. However, still below last year’s levels by 14%. This is the lowest inventory level for a January that I’ve seen since I began tracking statistics in 2007. Based on normal seasonal influences, we typically see a steady increase from the beginning of the year through to the end of September followed by a decrease coming into the holidays. We have an 18 day supply of homes for sale today. Last year at this time, there was a 21 day supply.
Our supply and demand ratio is now at 1.87 indicating a strong “sellers’ market.” Last year at the end of January, we were at 1.20. The year before that, .78.
We’re seeing a migration coming out of SF and South Peninsula. Some movement to the East Bay, some to the Central Valley and some even out of the state altogether. This is primarily due to being able to work at home, high cost of living, state & local taxes, smoke, traffic, housing affordability, job relocations, etc
We’re also seeing a softening in some of those markets plus rents have been coming down. The Condo market continues to be sluggish.
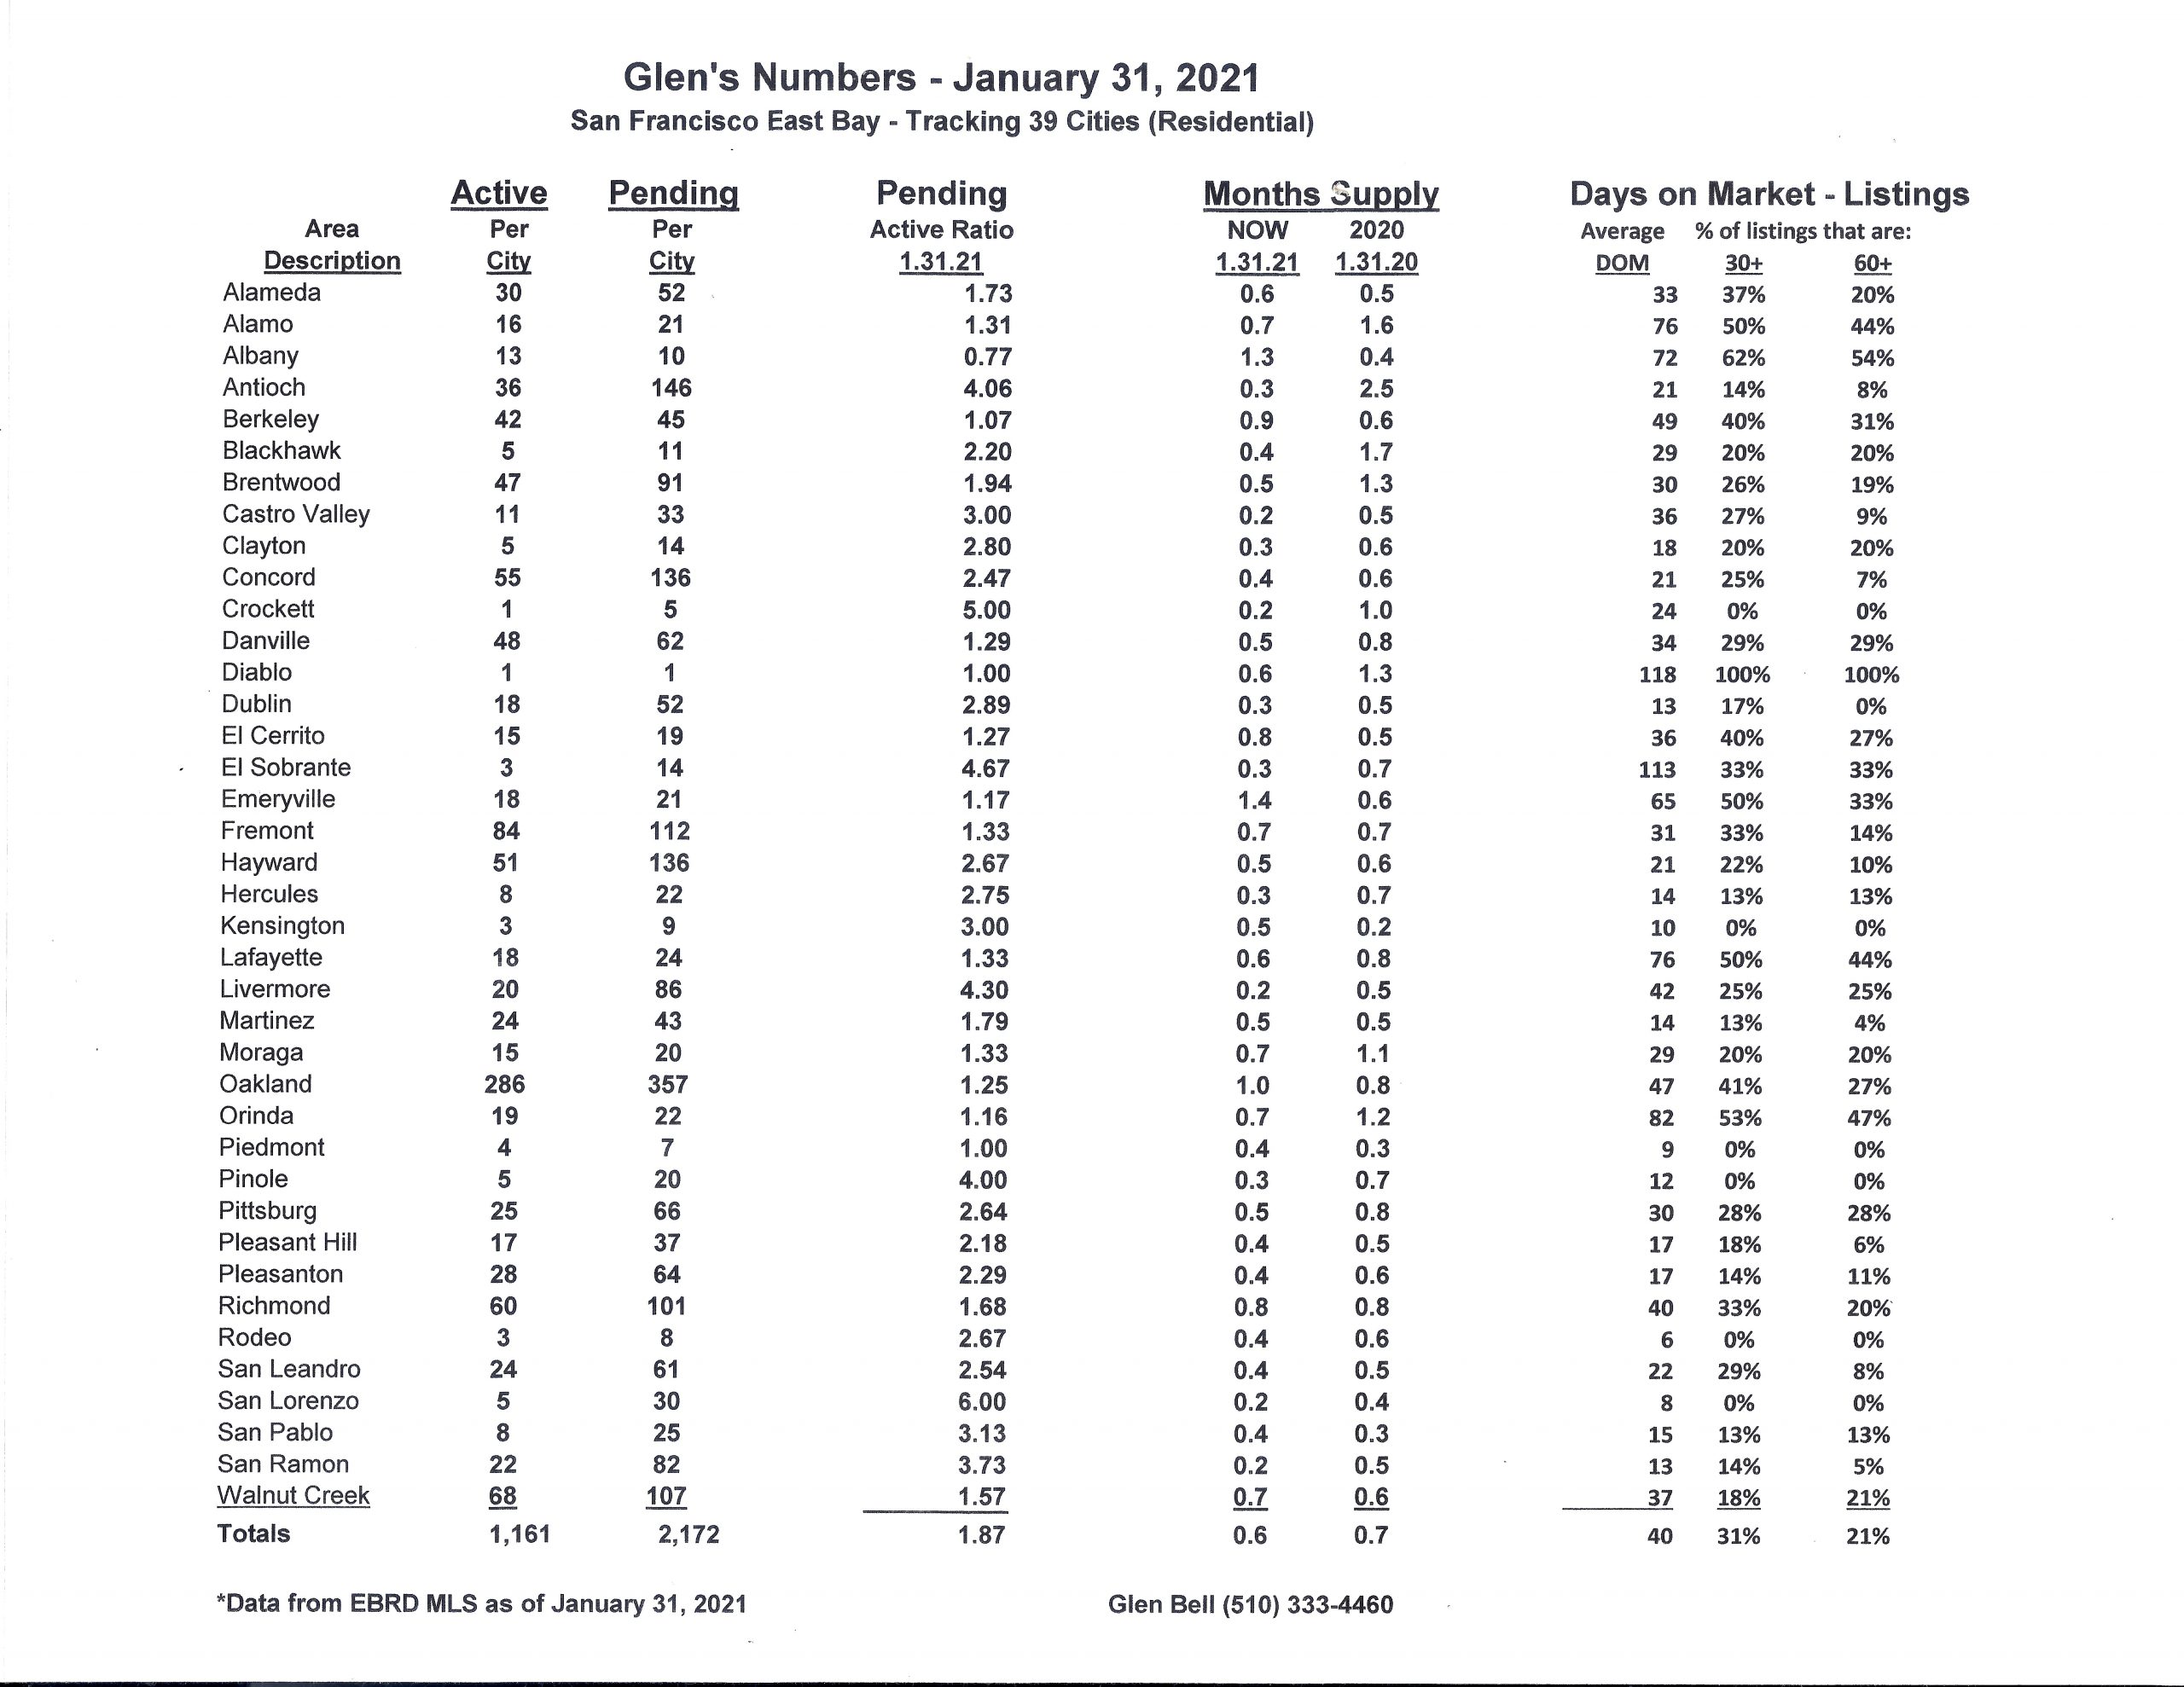
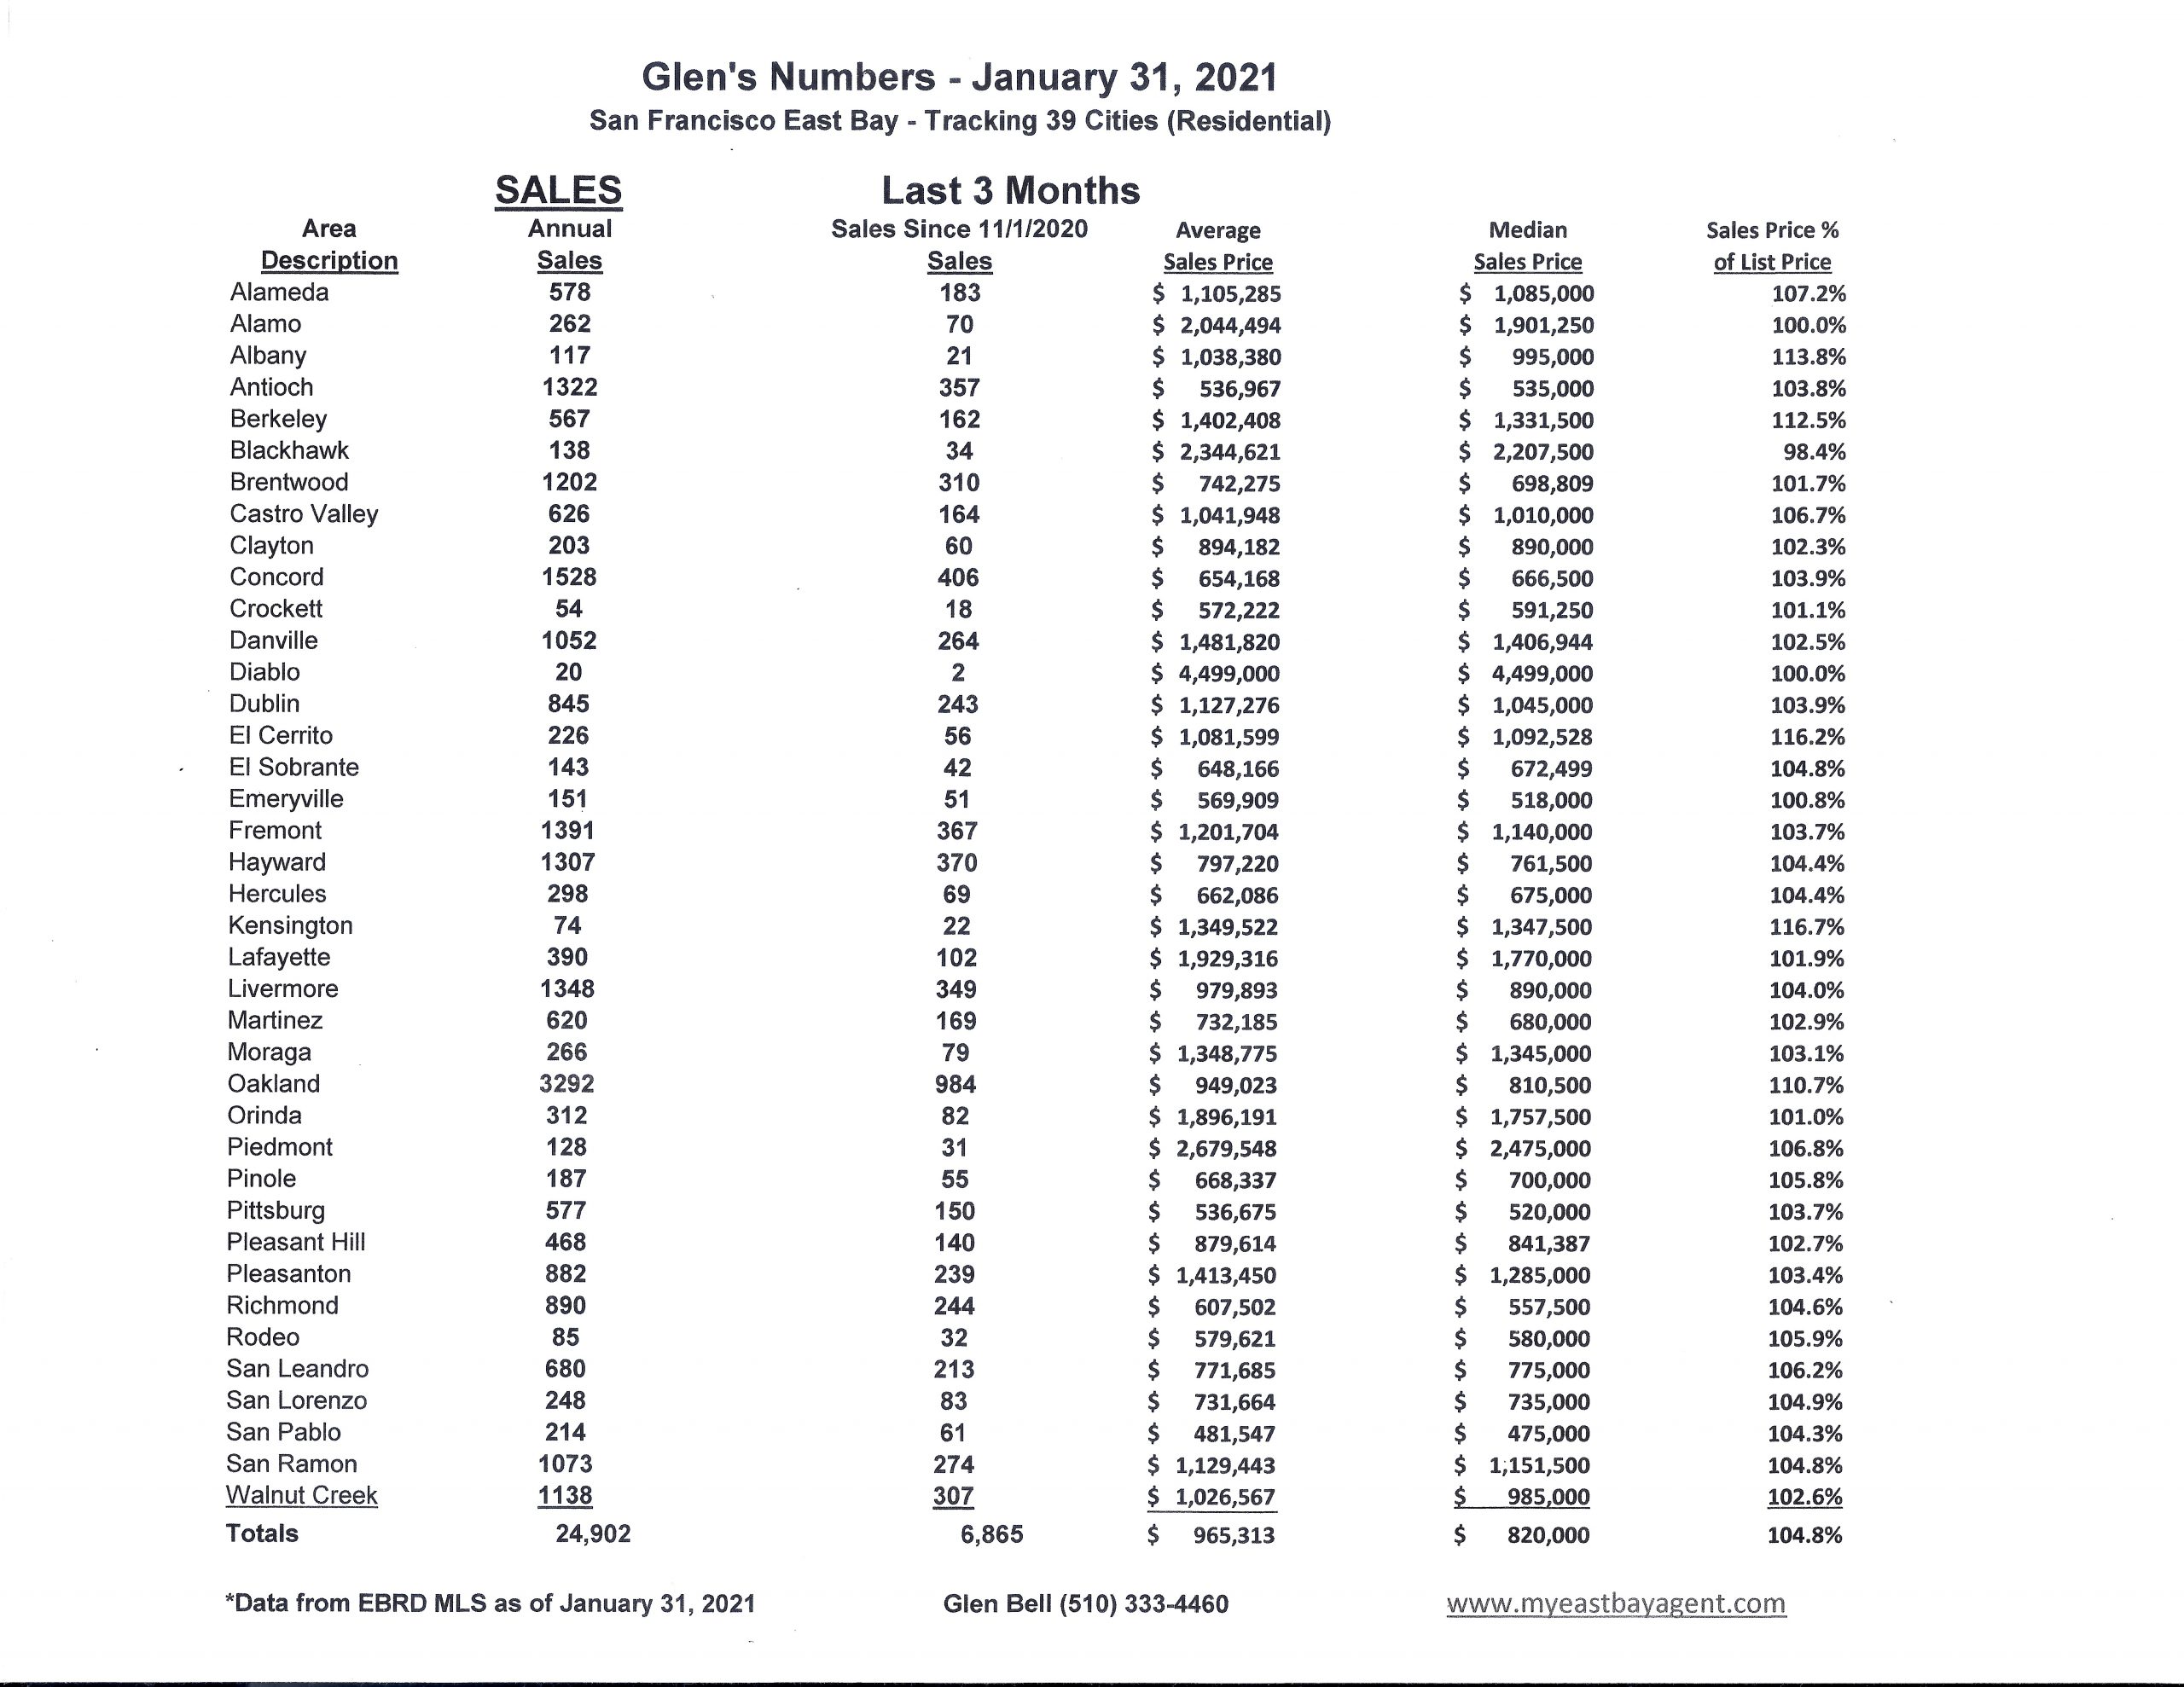
Here are some highlights for the 39 East Bay Cities that I track:
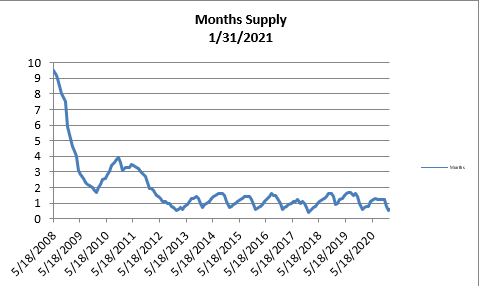
- The month’s supply for the combined 39 city area is 18 days. Historically, a 2 to 3 months’ supply is considered normal in the San Francisco East Bay Area. As you can see from the graph above, this is normally a repetitive pattern over the past four years. Supply is less when compared to last year at this time, of 21 days.
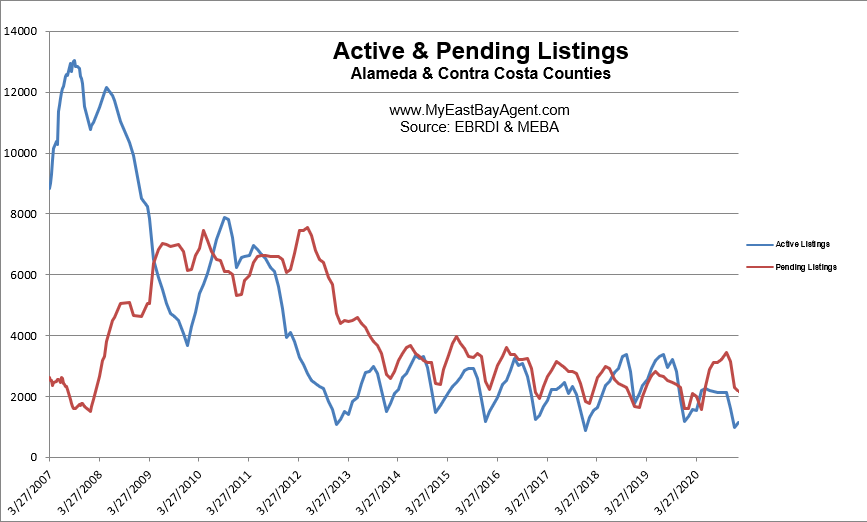
- Our inventory for the East Bay (the 39 cities tracked) is now at 1,161 homes actively for sale. This is fewer than what we saw last year at this time, of 1,348. We’re used to seeing between 3,000 and 6,000 homes in a “normal” market in the San Francisco East Bay Area. Pending sales decreased slightly to 2,172, much higher than what we saw last year at this time of 1,613.
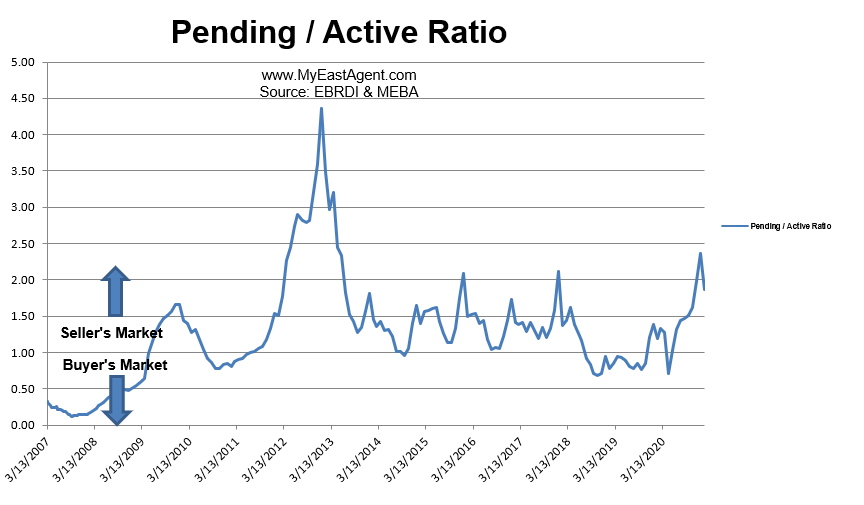
- Our Pending/Active Ratio is 1.87. Last year at this time it was 1.20.
- Sales over the last 3 months, on average, are 4.8% over the asking price for this area, Higher than what we saw last year at this time, of 1.6%.
Recent News
California Association of Realtors Market Minute
February 8, 2021
Housing demand is stronger than normal so far in 2021, while tight supply continues to put upward pressure on housing values. Robust price growth will not ease up until some balance between supply and demand is restored. Recent survey results suggest that the housing market could be getting more listings in the coming weeks, possibly because of the improving pandemic situation and a recovering economy.
Signs of Improvement on the Supply Side: While the number of active listings remained near the lowest level since the pandemic began, the rate of decline appeared to be leveling off. Last week’s average daily new listings, in fact, had its first weekly increase in three weeks based on the weekly MLS data. Survey results also suggest a bounce back in supply as 46.5 percent of those who responded to the survey – the highest level in five weeks – believed listings would go up in the following week. Over a third (35 percent) had a listing appointment last week, which was the highest level since early November 2020. Sellers also became more positive about the market as only 6.4 percent of them removed their home from the market, significantly below the 24.1 percent recorded in early June, and was the lowest level since then.
Home Prices Not Expected to Ease: Despite a possible improvement on the supply side of the market, upward pressure on prices continued to build up. All parties involved – buyers, sellers, and agents – agreed that home prices will likely remain on their upward trend in the short term. Three of five REALTORS® (61.3%) who responded to the weekly survey believed that prices would go up in the upcoming week, nearly doubled the level observed in late July and was the highest level in at least the last six months. The share of buyers who expected lower prices also has dropped by more than half from 66.7 percent in early June 2020 to 32.7 percent in the latest week. Meanwhile, the share of sellers who reduced price to attract buyers dipped to the lowest level of 6.8 percent in the last seven months.
Overall Homeownership Rate Rose but Black Homeownership Fell: U.S. homeownership rose in the last quarter of 2020, increasing to 65.8 percent from 65.1 percent in the same period a year earlier. The homeownership rate for white Americans in the fourth quarter of 2020 reached a nine-year high of 74.5 percent, and Hispanic American homeownership rate rose to the highest fourth quarter rate in three years at 49.1 percent. Homeownership rate for Black Americans, however, fell to 44.1 percent, the lowest rate since the first quarter of 2020. So, while the overall homeownership rate might have improved due to favorable lending environment, the economic recession is having a more negative effect on Black American homeownership than other ethnic groups.
Interest Rates Flat and below Recent High: Mortgage rates were unchanged in the past week and remained near record lows, after increasing briefly for a couple weeks in January. The short spike in rates was due to concerns that higher likelihood of passing new fiscal stimulus could spark inflation sooner than anticipated. Those concerns have subsided in recent weeks and rates have moderated since then. While rates could fluctuate as more economic data become available throughout the year, the average 30 year fixed-rate average will likely stay close to 3 percent in 2021.
Unemployment Rate Declined for Mixed Reasons, but Better Days Ahead: The labor market recovery continued with the unemployment rate dropping 0.4 percentage points to 6.3 percent in January. Despite the unemployment falling to the lowest level since March 2020, the labor market condition is less upbeat than suggested by the indicator. First, the increase of 49k jobs in January only partially reversed the job loss of 227k reported by employers in December. In addition, the sharp decline in the unemployment came as the labor force participation rate edged lower to 61.4 percent and 406,000 workers left the labor force. The employment conditions, nevertheless, look brighter in the days ahead as vaccine rollouts are expected to improve, while additional fiscal stimulus in the work should help strengthen hiring conditions.
How The Condo Market Stalled in 2020, Even as Single-Family Homes Soared
By Nicole Bachaud, Zillow, February 8, 2021
- As the market heated up for single-family homes in 2020, the condo market cooled, with rising inventory and a higher share of listings with price cuts.
- Median sales price for condos rose year-over-year, but fell behind single-family homes.
- Condos may provide an attractive entry point for those looking to own, especially in heated markets.
Housing market performance in urban and suburban areas was broadly similar in 2020, but the nation’s condo market failed to keep pace with the single-family home segment across a broad range of indicators last year. It could indicate that while our preferences for where to live may not have changed much during the pandemic, the type of homes we prefer may have.
Sales and price growth for condos ended 2020 generally lower than for single-family residences (SFRs) while inventory levels were generally higher, according to a Zillow analysis of listing and price data. Still, it remains to be seen how permanent these shifts will be in the face of sky-high housing demand and the enduring affordability of condos for a large pool of buyers eager to get a foot in the door, unfazed by condos’ cozier space and perhaps attracted by the sometimes amenity-rich condo lifestyle.
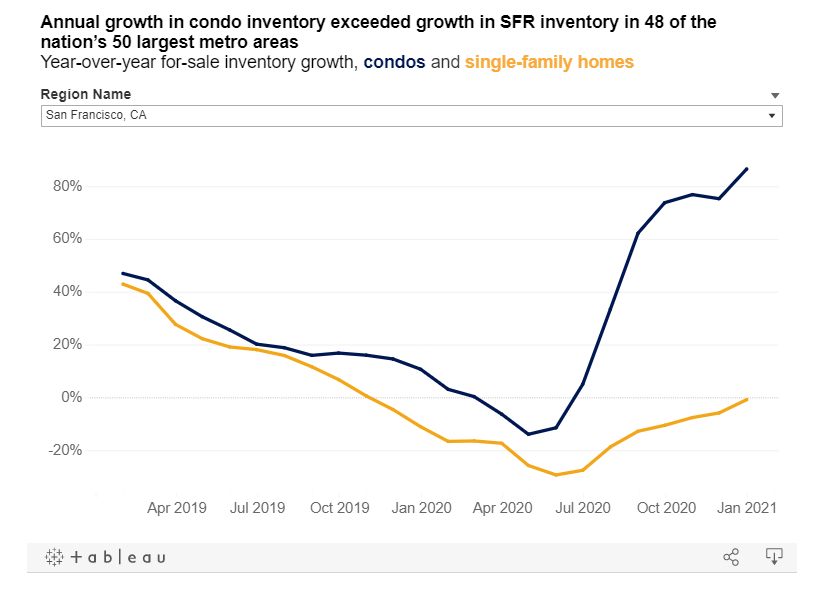
There was a considerable year-over-year spike in for-sale condo inventory nationwide compared to single-family inventory starting early summer 2020, a potential sign that condo-owners were vacating their homes and trading up for more space and privacy. Even so, this year-over-year increase in condo inventory happened in the midst of steep overall inventory declines, potentially providing homebuyers with modestly more options in a tight market.
Echoing the national trend, annual growth in condo inventory exceeded growth in SFR inventory in 48 of the nation’s 50 largest metro areas. New Orleans and Charlotte were the only exceptions.
Around the same time as inventory levels were rising, the share of condo listings that had at least one price cut also rose above that of SFR listings — the first time that occurred, since at least early 2019, offering further evidence of a softening condo market.
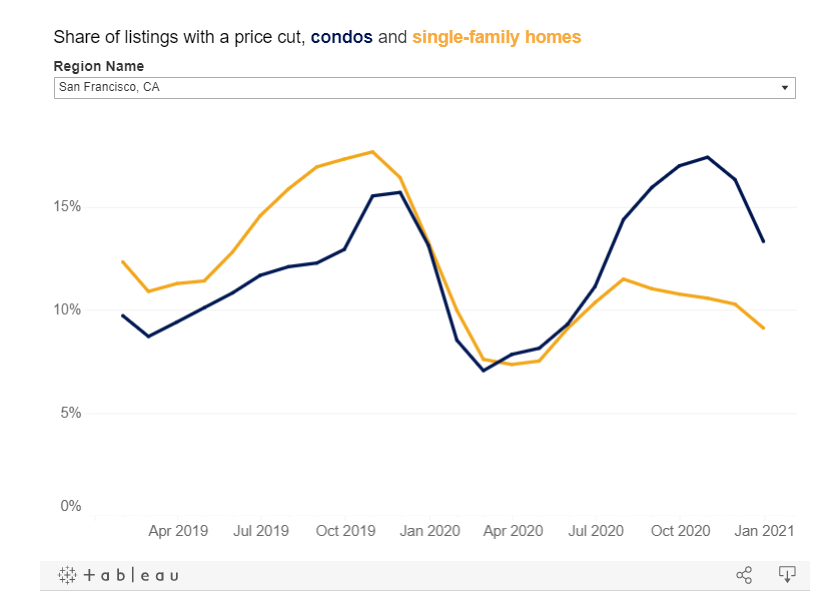
This trend was also mirrored in many local markets, most notably in several west coast metros. In Seattle, the share of condo listings with a price cut was more than 50% higher than the share of single-family homes by October (21% compared to 13.2%, respectively). The majority of California markets and some on the east coast also mirrored this trend, along with markets including Minneapolis, Nashville and Atlanta — an indication that the softening condo market was not only concentrated in dense coastal areas.
Diverging median sales prices between condos and single-family homes offered another sign of softening. The median list price for condos nationwide ended 2020 slightly higher than SFRs, but growth in median sale price has slowed. Throughout last year, single-family homes fetched a consistently higher median final price than condos, but the gap began widening last fall as year-over-year growth in condo prices flattened while SFR prices kept surging.
These differences in list price and sale price may be partly explained by composition differences between listings and sales counts for these two markets. When broken out by value tier, the largest year-over-year increases in for-sale condo listings were in the highest value tier, even as overall condo inventory began to rise. In other words, there were relatively more higher-value condo listings on the market than less-pricey options, contributing in part to condo’s higher median list price. That could be explained in part by where these condo listings were — in general, listings of condos in typically more expensive urban areas grew more than more-affordable suburbs or rural areas, also contributing to higher list prices.
On the sales side, annual growth in sales among the highest-priced single-family homes exceeded growth in other segments, explaining the recent rapid increase in overall SFR sale prices as relatively more, more-expensive, homes sell. For condos, annual growth rates were broadly similar by the end of the year for all but the lowest-priced segment, where growth lagged behind. But these small differences weren’t enough to bring the overall condo median sale price to single-family levels. It is interesting to note that while growth in overall median sales prices for condos is plateauing, the gap in annual sales growth between the highest valued tier and the rest of the condo market has closed.
Condo communities in different markets are responding differently to the pandemic and a softening market. In some metro areas, including Las Vegas and Houston, condo fees — also known as HOA fees or dues — have risen. In other areas, including Washington, DC, Baltimore and other east coast markets, condo fees are falling. These fees often cover maintenance and other costs associated with condo-specific amenities including pools, gyms and community centers — perks that are generally attractive to many buyers, but which may be closed, limited and/or more expensive to operate during the ongoing pandemic.
Condos provide a unique opportunity for prospective buyers looking for a foot in the door, especially in markets where house prices have risen out of reach or where proximity to urban centers is a priority. Many of the factors that make a condo lifestyle attractive to many, including more-communal living and easy access to desirable amenities including gyms, pools and community spaces, may have lost some of their shine during the pandemic. But in a post-pandemic world, it is likely these amenities will come back in full force and again become an attractive selling point.
What Will Real Estate Look Like In 2021? 3 Homebuying Trends You’ll See This Year
By Blake Morgan, Forbes, February 8, 2021
Chances are, you or someone you know has bought or sold a house in the last 10 months. No matter if you are moving across the street or across the country, it’s all part of a record-setting real estate boom.
The Covid-19 pandemic has affected every industry, but perhaps none as surprisingly as real estate. Triggered by job and financial changes, the push to stay at home and low interest rates, a record number of people have bought homes during the pandemic, even as a recession lingers and unemployment rates remain high. And the trend will continue throughout 2021.
The real estate boom is far from over. Here are three key homebuying trends to look for in 2021.
Record-Setting Pace
Homes aren’t just selling, they’re selling at a record-setting pace. The Covid-fueled real estate boost caused an average of 42% of home listings nationwide to sell in two weeks or less. One survey found that more than half of homebuyers say the pandemic accelerated their homebuying process. In the competitive San Diego market, 55% of homes are off the market in less than weeks, with an average of just 20 days on the market.
The record-setting pace is good news for sellers but makes for a difficult experience for buyers. In many cases, potential buyers are outpriced in the competitive market or
However, the record-setting pace could start to slow slightly during 2021. Houses were flying off the market because of a supply shortage and an increase in demand, largely due to a spring freeze in buying, paired with low interest rates and changing job situations. But as supply and demand start to balance out as the year progresses, look for the competitive seller’s market to slow down, but not by much.
In 2021, Zillow expects 6.9 million existing home sales, which is the most since 2005. The projected 21.9% one-year gain in sales is the largest since the early 1980s. An increasing number of millennials are buying houses, and with Gen Z closing in on prime homebuying age, the market demand should hold steady throughout 2021 and into the future.
Perhaps good news for buyers is that 2021 won’t be such a steady rush. Due to the pandemic, typical homebuying seasons went out the window in 2020, creating a free for all. But as things return to a new type of normal in 2021, look for homebuying seasons to return, with a surge of buyers in the spring and summer months and things cooling down towards winter.
Changed Budgets, Higher Prices
The homebuying surge comes in the middle of financial strain and high unemployment numbers. So although many people are buying homes, they aren’t always stretching their budgets. Research found 63% of homebuyers were forced to lower their budget by an average
of $28,400 due to the pandemic. At the same time, 65% of buyers backed out of buying a home, most often due to budget.
When paired with record-low interest rates, lower budgets can still get buyers more home than they could have bought a year ago. Interest rates are likely to stay low throughout 2021 but will start to increase in the second half of the year. Buyers or people who were thinking of buying within the next few years are now speeding up their timelines to make their money go further.
Lowered budgets are changing what some homebuyers are looking for, leading to growth in less expensive regions. In some cases, buyers with lowered budgets are shopping for homes below their price range in hopes of being able to put in an above-list price offer.
Although individuals are lowering their personal budgets, the markets as a whole are increasing. A rise in demand is actually raising home prices. Nearly one in four buyers who purchased between April and June 2020 paid $500,000 or more, an increase from 14% of buyers in the preceding nine months. Experts predict that home prices will increase 5.7% in 2021 to reach new heights.
Leaving Cities And High-Tax Areas
The move to remote working has pushed people out of cities and led to an increase in homebuying in the suburbs. Suburban areas have seen higher home sales growth than urban areas, and many homebuyers have increased their willingness to commute when they return to work in the office.
In the suburbs, homebuyers are more likely to find traits that are increasingly desirable: larger houses for more time spent at home, dedicated office space and personal outdoor space, as well as proximity to beaches, trails and open space.
The top 10 most competitive real estate markets during the pandemic are Seattle, Omaha, Lexington, Denver, Indianapolis, Portland, Oklahoma City, Sacramento, Oakland and Tulsa. These areas will continue to thrive in 2021, especially in their suburban areas.
Aside from leaving urban centers, many people are leaving high-tax areas. Some of the world’s richest people, including Elon Musk, who recently overtook Jeff Bezos as the richest person in the world, are leaving high-tax areas like California in favor of lower taxes. Musk moved himself and the headquarters of SpaceX from California, the state with the highest income tax, to Texas, a state with no income tax. Joining the ranks include Splunk CEO Doug Merritt, who also moved to Texas, Oracle co-founder Larry Ellison, who relocated to Hawaii and even Tom Brady, who recently bought a Miami mansion.
The effects of the ultra-rich leaving high-tax areas will be felt throughout their cities. Others may follow in their footsteps to take advantage of lower taxes, especially as remote work opens up the potential to work from anywhere, and finances are tight for many people.
What will real estate look like in 2021? In most cases, a continuation of the incredible growth of 2020. Even during a pandemic and recession, homes will continue to sell at a breakneck pace.
Here’s what home prices look like right now for each Bay Area county
By Susie Neilson, San Francisco Chronicle, January 29, 2021
The coronavirus pandemic and struggling economy couldn’t keep a lid on Bay Area home prices, which hit new records in 2020, according to a new report.
The median price for a single-family home in the Bay Area was $1.06 million in December, a slight decrease from November but a 16.4% increase from December 2019, according to a report from the California Association of Realtors released this month. Sales were up 40.2% in the region from 2019, according to the report.
San Mateo County’s median home price rose from $1.65 million in November to $1.7 million in December, making it the most expensive Bay Area county in which to purchase a home. Previously San Francisco, with a median home price of $1.697 million in November, had been the most expensive. But the city’s median home price had decreased slightly to $1.58 million by December.
San Mateo County had knocked San Francisco out of the top spot in December 2019 as well, the report showed. The median price that month was $1.475 million in San Mateo County and $1.45 million in San Francisco.
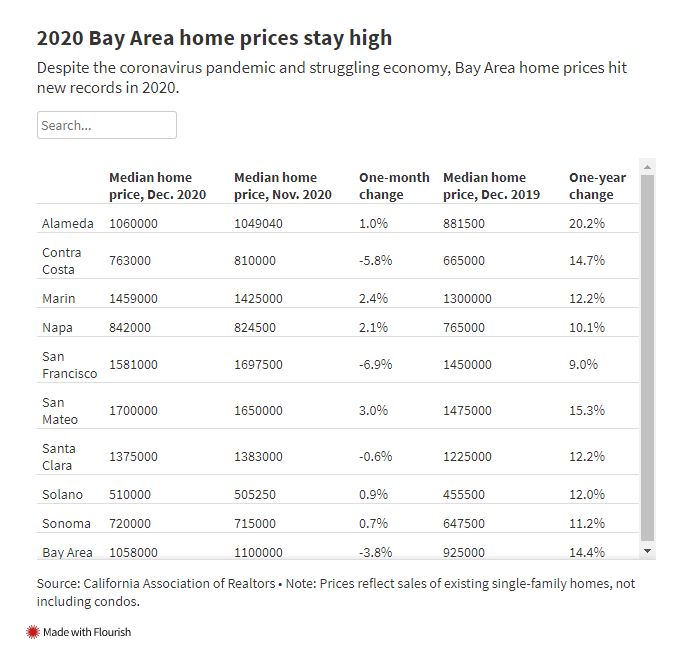
The median refers to the middle price for all homes in a set, where half sold for less and half for more.
California’s median home price in December reached a record $717,930, a 16.8% increase from December 2019. Active listings fell 47.1% from 2019, a figure the report attributed to homeowners’ wariness to sell during the pandemic. Coupled with low interest rates on mortgages, the decrease in supply helped drive prices up, according to Realtors association Chief Economist Jordan Levine.
“Home prices, which usually peak during the summer, were unseasonably strong in December,” he said in a news release accompanying the report. “The imbalance between supply and demand continues to fuel home price gains as would-be home sellers remain reluctant to list their homes during the pandemic.”
The 30-year fixed mortgage interest rate dipped to 2.68% in December, down from 3.72% last year, according to the report.
Association President Dave Walsh added that mortgage interest rates should remain low well into this year, keeping the housing market strong.
“Home sales should remain elevated into the first half of 2021, as motivated buyers take advantage of the increased purchasing power,” he said.
Experts optimistic about housing market in 2021
Despite four months of declines in pending home sales, low mortgage rates and federal stimulus should bolster market
By By Tim Glaze, HousingWire, January 29, 2021
U.S. pending home sales dipped to the tune of 0.3% in December following a 2.6% drop in November, according to a report from the National Association of Realtors. It’s the fourth consecutive monthly decline, but many industry observers see big potential for the housing market in the year ahead.
Contract signings rose 21.4% from December 2019, with all regions (Northeast, Midwest, South, West) reaching double-digit year-over-year increases. Realtor.com’s Housing Market Recovery Index showed significant contract growth, specifically in Portland, Las Vegas, Denver, Los Angeles, and Boston.
“Despite some weakness in pending sales in recent months, existing home sales continue to happen at breakneck pace, and December’s pending home sales suggest that the housing market is largely holding onto these gains,” said Danielle Hale, realtor.com chief economist. “Greater participation of sellers and builders in the months ahead will make home sales possible while easing some of the pressure on price growth, which is currently rising at a double-digit percent rate and has been for almost six months.”
The overall drop in pending home sales over the final quarter of 2020 can be contributed to a lack of inventory in the housing market, according to Lawrence Yun, NAR’s chief economist.
“There is a high demand for housing and a great number of would-be buyers, and therefore sales should rise with more new listings,” Yun said. “This elevated demand without a significant boost in supply has caused home prices to increase and we can expect further upward pressure on prices for the foreseeable future.”
Added Ruben Gonzalez, Keller Williams’ chief economist: “It may be several months before substantial progress is made in terms of available supply, and price growth will likely continue to accelerate until conditions improve.”
Home prices soared 9.5% in November compared with 12 months ago, according to CoreLogic‘s Case-Shiller index – the largest increase since May 2014.
But a promising 2021 for homebuyers is on the horizon, Yun said, with low mortgage rates and a fiscal stimulus expected to be passed by the Biden administration, which should bolster the housing market.
“I expect the 30-year fixed mortgage rate to average 3%, with the Federal Reserve refraining from any rate increases this year,” he said. “There will also be slower home price appreciation – likely 6.6% – as increased confidence from homebuilders will ultimately lead to an increase in housing starts.”
With rates remaining low, existing-homes sales are likely to reach 6.49 million in 2021, Yun said. That would be a 15% increase from 5.64 million in 2020.
Pending home sales saw a drop only in the Midwest, which reported a 3.6% drop. The Northeast (3.1%), South (0.1) saw increases in the December Pending Home Sale Index, while the housing market in the West remained unchanged.


 Facebook
 X
X
 Pinterest
 Copy Link

