


 Facebook
 Twitter
 Pinterest
 Copy Link
Glen’s SF East Bay Real Estate Market Update December 31, 2021

December 31, 2021 – Real Estate Market Numbers
By Glen Bell (510) 333-4460
This is always the time of year where we reflect on where we’ve been and where we’re headed.
“The housing market has been breaking new records across multiple fronts throughout 2021, leaving home shoppers wondering if they should buy now or wait in the hope that more homes become available, and at more affordable prices in 2022.”
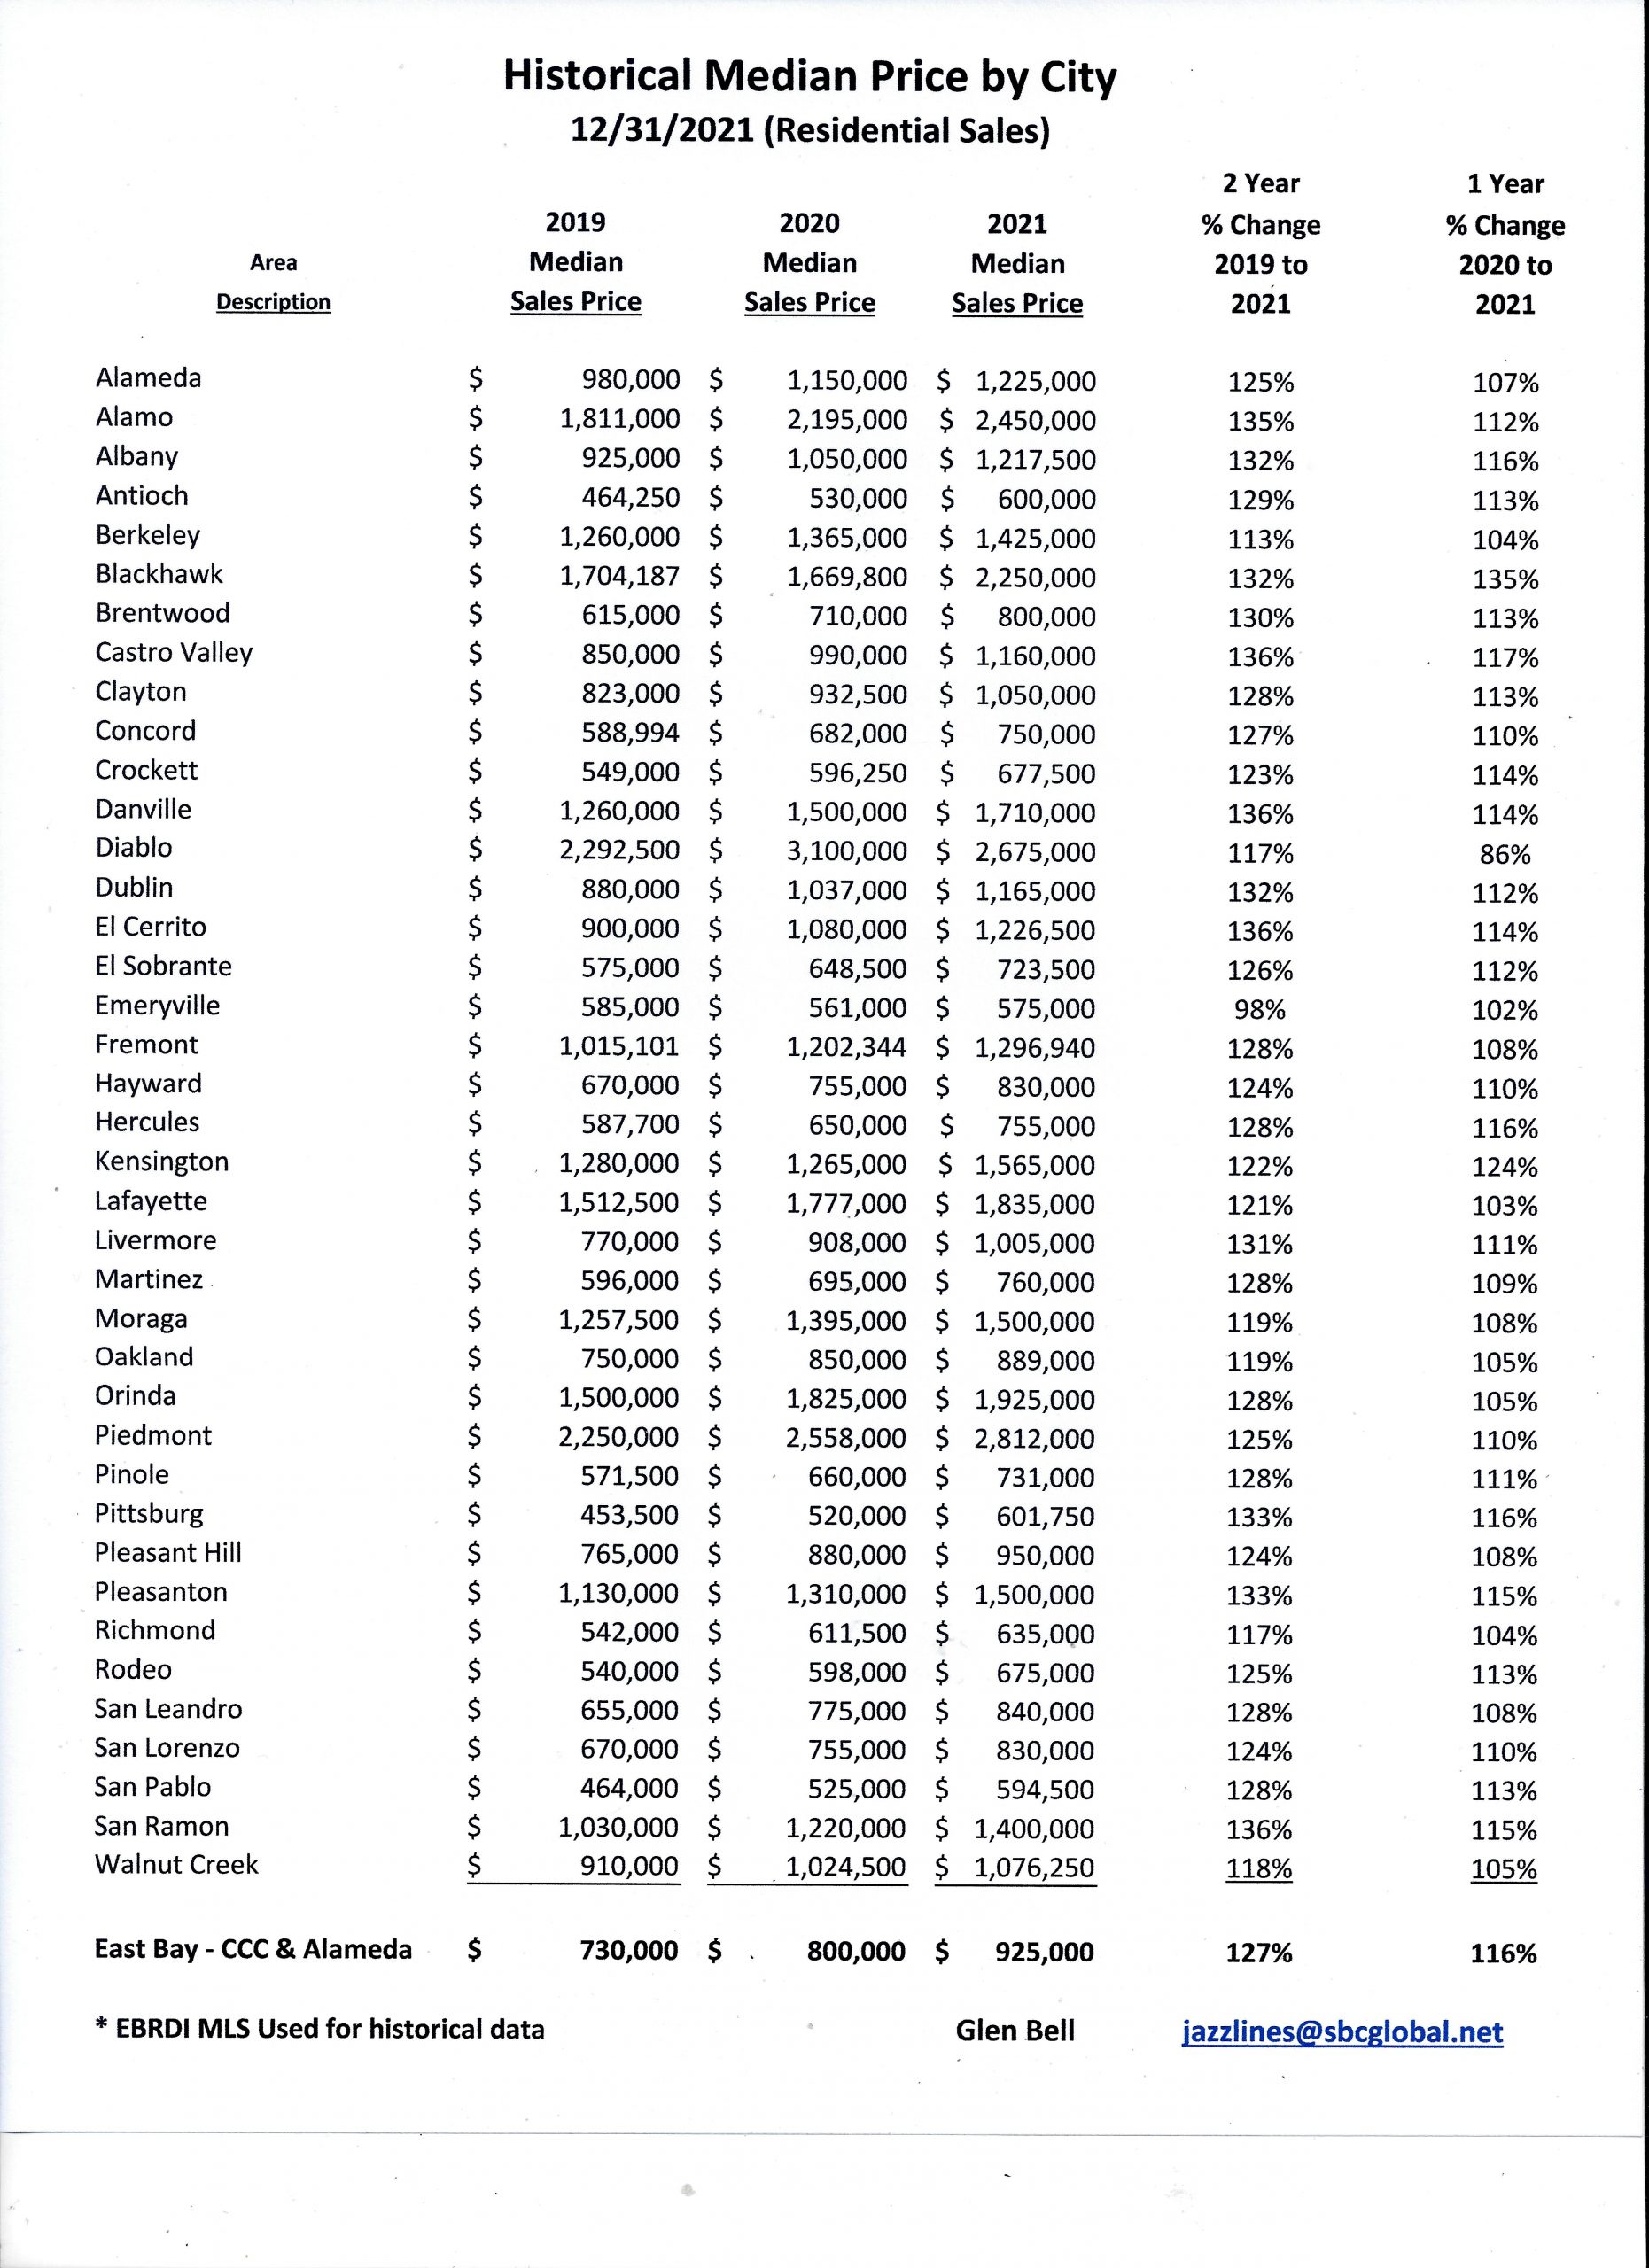
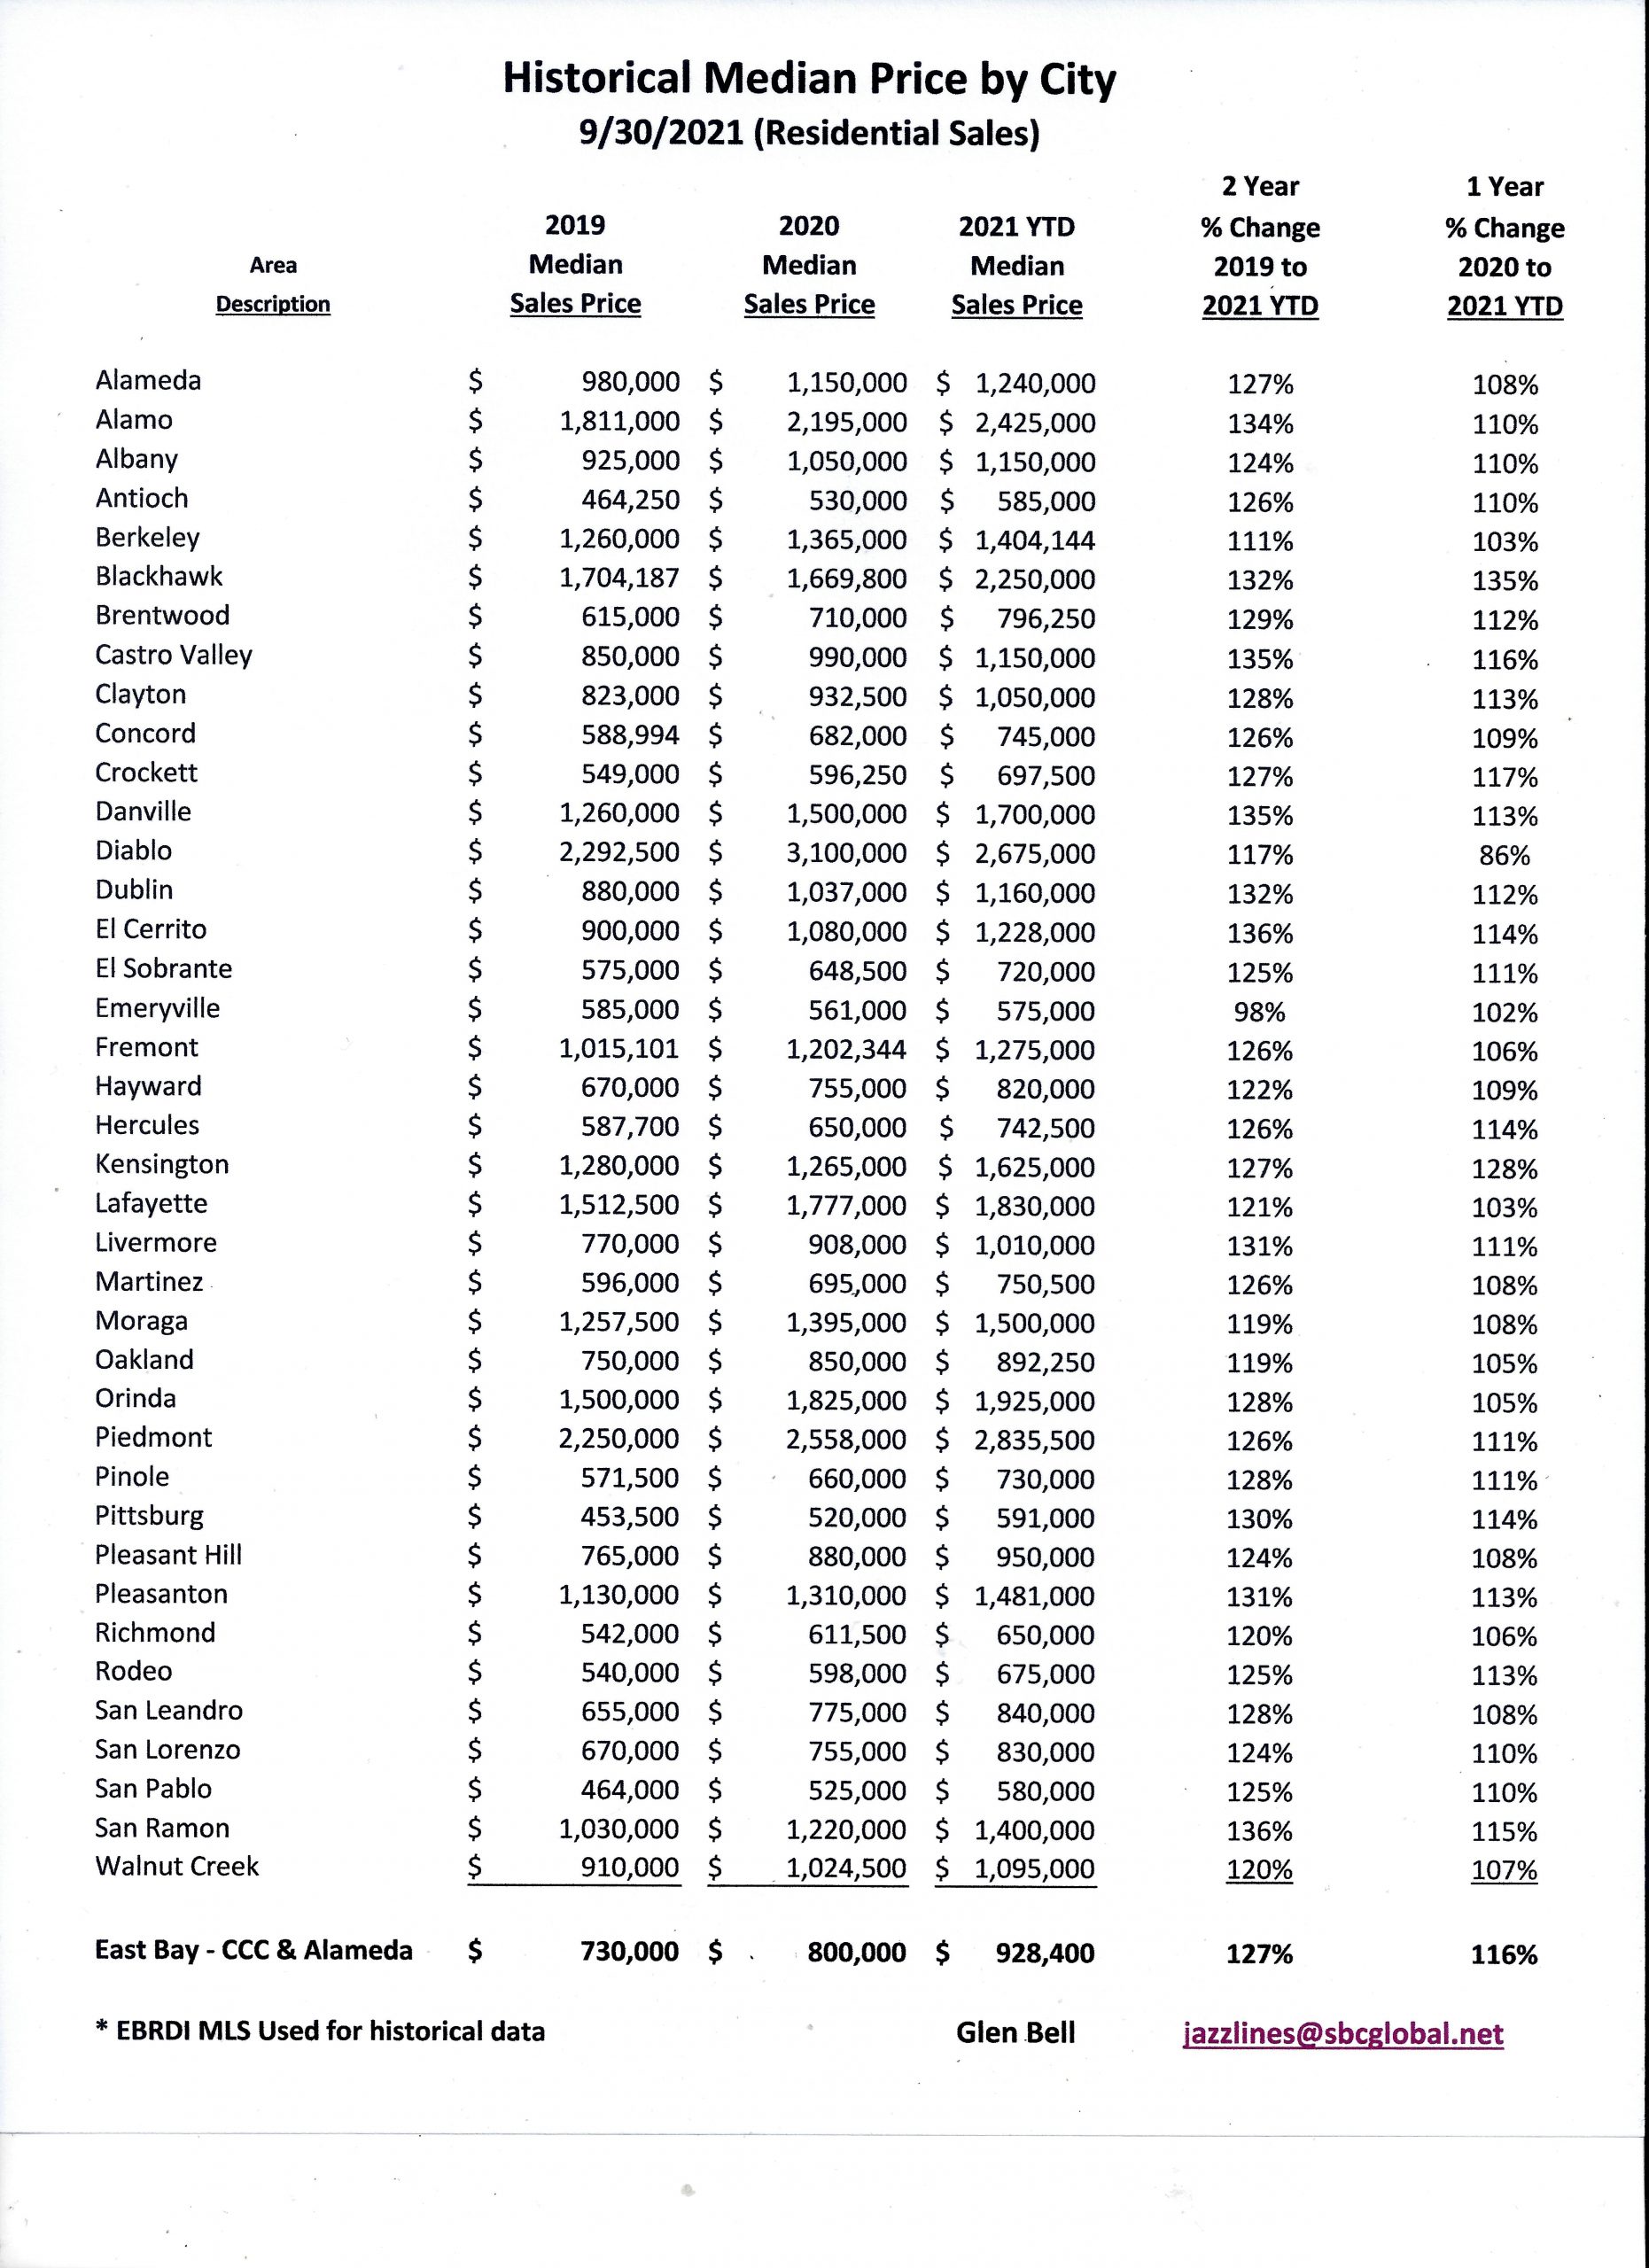
The Historical Median Price graph below, demonstrates just how much homes have appreciated over our last two years; For the East Bay, (Alameda and Contra Costa Counties), we’ve seen an average increase of 27%.
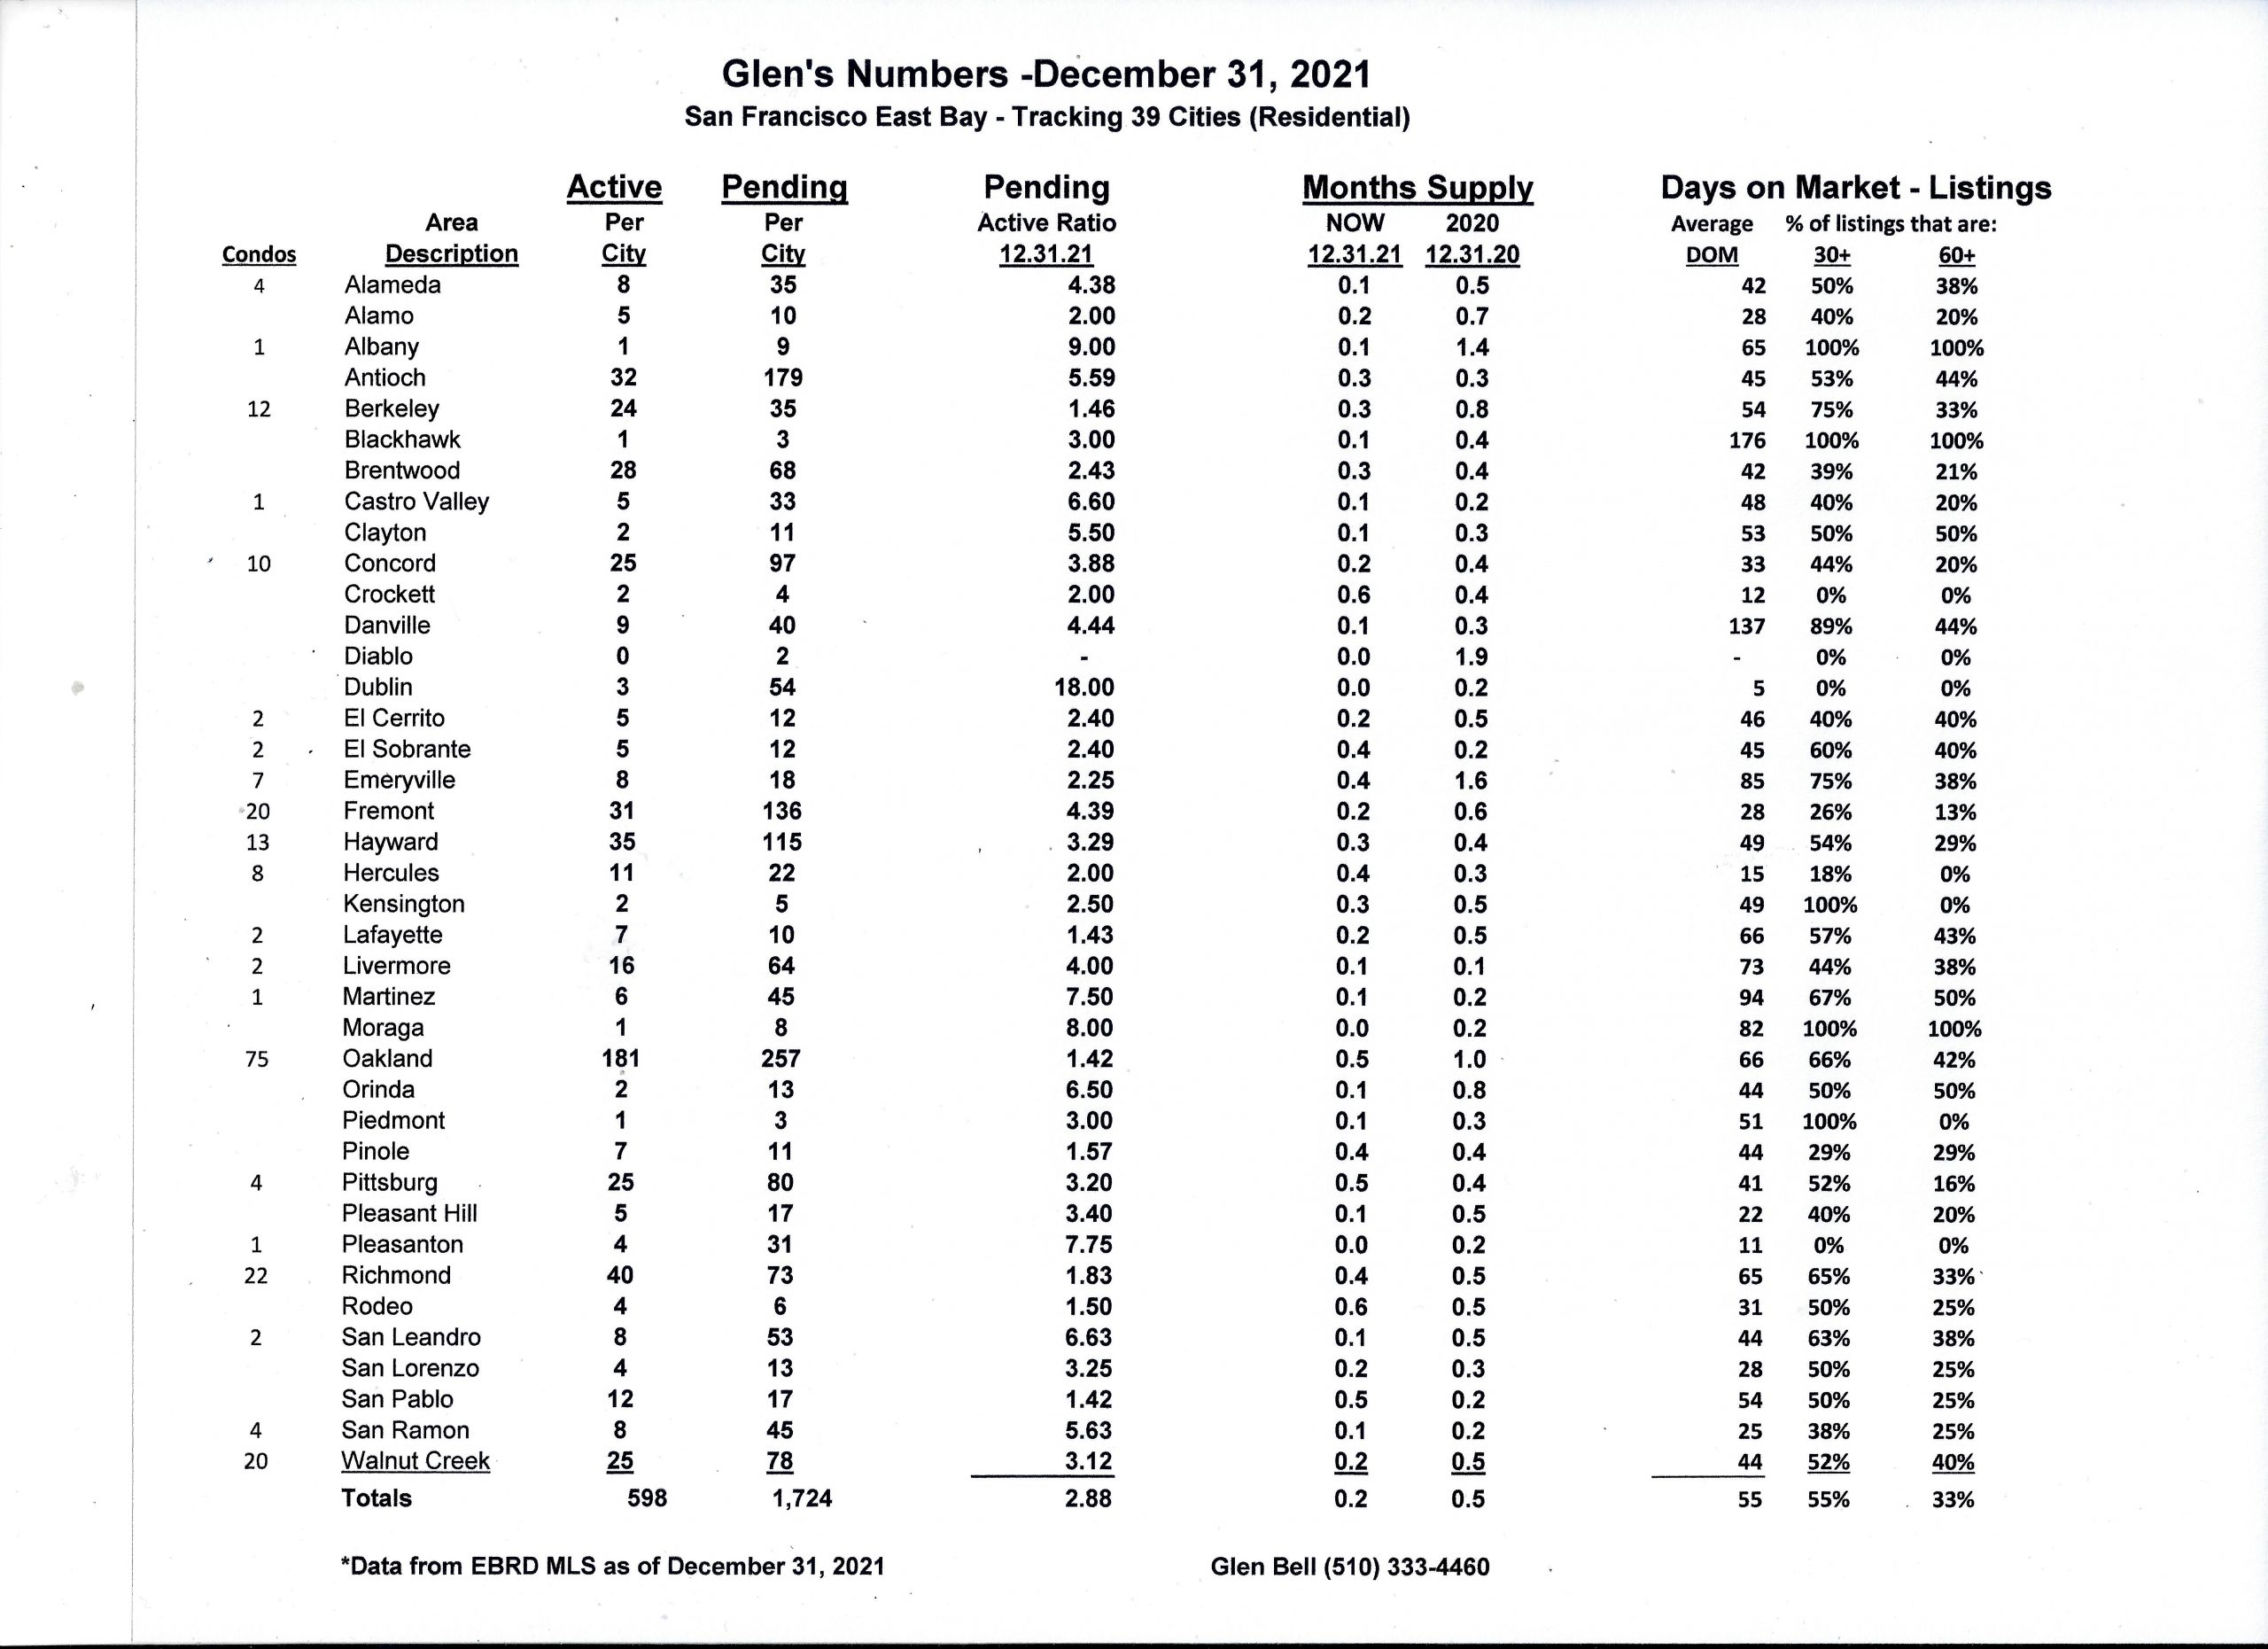
At the same time, the number of houses for sale has dropped, creating even greater pressure on home prices. Last year at this time we experienced a 55% drop in November and December of 2020. Seasonality has always been a huge factor, but this was more than normal. This year we saw an even greater reduction, a 70% reduction of inventory for November and December of 2021. As of December 31, 2021, there were only 598 homes listed for sale in the 39 cities that I track. Approximately 55% of those listings are homes that have been sitting for 30 days or longer. I’ve been tracking statistics since 2007, and this is the lowest number of homes for sale that I’ve ever seen. This leaves us with only a 6 day supply of homes, compared to a 15 day supply last year.
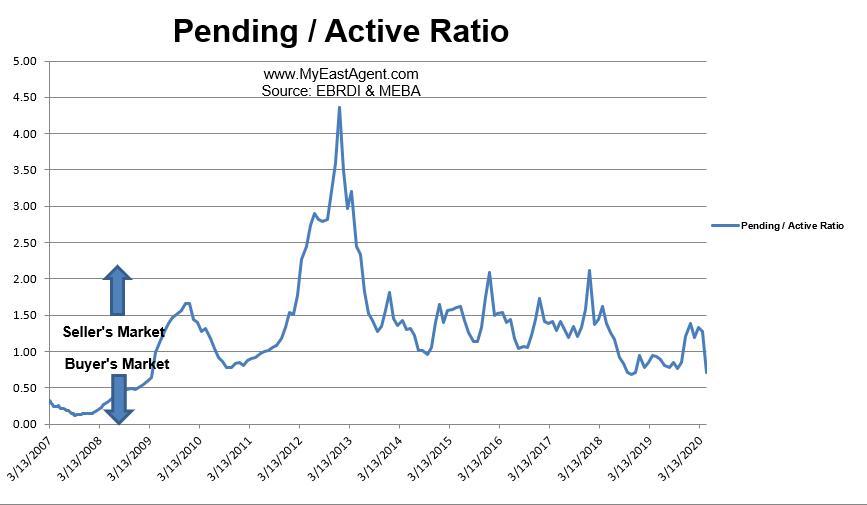
Our supply and demand ratio, (or pending over actives) has jumped up to 2.88, it’s highest level since March of 2013. I rarely see this ratio go over 2, indicating a “strong Sellers” market.
The pending/active ratio has been a benchmark that we’ve used as a measure of supply and demand to determine whether we’re in a buyer’s or a seller’s market. Typically, a number well above 1, (more inventory, or supply, with fewer pending sales, or demand) favors sellers.
Asked “Will home prices fall?
“The question on the minds of sellers, buyers, homeowners, and just about everyone else is whether prices might actually fall. Sorry, buyers, that likely won’t happen anytime soon.”
“You’ve still got a lot of young people who have still not bought a home but who would like to,” says Realtor.com Chief Economist Danielle Hale. “Anytime the market starts to cool, you’ve got people on the sidelines waiting for their chance to get in. That keeps both home sales and home prices from declining too much.”
I expect more homes to hit the market this spring, but doubt it will be enough to resolve the problem of demand.
You can read what some of the experts are predicting for 2022 in the articles shared below.
Here are some highlights for the 39 East Bay Cities that I track:
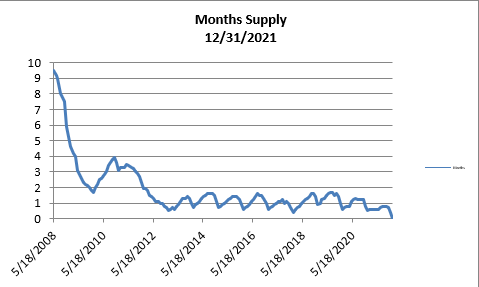
- The month’s supply for the combined 39 city area is only 6 days. Historically, a 2 to 3 months’ supply is considered normal in the San Francisco East Bay Area. As you can see from the graph above, this is normally a repetitive pattern over the past four years. Last year we saw a 15 day supply at this time.
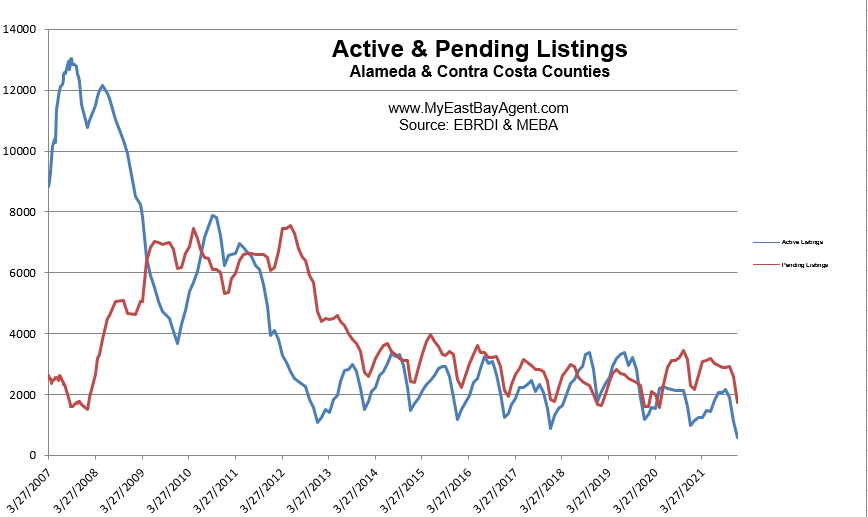
- Our inventory for the East Bay (the 39 cities tracked) is now at 598 homes actively for sale. This is lower than what we saw last year at this time, of 971. We’re used to seeing between 3,000 and 6,000 homes in a “normal” market in the San Francisco East Bay Area. Pending sales decreased to 1,724, also lower than what we saw last year at this time of 2,293.
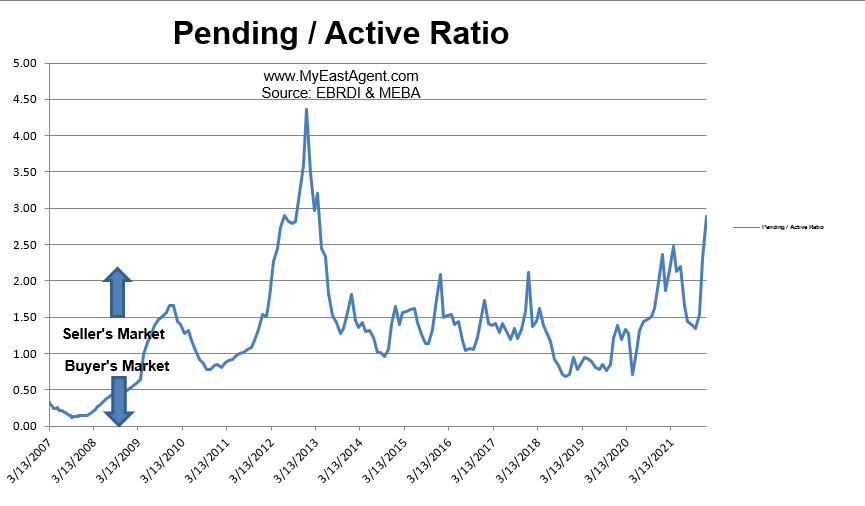
- Our Pending/Active Ratio is 2.88. Last year at this time it was 2.36
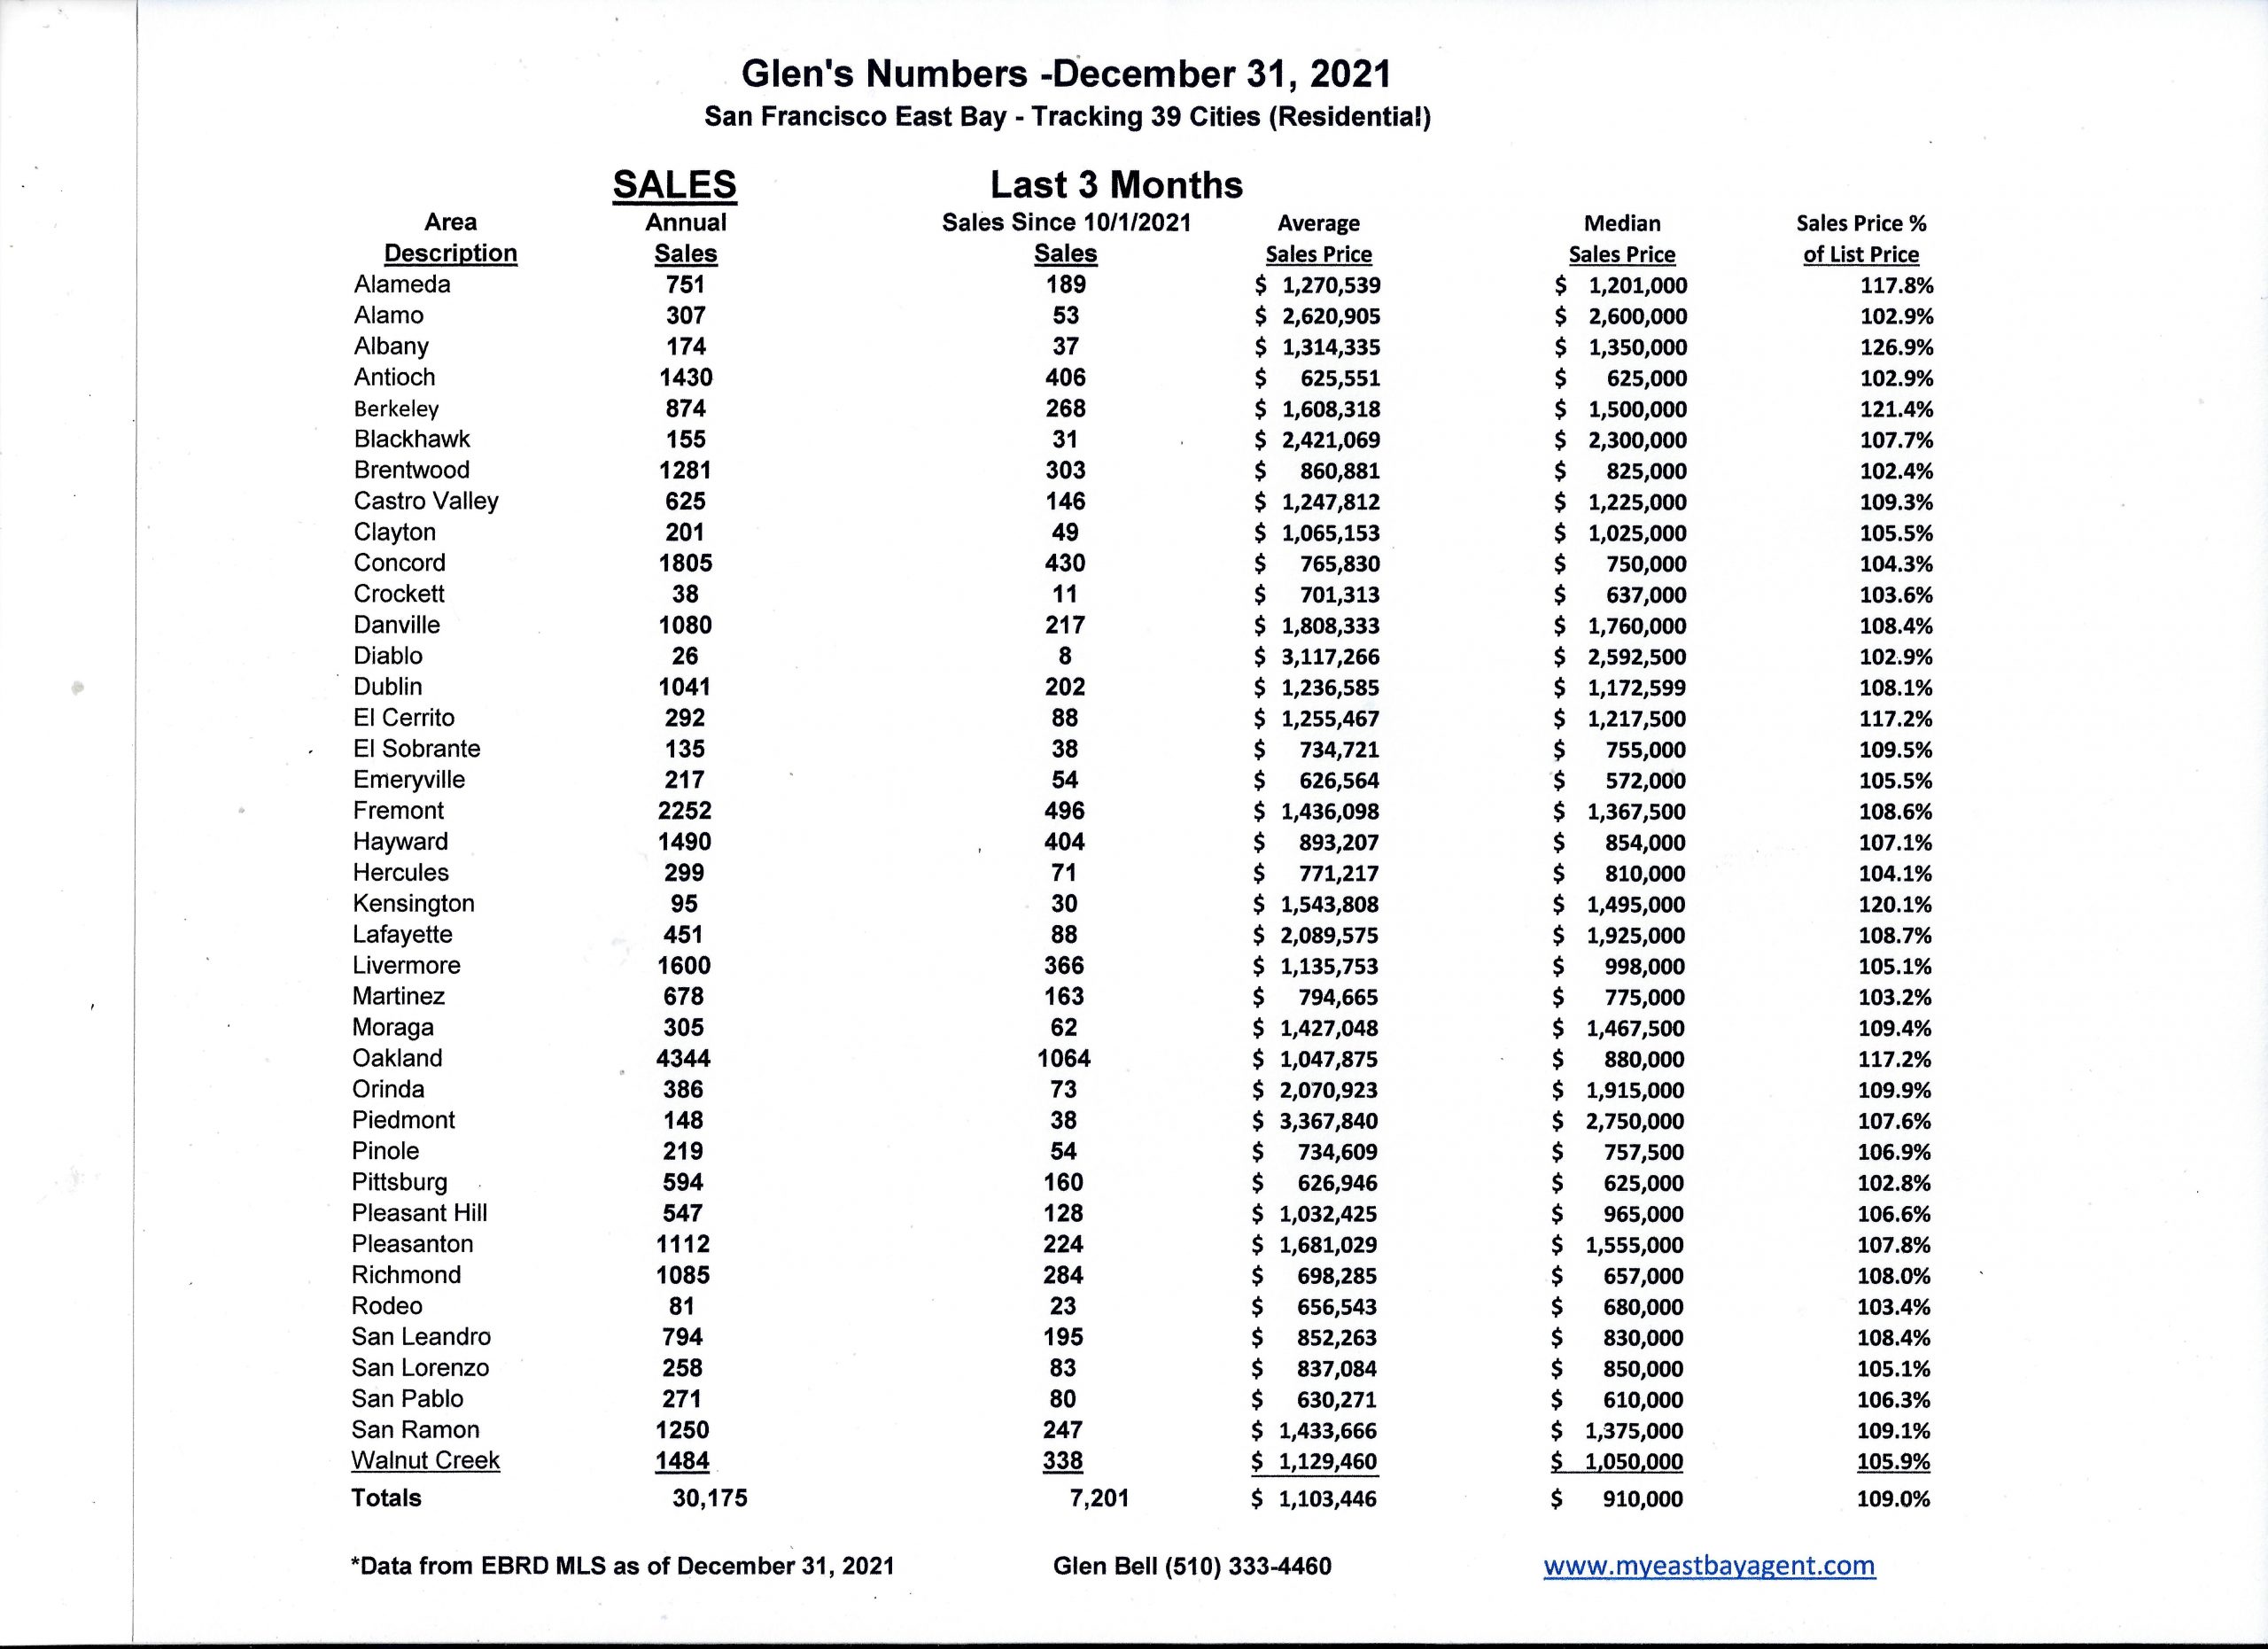
- Sales over the last 3 months, on average, are 9.0% over the asking price for this area, much higher than what we saw last year at this time, of 4.9%.
Recent News
Experts predict what’s next for the Bay Area real estate market in 2022
By Tessa McLean, SFGATE, December 29, 2021
When the COVID-19 pandemic hit the Bay Area, many expected the real estate market to tank. While it certainly slowed for a bit as open houses were prohibited and residents stayed in their homes, it quickly picked back up, fueling a competitive market with low inventory and a strong set of buyers rethinking their living spaces. That continued into 2021 as the suburbs stayed king, demand outstripped supply, and, at least in the Bay Area, many residents have yet to return to an office. Now, with a still very uncertain future ahead of us, what’s next for the Bay Area housing market? We talked with local experts in the home buying and rental market to get their opinions on what’s to come.
It’s still going to be a seller’s market
Every real estate agent we spoke with agreed that 2022 is still likely to be a seller’s market in the Bay Area. Even as interest rates are projected to go up, the demand for homes will still be greater than the inventory, especially for single family homes, in the region. “In the history of United States real estate, being a seller in San Francisco right now is the single best opportunity you’re ever going to have in your lifetime,” said San Francisco real estate agent Aaron Bellings of Compass. “… I think San Francisco is going to have a banner year. If I was thinking about selling in the next 6 to 12 months I wouldn’t hesitate to put my house on the market.”
He said much of that demand is from buyers that were starting to look in 2021 and still haven’t found a place. “I see the spring being absolutely crazy again. I have buyers right now that are chomping at the bit to get in there and there’s nothing out there for them,” Bellings said. “It’s going to be a strong market.”
Nina Hatvany, a real estate agent in San Francisco for over 30 years, said the amount of quality, single family homes on the market is usually low in the city, but those houses are now in particularly short supply. Plus, between the continuing pandemic and the inevitable hike in interest rates, now is the time to put a home on the market. “It’s definitely a good time to sell,” Hatvany said. “… I would definitely take advantage since we don’t know what the future will bring.”
Khrista Jarvis, an East Bay Compass real estate agent, said the robust seller’s market translates into a tough buyer’s market — especially in the East Bay. “It’s frustrating to be a buyer in this market. There are multiple offers, bidding wars, paying $200,000 over asking is just the norm,” she said. “You have to be super competitive and sometimes make offers several times before you get a house.”
Jarvis said the region continues to be particularly hot for buyers from San Francisco as many are still looking for more space than they can get in the city.
Seasonality has disappeared
The old adage says that if you’re going to put your home on the market, you better wait until after the Super Bowl. And you definitely can’t sell a home during the winter. Today, none of that holds true. “We’re going to go into a very strong season right away,” Jarvis said. “Usually the market waits until spring, but this year it’s going to start really early. Seasonality is out the window. I think it’s just busy all year round now. Even December. I thought I’d get a break for the holidays and that’s just not the case.”
Bellings said there is still some seasonality, just not in the way it exists in other major markets. “We really don’t have an off-season. It really just comes down to whether people are in town to actually look at and bid on the homes put on the market,” he said. “Usually we start to see pick up post-President’s Day, but I wouldn’t be surprised if things start to pick up mid- to late January this year.”
Everyone is watching interest rates
Interest rates are going up, it’s just a matter of when. If the Fed sticks to their plans, prospective buyers and sellers are going to have to keep that in mind in 2022. “It is going to create a sense of urgency,” Bellings said. “I’ve already had buyers reach out to me and say we need to make this happen before the Fed starts hiking rates. People are already starting to feel the pressure even though we don’t know when this is going to happen and how high the rates will go.”
For sellers, that means the time is now. “It would be wise to move quickly if you want to be in the driver’s seat when it comes to selling your home,” said Daryl Fairweather, Redfin’s chief economist. “For the second half of 2022, if mortgage rates increase, that could definitely put the brakes on demand and make it harder to sell a home.”
Even if rates creep up to 4%, that’s still historically low, especially for an area with as much wealth as the Bay Area has. “In other places I would expect the housing market to slow down significantly, but San Francisco is on a different trajectory,” Fairweather said. “There will be more demand for homes than there was this year. … What I think is the Bay Area will look more like the rest of the country in terms of how quickly prices grow, how many homes sell over list price.”
Rent will probably go up
As the home buying market reached new heights over the past year and a half, the rental market in San Francisco, Oakland and San Jose did the opposite. These Bay Area cities are some of the only places in the country where rent has yet to creep back up to pre-pandemic levels, even allowing San Francisco to lose its throne as the most expensive rental market in the country to New York, according to Zumper. Experts have speculated that’s due to the Bay Area’s embracing of remote work amid the pandemic, though many offices won’t stay closed forever.
“General inflation will probably push rent up eventually, but if offices keep getting pushed back that will still keep them down relatively,” Zumper data journalist Jeff Andrews said. “The fundamentals are all pointing to rent going up again.”
He also expects some of the seasonality of the rental market to return this year, after being more volatile since early 2020.
While Zumper found that New York City surpassed SF as the most expensive rental market in 2021, “San Francisco still stands out as the most expensive market on our platform,” said Rob Warnock, research associate at Apartment List. “But, the Bay Area is the last remaining place where there is a discount,” he said. “… That said, I think prices are going to go up again in the early parts of [2022].”
Warnock said since the Bay Area has been one of the places most amenable to remote and flexible work, it also could affect trends across SF neighborhoods. Prices in areas downtown, like SoMa, may still remain at a deep discount while more western neighborhoods like the Sunset may keep their slightly inflated rates.
Space is still a must
“Zoom rooms” and Peloton bikes became must-haves as the pandemic wore on, and none of the agents we spoke with saw that going away anytime soon. “I’m not seeing the desire for home offices or gyms go away at all,” Hatvany said. “It’s become a very locked-in thing. It’s a complete essential in ways that it never was.”
Hatvany has even seen some new “amenities” emerge — like being located near a Slow Street. She said just as parks are great nearby amenities for a home buyer, slow streets now hold the same desirability.
Outdoor space is still crucial for most clients, said Josh Dickinson, the founder of real estate agency Zip Code East Bay, and he’s even seeing more sellers get creative to upgrade that outdoor space. There’s even been a rise in ADU-like spaces, like upgrading a shed in the backyard that can be used as a multipurpose space.
Even with their confident predictions, there wasn’t one person that didn’t mention the feeling of uncertainty that still lies ahead as we continue into the next phase of the pandemic. “I think we’re all just anxious to see what is it all going to look like when we get back to the point where people are going back to the office and all the COVID numbers are declining,” Dickinson said. “It in some ways seems like we’re still a long way from there.”
Housing Market Predictions 2022: Will Prices Drop?
By Natalie Campisi, Forbes Advisor, December 28, 2021
The housing market has been breaking new records across multiple fronts throughout 2021, leaving home shoppers wondering if they should buy now or wait in the hope that more homes become available, and at more affordable prices in 2022.
So far, home price appreciation is up year-over-year (YOY) by 18.5% in the third quarter, the highest level in the Federal Housing Finance Agency (FHFA) House Price Index history. Inflation has shot up at the fastest pace since 1982. At the same time, the number of houses for sale has dropped, creating greater pressure on home prices.
Housing supply plunged to its lowest level in history, with just 1.38 million homes on the market in June, down 23% annually. Buyers scooped up homes faster than ever before, shrinking the number of days homes spent on the market to a record-low of just 15 days.
And mortgage rates are holding steady around the 3.1% mark for a 30-year, fixed-rate mortgage–although it’s not the lowest on books, it’s mighty close.
Here’s what this means for 2022, according to housing experts.
Will Home Prices Rise In 2022?
Depending on whether you’re the buyer or seller, you might be very happy or very disappointed to learn that home prices are poised to rise in 2022, most experts say. While headwinds like rising mortgage rates and a significant uptick in Covid-19 cases may impede price growth, they won’t stop home price appreciation from climbing.
“Much of what drove high price growth this year will follow us into next year,” says Nicole Bachaud, an economist at Zillow. “We will expect to see prices rising at extremely high levels for the first few months of 2022 before beginning to taper off towards more normal levels.”
Most experts say housing demand will stay strong in 2022 unless inflation continues to outrun wages at the current feverish pace, which could stall buyer appetite. Rising inflation is also putting renters in a pinch who can no longer afford to save as much for a down payment when rental rates are skyrocketing.
The national average rental price for a one-bedroom jumped 21.3% and more than 16.7% for a two-bedroom in October on a YOY basis, according to the latest Apartment Guide and Rent.com report.
“What can affect demand is the affordability challenge,” says Danielle Hale, chief economist at Realtor.com. “One thing that can offset that is a more competitive labor market.”
A recent survey by the Conference Board suggests a 3.9% in wage costs for companies in 2022, which would be the highest jump in salaries since 2008. But even this bump wouldn’t make it easier for most entry-level buyers to access homeownership.
The wild card that could cool home prices is getting Covid under control enough that it would convince people to move back to big cities, says Todd Teta, chief product and technology officer at Attom, a property data firm. He also says that the reverse could happen—a spike in Covid cases, for example—stoking more interest in suburban real estate.
“If the pandemic fades, interest in rental housing in congested urban areas could rekindle, especially if employers start demanding that more workers return to their offices. That could significantly reduce buyer demand and ease the pressure on prices,” Teta says. But “all of this will depend on how many more people with the means to buy are worried about where they live now and how the pandemic proceeds.”
It’s important to note that while these are national trends, real estate is local. So while places like Boise, Idaho had a 37.3% price jump YOY, Philadelphia saw more modest price growth of 9.9% during the same period.
Home Inventory Predictions for 2022
A major determinant of home price trends is how much supply is available relative to demand. One way to gauge this is to look at the months’ supply of homes for sale, which estimates how long the existing inventory for sale would last based on the current sales rate if no more new houses were built.
The lowest months’ supply for 2021 was in January, with just 3.6 months’ supply and the highest was in August with 6.6 months, a considerable jump, according to the Federal Reserve Bank of St. Louis. Although supply gradually picked up in spring through late 2021, some forecasters expect supply to slacken.
For one, new home construction is getting hampered by the rising cost of building materials and a severe shortage of labor. All building materials, from copper to steel, have jumped in cost but lumber prices, in particular, have hit astronomical price increases. The futures price of lumber jumped to an all-time high of $1,670 per thousand board feet in May. It began to cool in the summer, dropping to $454 per thousand board feet in August. However, it shot back up to more than $1,044 as of December 20.
Amid the affordability crisis in housing, the Biden administration is moving to make the costs of lumber even more expensive. The Commerce Department said November 24 that it will nearly double tariffs on softwood lumber imported from Canada from an average of 8.99% to 17.99% on their imports.
Several lawmakers and major trade groups like the National Association of Homebuilders are calling for a reduction in Canadian tariffs as mounting lumber costs can topple the gains new home construction made in the past six months.
“With Biden doubling tariffs on Canadian lumber, it will add a lot of pressure on home costs and how long it takes to build a home,” says Robert Dietz, chief economist and senior vice president for economics and housing policy for the National Association of Home Builders. “That’s why you see the median price of a new home above $400,000.”
The median price of a new house was $407,700 in October, up 17.5% from a year ago, according to the Federal Reserve Bank of St. Louis. New home prices have been climbing at an accelerated rate since the Covid-19 pandemic began. In April 2020, the median new home price was $310,100, the lowest point before jumping nearly $100,000 more during a span of 18 months.
As for existing homes entering the market, much of that will depend on the pandemic, says Selma Hepp, deputy chief economist at CoreLogic, a real estate data analytics company.
“While Baby Boomers preferred to downsize prior to the pandemic, it appears that they are staying put for now,” Hepp says. “Up to now, there has not been a notable increase in for-sale inventory as Baby Boomers stayed put, and potentially hosted their children and family.”
Should You Buy a Home Now Or Wait?
Buyers with the means to buy a home now may be looking at pricing factors like interest rates when deciding whether to leap. However, first-time buyers face much steeper challenges, like rising down payment requirements.
As home prices escalate, so does the down payment and monthly mortgage costs. This means that some buyers might have to save up more money or look for less expensive housing. As more companies have allowed their employees to work remotely, some buyers have moved to more affordable areas, but that’s not the case for everyone.
James McGrath, a licensed real estate broker in New York and co-founder of Yoreevo, a residential brokerage, says demand will begin to cool in 2022, so there might be more availability for those who wait.
“It’s very hard for the amount of sales to remain at record levels when there isn’t much to sell,” McGrath says. “It seems all but certain that the number of transactions will decline. With this, buyers can be more patient. There should be less competition from buyers and more houses to choose from as we normalize on both.”
There are unforeseen variables that can alter the course of real estate at any time, so the best strategy is to make sure you can afford the house you buy and still have room to save up for rainy days. For example, if you’re buying with a partner or co-signer and they lose their job, make sure you can pay the mortgage with just one income.
You should also plan on living in it for at least five years or enough time to cover your closing costs, so you don’t end up losing money when you sell. A mortgage affordability calculator is a great tool for figuring out your budget.
Will the housing market continue its hot streak in 2022?
By Mike Simonsen, HousingWire, December 10, 2021
As we approach the end of another hot year for the market, homebuyers and sellers are eagerly looking ahead to the 2022 housing market. Will the market continue its streak of strong growth, or are we finally about to see a slow down?
Here’s a high-level forecast for what to expect next year, based on the supply and demand signals we can already see in today’s data. I’ll also highlight which variables we should be watching for unexpected market shifts.
1. Demand will continue to be strong into 2022.
The first signal we look at to forecast the strength of the housing market is days on market – how fast are homes moving? Right now, we’re seeing a median of 49 days on market and climbing, as it normally does this time of year. A typical December would see market time at 85-100 days, so you can see from the chart that demand is staying elevated later in the year, which is a bullish sign for next year.
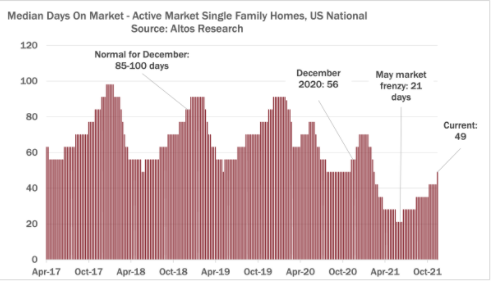
Due to the strong seasonal patterns, I predict days on market will hit a low of 21 days in April, tying the record-fast market times from earlier this year.
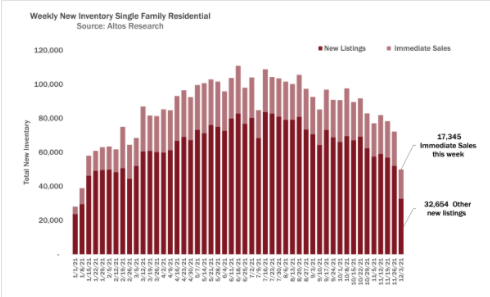
With homebuyer demand off the charts earlier this year, Altos Research began tracking the phenomenon we call “immediate sales.” You’ve probably seen this in your local market, where offers happen more or less immediately after the home gets listed for sale. At this moment, about 25% of properties are going into contract essentially immediately every week (around 20,000 of them within hours or days of listing) — even as supply and transaction volume declines through the end of the year.
I actually expected immediate sales to be dropping at this point, but it isn’t. Even over the Thanksgiving holiday, total volumes were down, but immediate sales as an indicator of demand were still dominant. The fact that this trend is continuing unabated into the winter indicates continued strong demand into next year.
That being said, if the housing market turns, immediate sales will be one of the first places we’ll be able to see it. For example, if buyers are cooled by higher interest rates, the first thing that’s going to happen is they’re not going to make those immediate offers.
Since it will take several months for rates to rise high enough to discourage buyers, we can expect immediate sales and all the related buyer competition characteristics (multiple offers, over-bidding) to remain common well into at least the second quarter of 2022.
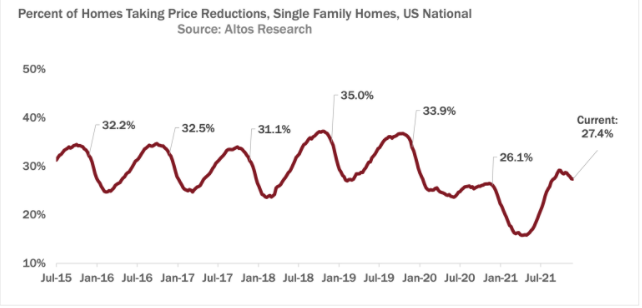
Another signal pointing to continued elevated demand is the percent of homes on the market taking price reductions. In a normal market, we tend to see about 30% to 35% of sellers initially over-price their homes and eventually reduce the price to attract buyers.
Right now price reductions are at 27%, and starting to tick down again after the fall peak in September. You can see that it’s higher than last year, but still lower than normal. Home sellers with properties on the market now know that the demand is there, and they don’t have to cut their prices. This tells us that the transactions for these homes that happen in the first quarter will still be priced very strongly.
2. Low inventory will continue to be a major issue.
Unfortunately for all these eager homebuyers, inventory continues to be at record low levels. We are currently at just over 350,000 single-family homes on the market. You can see from this chart that inventory has been on a downward trajectory for years, and recent strong demand has only accelerated this trend. You can also see that it’s normal for inventory to drop at this time of year, but it’s actually declining faster than I expected even a few weeks ago, which indicates that we’ll start 2022 with record- low levels of available inventory, even less than in 2021.
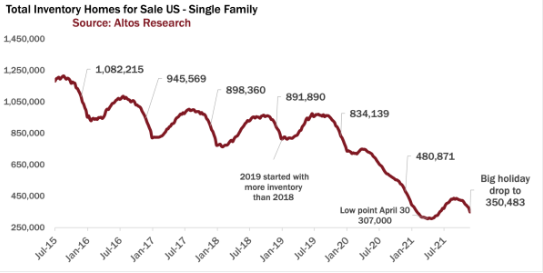
At this point, it looks like we’re going to end the year at just under 300,000 single-family homes for sale. If we’re lucky, we’ll start getting greater inventory in the housing market in February, then it’ll start climbing and be at a more normal curve next year, but we’re still miles away from a normal level, with no indication that we’ll return to our usual million homes anytime soon.
That being said, keep an eye on rising interest rates. If you look at the 2018 line in the inventory chart, you’ll see that inventory hadn’t yet declined by this time of year in 2018. Why? Because interest rates rose from around 3.9% to 4.9% between April and December, and that cooled the market enough that a little bit of inventory built up during 2018. You can see that 2019 was the only recent year that started with more inventory than the year before.
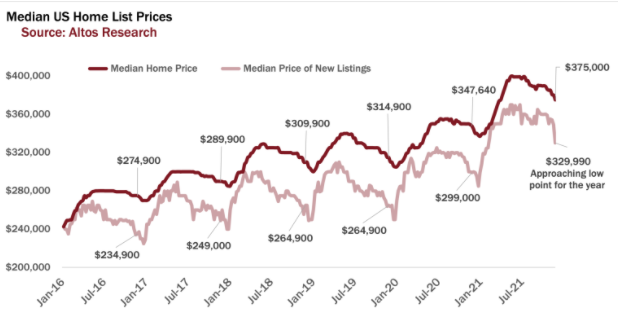
3. Home prices will remain high into 2022.
With demand showing no signs of cooling and record-low inventory, I expect home prices to remain high into next year. The median home price for single family homes this week is $375,000, which is about 10% higher than last year and where we are likely to end the year.
As we look towards 2022, all the leading indicators show tight inventory and strong demand keeping prices high — a strong seller’s market. If interest rates start rising, and we’re seeing inflation or other economic challenges, this could have a cooling effect on the market. These variables aren’t in the data yet, but they’re looming. We’ll want to keep watching the data closely to spot any major shifts.
Zillow’s Hot Housing Takes for 2022
By Zillow Research on Dec. 8, 2021
The housing market may not reach the incredible heights of 2021, but we expect it will be anything but slow next year. Expect the strong sellers market to persist, the Sun Belt to maintain its top spot as the most in-demand region, and flexible work options to continue to shape housing decisions in new ways in 2022.
The following are Zillow’s bold housing predictions for 2022. Whatever happens, the Zillow Economic Research team wishes you and yours a safe, healthy, prosperous and enjoyable year!
2022 will fall just short of record-breaking
2021 marked the hottest housing market in U.S. history by some measures, including Zillow’s Home Value Index. While we may not see those records broken in 2022, Zillow economists expect incredibly strong price growth and sales volume to continue.
Zillow’s forecast calls for 11% home value growth in 2022. That’s down from a projected 19.5% in 2021, a record year-end pace of home value appreciation, but would rank among the strongest years Zillow has tracked. Existing home sales are predicted to total 6.35 million, compared to an estimated 6.12 million this year. That would be the highest number of home sales in any year since 2006.
Sellers keep the upper hand
The usual seasonal cooldown in the housing market is reappearing this fall after a hiatus in 2020. Fewer homes are selling above list price, homes are staying on the market a few days longer than they did during the summer, and more sellers are cutting their price.
Zillow economists expect these metrics to trend slightly cooler in 2022, but don’t mistake that for a buyers market. The market forces that have given sellers the upper hand over the past two years or so — tight supply after years of underbuilding, and elevated demand due to remote work, U.S. demographics and low mortgage rates — will persist next year as well. Expect to see bidding wars on many homes, especially as the market heats up during the spring and summer shopping season.
Large rentals will be in high demand
Rising home values will impact the rental market as well. After a slowdown in the early months of the pandemic, rent prices came roaring back, especially in what were previously some of the most affordable markets. As rising costs make it harder to save for a down payment, expect demand for larger rentals to increase, including for single-family homes, as families stay in the rental market longer.
The ‘Sun Belt surge’ will extend to secondary markets
2021 was in many ways the year of the Sun Belt. Zillow predicted Austin would be the hottest market of 2021 as part of a “Sun Belt surge,” which proved to be the case — no metro has seen home values grow more than Austin so far this year, and all of the top destinations for long-distance movers were in the Sun Belt.
Zillow predicts this surge will extend to smaller Sun Belt cities in 2022 as price hikes in this year’s star markets make more-affordable nearby markets more attractive. From April to August, Austin held the top spot in quarter-over-quarter home value growth, which is a good indicator of current housing demand. As of October, the smaller Florida metros of Fort Myers and Sarasota held the top spots, and 24 of the top 25 markets were in sunny states – a sign of things to come in 2022.
More Gen Zers and millennials will buy a ‘second home’ before a primary residence
Americans are taking advantage of remote work flexibility to move to larger homes in more-affordable markets, but many will not want to commit to a new location full-time. This is often true for younger people who are attracted to the amenities of living in a city, where expensive housing is more likely to put homeownership out of reach.
With these factors in play, there may be more people buying what’s traditionally a second home — either a part-time vacation home or an investment property — before they buy a home as a primary residence.
Young people today are savvy watchers of the housing market, in part because of time spent Zillow surfing. Purchasing a “second” home in a market more affordable than the one they live in is a way to break into the market and start building equity while mortgage rates are low, possibly teaming up with friends or family to lessen the financial burden. Virtual home shopping tools available today, such as Zillow 3D Home tours, make buying a home in a far-flung location easier.
No end in sight for the renovation boom
In the race to buy a home in the ultracompetitive pandemic housing market, many buyers have had to make one or more compromises (81%). As prices and mortgage rates rise, expect many homeowners to upgrade their existing home rather than try to wade back into the market to trade up.
A Zillow survey of homeowners found nearly three-quarters would consider at least one home improvement project in the next year. The top projects on their to-do list are renovating a bathroom (52%) or kitchen (46%), adding or improving a home office space (31%), finishing a basement or attic (23%), adding a room (23%) or adding a separate dwelling unit (21%).
Work will play a key role in moving decisions
The rise of flexible work options has changed how heavily a short commute factors into where Americans live. Home buyers used to pay handsomely to live near downtown and reap the benefits of a quick trip to and from the workplace each day, but that dynamic flipped in much of the country last year as buyers prioritized affordability and extra space. In 2022, hybrid and fully remote work will continue to reshape which areas are most in demand as the pandemic winds down and more workers receive permanent guidance on their flexible work options.
Zillow economists expect fully remote workers to continue to seek affordable markets, like those in the Sun Belt and other nontraditional housing hot spots where they can afford to buy their first home or trade up for a bigger one. And amid the “Great Resignation” and a generally aging population, traditional retirement markets are likely to see elevated demand.
New construction gains will only be a drop in the bucket, despite best efforts of builders
The reason home prices are rising so quickly is economics 101: high demand and low supply. Zillow research shows that in the 35 largest housing markets alone, there has been a shortfall of 1.35 million new homes since 2008 because of a construction slowdown following the housing crash. Home builder confidence is sky-high, and builders are doing all they can to get houses up, but supply chain snags and labor shortages are limiting progress. The gap shrunk in 2021 and will likely shrink again in 2022, but the housing shortage will be a defining feature of the market once again next year.
Glen Bell – (510) 333-4460 jazzlines@sbcglobal.net
Glen’s SF East Bay Real Estate Market Update September 30, 2021
September 30, 2021 – Real Estate Market Numbers
By Glen Bell (510) 333-4460
We’re beginning to see a change in the market place. So, I’d like to start by quoting an article posted by Realtor.com on September 30, 2021;
“After a wild year of unprecedented price increases, a worsening shortage of homes for sale, and cutthroat bidding wars where offers six figures over the ask price weren’t uncommon, conditions are finally normalizing. More homes are expected to go up for sale this season just as many would-be buyers are either priced out or so fed up after losing out on home after home that they’re dropping out of the running.”
“With more folks sidelined, some of the steam has been let out of the market. Prices aren’t rising by as much as competition is down and homes are taking a little longer to sell, giving buyers some breathing room.”
“It’s not like the market is soft,” says Lawrence Yun, chief economist of the National Association of Realtors. “It’s just moving away from that extreme frenzy.”
My current statistics are supporting these comments. We’re still seeing a strong sellers’ market. Just not as crazy as what we were seeing February through May. We’ve seen a 48% increase in our inventory since the end of May and yet a 9.2% drop in pending sales.
The pending/active ratio has been a benchmark that we’ve used as a measure of supply and demand to determine whether we’re in a buyer’s or a seller’s market. Typically, a number well above 1, (more inventory, or supply, with fewer pending sales, or demand) favors sellers. A number below 1 favors buyers. I rarely see this ratio go over 2 and yet it’s remained above 2 February through May, (during the height of our crazy, competitive and frenzied market this year). The pending/active ratio is currently at 1.34 still indicating a strong “sellers’ market. However, this ratio has been steadily coming down from its’ high in March of 2.47.
“Things are settling down. There will still be some multiple offers, but it will be less tense,” says Lawrence Yun, chief economist of the National Association of Realtors®. He expects the days of homes receiving 20 to 30 offers are becoming a thing of the past. “And some homes are lingering on the market for a week or two without an offer.”
The average days on market are now up to 40 days for the East Bay listings, up considerably from its’ low in April of 16 days on market. The per centage of homes “sitting” for 30 days or longer is now 32%, up from it’s low in April of 17%. The bottom line is that homes are taking longer to sell and more are sitting.
Asked “Will home prices fall?
The question on the minds of sellers, buyers, homeowners, and just about everyone else is whether prices might actually fall. Sorry, buyers, that likely won’t happen anytime soon.
“You’ve still got a lot of young people who have still not bought a home but who would like to,” says Realtor.com Chief Economist Danielle Hale. “Anytime the market starts to cool, you’ve got people on the sidelines waiting for their chance to get in. That keeps both home sales and home prices from declining too much.”
She expects more homes to hit the market in October and through the end of the year. But it won’t be enough to ameliorate the problem of demand.
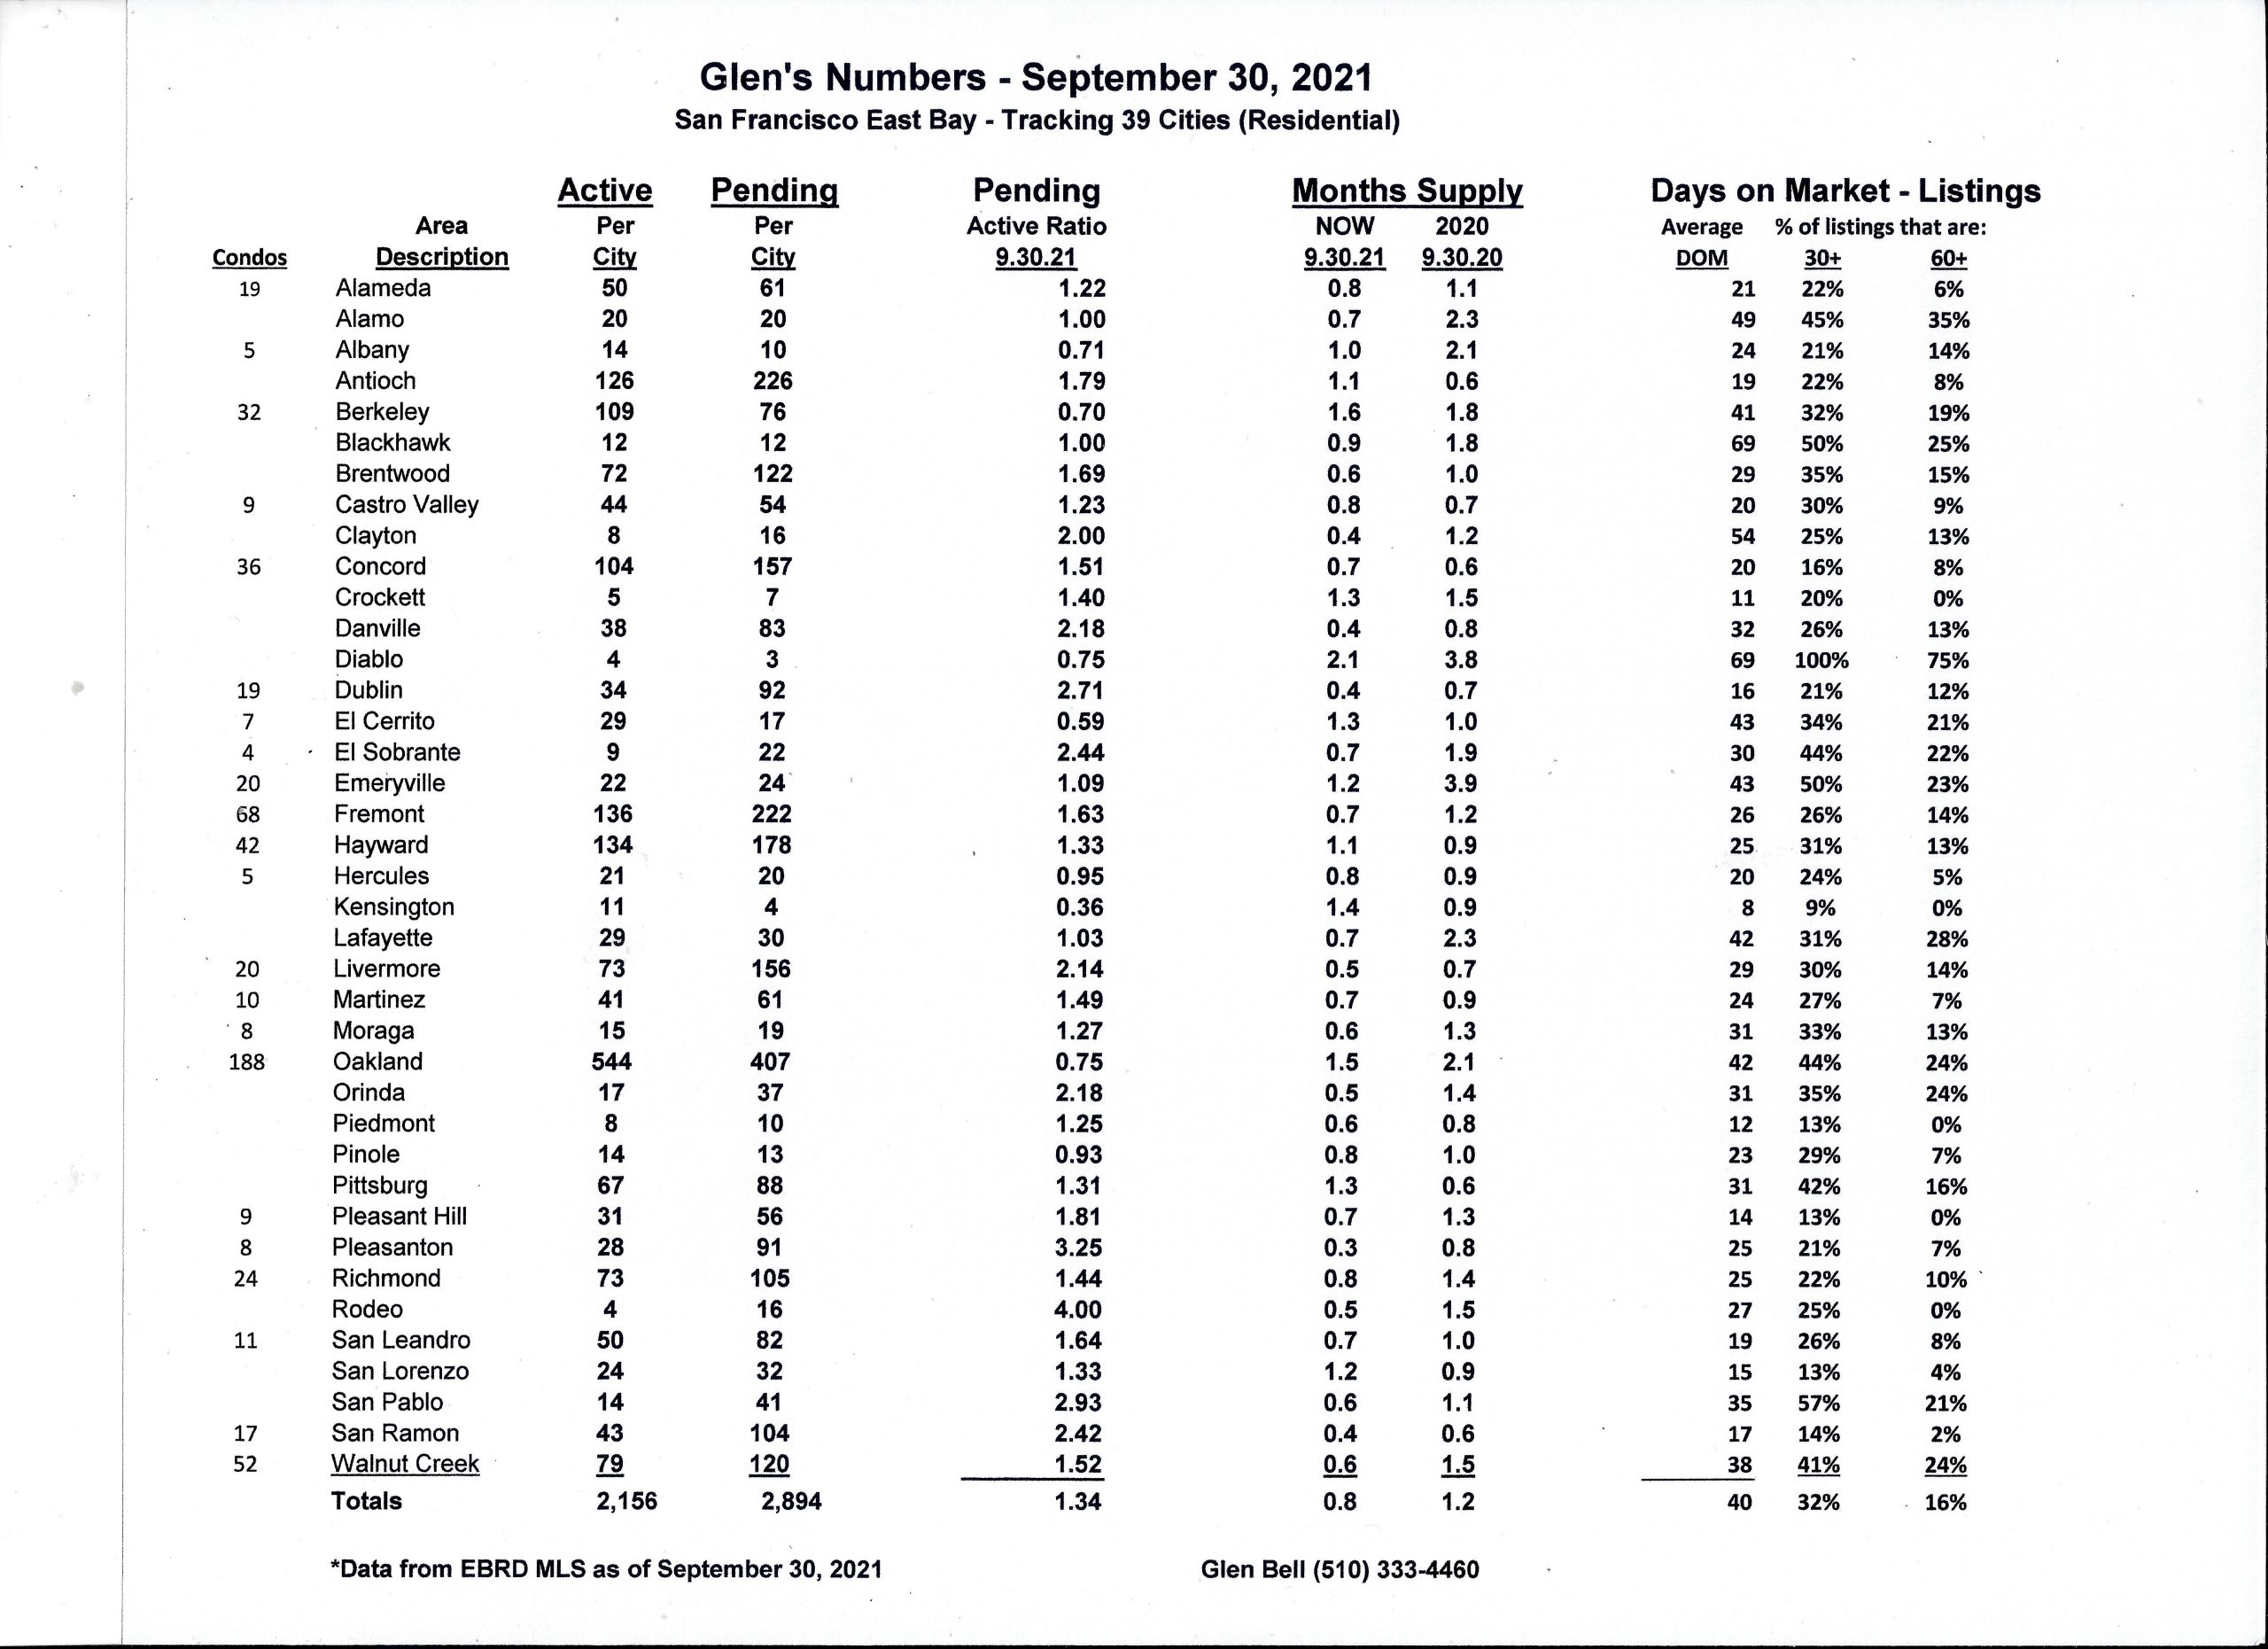
Here are some highlights for the 39 East Bay Cities that I track:
- The month’s supply for the combined 39 city area is 24 days. Historically, a 2 to 3 months’ supply is considered normal in the San Francisco East Bay Area. As you can see from the graph above, this is normally a repetitive pattern over the past four years.
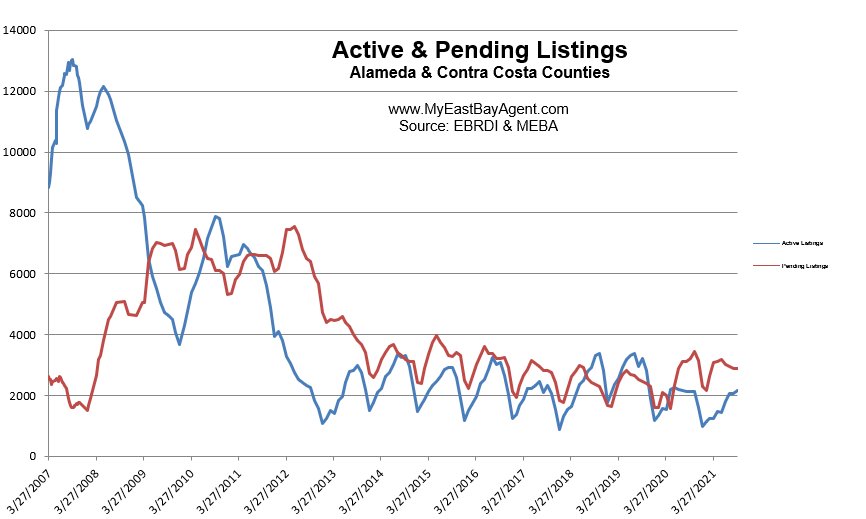
- Our inventory for the East Bay (the 39 cities tracked) is now at 2,156 homes actively for sale. This is roughly what we saw last year at this time, of 2,129. We’re used to seeing between 3,000 and 6,000 homes in a “normal” market in the San Francisco East Bay Area. Pending sales decreased to 2,894, lower than what we saw last year at this time of 3,205.
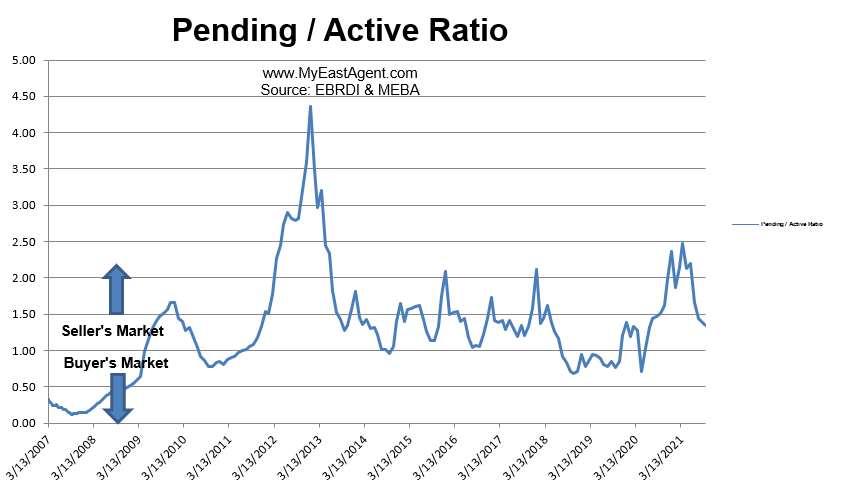
- Our Pending/Active Ratio is 1.34. This is down from our high of April of 2.47. Last year at this time it was 1.51
- Sales over the last 3 months, on average, are 9.8% over the asking price for this area, much higher than what we saw last year at this time, of 3.1%.
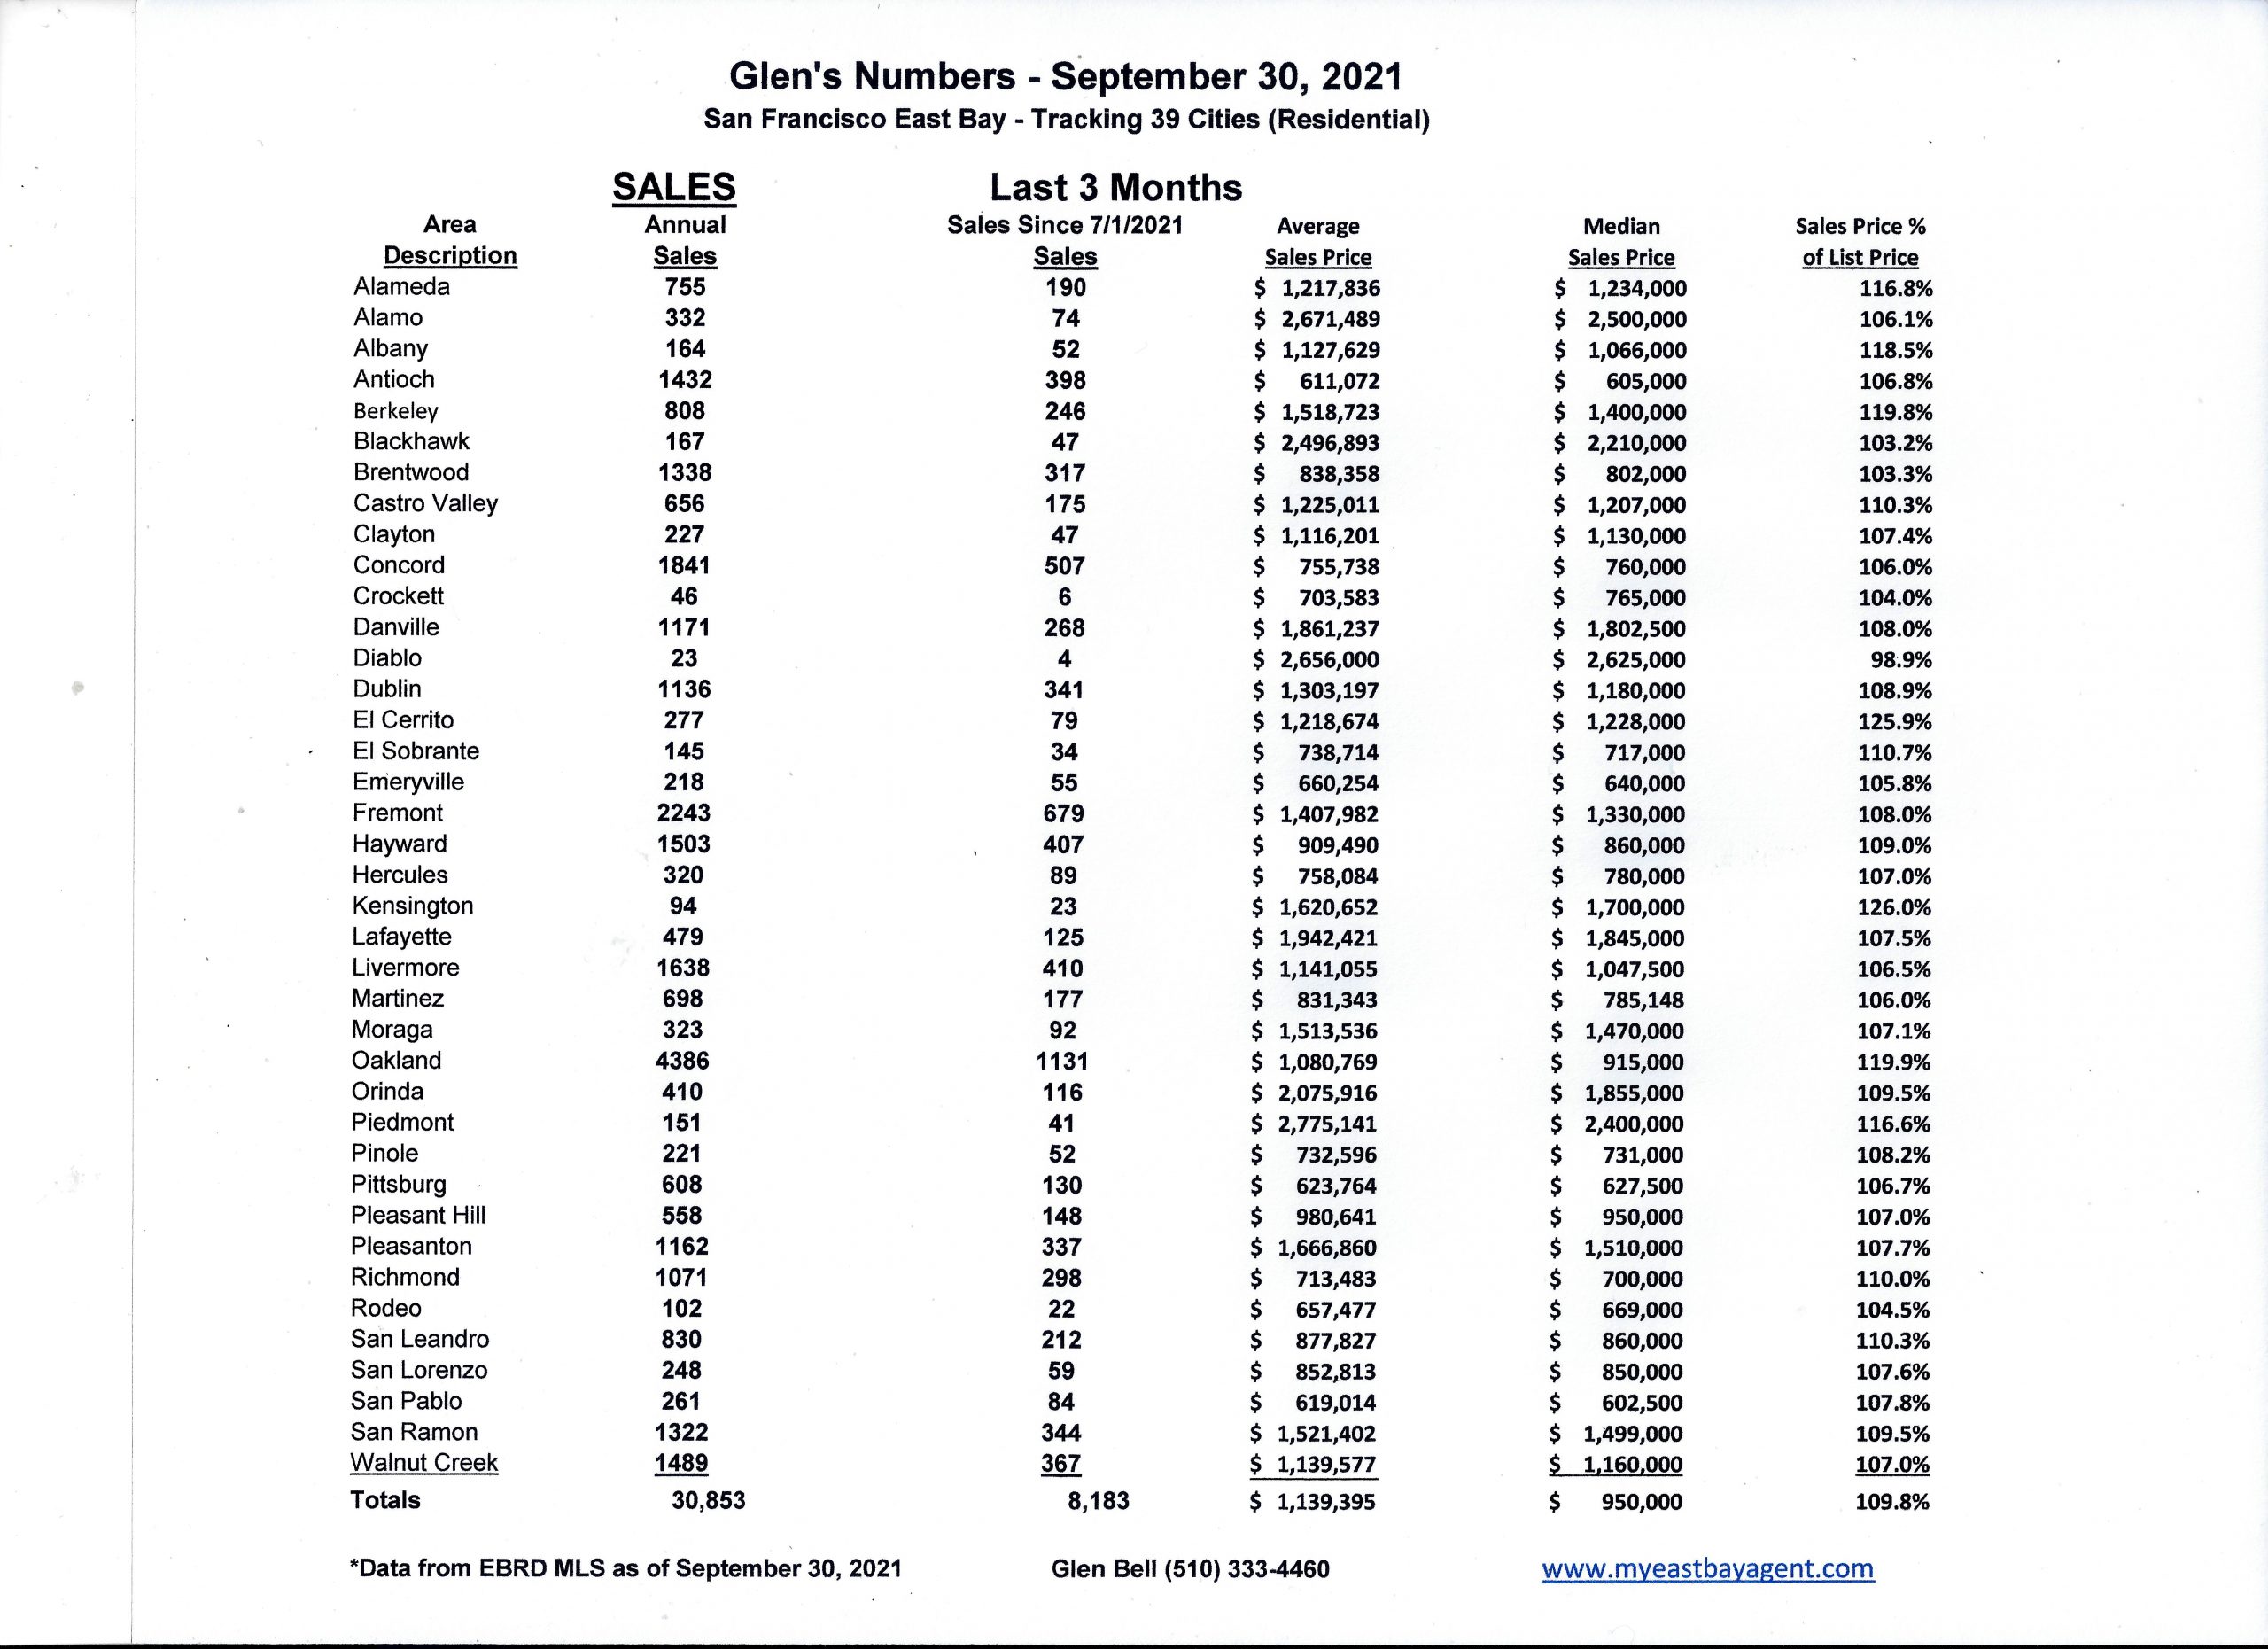
We’ve experienced such a big price increase this year, that I had to ask myself by how much. So, to give us an idea, here’s a spreadsheet showing the historical annual median price broken down by city. 2021 shown is year to date, through September 30th of this year. Keep in mind that these numbers will probably come down some due to seasonal influences where median price typically lowers as we approach the holidays.
Recent News
The Fever Has Broken’: Is the Housing Market Frenzy Really Going To Cool Off This Fall?
By Clare Trapasso, Realtor.com, Sep 30, 2021
Over the next few weeks and months, the long-overheated U.S. housing market is expected to continue to cool off in the bracing chill of autumn.
After a wild year of unprecedented price increases, a worsening shortage of homes for sale, and cutthroat bidding wars where offers six figures over the ask price weren’t uncommon, conditions are finally normalizing. More homes are expected to go up for sale this season just as many would-be buyers are either priced out or so fed up after losing out on home after home that they’re dropping out of the running.
“The fever in the housing market has broken,” says Ali Wolf, chief economist of building consultancy Zonda. “There have been buyers that have just been beat down for the last six months—and after losing so many homes and going through the emotional roller coaster, they’ve decided to stop searching for now. There are more homes on the market than there were six months ago.”
During the COVID-19 pandemic, record-low mortgage interest rates, below 3%, helped many homebuyers to absorb prices that reached all-time highs in the spring and summer. But prices rose so high so quickly that even bargain mortgage rates couldn’t offset them enough to give buyers some needed financial relief.
With more folks sidelined, some of the steam has been let out of the market. Prices aren’t rising by as much as competition is down and homes are taking a little longer to sell, giving buyers some breathing room.
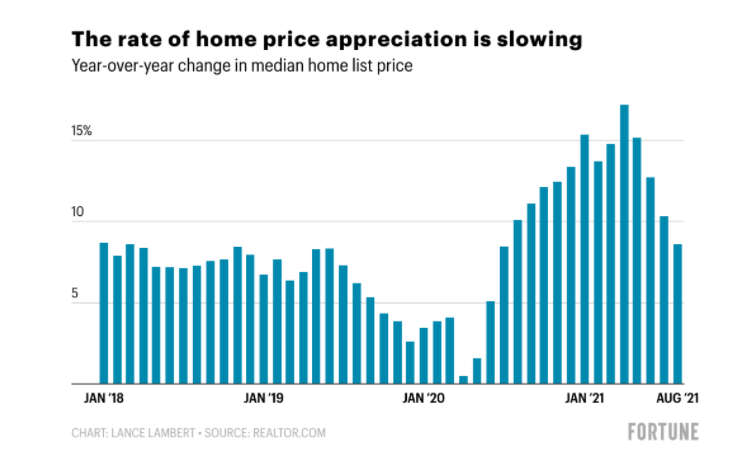
In September, the rate of year-over-year growth was halved, to 8.6%, down from its peak of 17.2% in April, according to Realtor.com® data. This means the median list price of a home grew half as fast as in the spring. Homes also took a bit longer to sell, at about 43 days. While that’s down 11 days from the same month last year and 22 days from 2019, it’s up 6 days from June.
“Things are settling down. There will still be some multiple offers, but it will be less tense,” says Lawrence Yun, chief economist of the National Association of Realtors®. He expects the days of homes receiving 20 to 30 offers are becoming a thing of the past. “And some homes are lingering on the market for a week or two without an offer.”
This fall, buyers may once again be able to include contingencies in their offers, such as requiring home inspections and appraisals, and still win out bidding wars. They may even—gasp—get homes at the list price.
All-cash offers could also dip if buyers don’t need to cash out their savings, stocks, and cryptocurrency stashes to stand out from the competition.
“It’s not like the market is soft,” says Yun. “It’s just moving away from that extreme frenzy.”
The changes in the housing market may be coinciding with the seasonal slowdown. Typically, competition is fierce in the summer as families battle over larger homes in the suburbs, hoping to secure residences and settle in before the kids start school. Then the market slows down with less competition for the smaller homes that traditionally go up for sale.
Yun expects annual price increases will slow to a more normal level, around 5%, versus the double-digit price hikes that reigned earlier in the year. But this may not be true for every home in every part of the country.
“If you want a reasonably priced home in a desirable area, be ready to still face stiff competition,” says Zonda’s Wolf.
Will home prices fall?
The question on the minds of sellers, buyers, homeowners, and just about everyone else is whether prices might actually fall. Sorry, buyers, that likely won’t happen anytime soon.
The nation is still suffering from a severe housing shortage resulting in more buyers than there are abodes for sale. This is a continuing hangover from the Great Recession’s aftermath, when builders largely held off on building while investors bought up single-family homes and turned them into rentals. Meanwhile, the millennial generation is larger than the previous one, meaning there are more prospective buyers than there were a decade or so ago.
There’s plenty of pent-up demand for homes.
“You’ve still got a lot of young people who have still not bought a home but who would like to,” says Realtor.com Chief Economist Danielle Hale. “Anytime the market starts to cool, you’ve got people on the sidelines waiting for their chance to get in. That keeps both home sales and home prices from declining too much.”
She expects more homes to hit the market in October and through the end of the year. But it won’t be enough to ameliorate the problem of demand.
The nation is still short about 5 million homes, Hale says. As builders can’t get them up fast enough, she expects it will take between five and six years before there are enough homes for sale to meet demand.
New construction is beginning to pick up after months of builders contending with shortages in lumber, labor, materials, and appliances. While there are still delays compared with before the pandemic, there was about a 5% uptick in construction in August compared with July, says Zonda’s Wolf.
“Inventory is still very, very tight,” says Wolf. But “we’re up from the bottom. We expect to see a little more inventory trickle onto the market through the end of this year and into next year.”
Rising mortgage rates will likely keep high prices under control
Rising mortgage interest rates are expected to keep price growth in check: After all, buyers can afford to fork over only so much for their monthly housing payments. So if rates rise, buyers won’t be able to afford more expensive properties.
This could result in lower price growth, or prices going flat or even dipping a little in certain markets.
“Once mortgage rates push up a little bit, it’s going to combine with higher home prices to price people out of the market,” says Mark Zandi, chief economist of Moody’s Analytics. “Some markets could see prices go down a little, like in the most juiced markets. … [But] it’s not a crash.”
Rates are expected to top 3% by the end of the year and reach 4% by the end of 2022, says Joel Kan, an economist at the Mortgage Bankers Association. They averaged 2.88% for a 30-year fixed-rate loan in the week ending Sept. 23, according to the most recent Freddie Mac data.
Historically speaking, even 4% is still low. Over the past 20 years, mortgage rates averaged about 5%, according to MBA. The difference between a 3% and a 4% rate on a $380,000 home (the median list price nationally) was about $169 a month on a 30-year fixed-rate loan. That adds up to nearly $61,000 over the life of the loan.
“We’re expecting rates to increase moderately over the next 12 months,” says Kan. “As the economy improves, as the job market improves, typically that pushes rates higher. [But] there is a little bit more uncertainty now, given that we’ve seen the pandemic linger longer than we expected.”
How will the fall market affect home sellers?
While experts predict the housing market will remain firmly in the seller’s court, the days of picking prices out of thin air are likely coming to an end. The same goes for not making any improvements to a property (let alone having it properly cleaned) before listing it.
“Some sellers got a little too greedy or had a misconception about the market conditions,” says NAR’s Yun.
Zonda’s Wolf recommends sellers look at comps of other homes in their neighborhoods that have recently sold to get a realistic idea of what they can charge for their properties. They should also get their homes in tiptop shape. And while they may not get 20 offers like their neighbors may have received a few months ago, well-priced, move-in ready homes are in high demand.
“If you’re a seller today, you’ll likely still get top dollar, but you’re still going to have to put in the work,” adds Wolf. “Dust for cobwebs, stage the home, put on a fresh coat of paint.”
Where home prices are going next, according to forecast models
BY LANCE LAMBERT, Fortune, September 21, 2021
The COVID-19 housing market—underpinned by remote work, pandemic-induced low mortgage rates, and a demographic wave of first-time homebuyers—has been among the hottest in the nation’s history. Since the onset of the crisis, median home list prices are up 23%.
Recently, some of that exuberance has finally left the market. Indeed, since bottoming out this spring, housing inventory is up 30% as some homebuyers start to balk at record prices, and more sellers—who fear losing out on big gains—are listing. While the market is clearly still a seller’s market, it has inched a bit in buyers’ favor in recent months.
But what does softening in the housing market mean for home price growth?
The consensus among the industry’s forecast models is that we’re headed for slower growth, albeit still positive. The weakest projection comes from real estate research firm CoreLogic, which is forecasting just a 2.7% appreciation in the coming 12 months. Meanwhile, John Burns Real Estate Consulting and Freddie Mac—which do calendar year forecasts—project home price growth of 4% and 5.3%, respectively, in 2022.
“Annual home price growth was the most that we have ever seen in the 45-year history of the CoreLogic Home Price Index. This price gain has far exceeded income growth and eroded affordability, wrote Frank Nothaft, chief economist for CoreLogic, in his latest market outlook report. “In the coming months this will temper demand and lead to a slowing in price growth.”
Already, we’re starting to see this slowing appreciation materialize in the market. Between April 2020 and April 2021, median home prices on Realtor.com skyrocketed 17.2%. But over the most recent 12-month period, that rate was just 8.6% year over year. While this represents numerical “softening,” it’s easy to imagine how it might not feel like it to the typical homebuyer. After all, 8.6% is still well above most Americans’ annual pay bump.
How can home prices keep rising after posting such large gains? It all comes down to supply and demand. As Fortune has previously reported, we’re in the middle of the five-year period during which the largest chunk of millennials, those born between 1989 and 1993, are hitting their thirties—the age when first-time homebuying really kicks into gear. Meanwhile, housing supply is simply outmatched: Reeling from the 2008 housing bust, homebuilders spent the past decade playing it safe rather than aggressively building what this demographic wave would need. As a result, the U.S. is now under-built by around 4 million homes, according to a recent analysis by Freddie Mac.
But strong fundamentals don’t mean the market is free of risk.
The biggest wild card is Federal Reserve Chair Jerome Powell. If inflation-concerned central bankers raise interest rates sooner than expected, it would translate into downward pressure on real estate prices.
The second unknown is tied to the end of federal pandemic protections. At the end of September, the mortgage forbearance program—which currently protects 1.5 million homeowners—will begin to wind down. Some of those struggling borrowers could opt to sell their home. The latest forecast by Zillow estimates 25% of those forbearance mortgage holders will list their home. While that would certainly increase housing inventory, it wouldn’t fundamentally change the current market. However, Zillow researchers write if they’re wrong, and it’s actually 50% of forbearance borrowers who list their homes, then the market would see “a significant deterioration from current conditions.”
Zillow Market Pulse:
By Matthew Speakman on Sep. 17, 2021
The housing market remains very competitive but slowing home value appreciation indicates that the frenzy from earlier in the year is quieting down. An increase in for-sale inventory reinforces this narrative and looks to be increasing home shopper confidence. Interest rates remain low, but trended firmly upward toward the end of the week in anticipation of a Fed announcement.
Home value growth cools even as annual appreciation sets new records
- The national Zillow Home Value Index (ZHVI) increased by 17.7% in August from a year ago.
- Monthly ZHVI appreciation cooled 0.22 percentage points from July to 1.75%.
Inventory levels grow for a fourth straight month, coinciding with an uptick in home purchase applications
- More than 1.1 million homes were for sale in August, up 4.1% from July.
- Applications for home purchase mortgages increased by 7.6% last week from the week before, according to the Mortgage Bankers Association.
Mortgage rates end the week higher in anticipation of a key Fed announcement
- Mortgage rates now sit at their highest level in about two months.
- Investors believe that the Federal Reserve could announce plans next week to tighten monetary policy.
So what?
- As the summer nears its end, the housing market remains very warm, but it has gotten distinctly cooler from earlier in the year. Home values continue to grow at a record-fast annual pace: The nation’s typical home value – as measured by the Zillow Home Value Index (ZHVI) – grew 17.7% in August from the same month in 2020, setting a new all-time high annual growth rate for the fourth straight month. The typical home value in the US in August has increased by more than $45,000 from a year ago. But while the annual appreciation continues to set new records, monthly home value growth has begun to soften. National ZHVI increased by 1.75% in August from July, a slower monthly pace than the 1.97% monthly clip registered in July. While monthly ZHVI appreciation in August was the third strongest month-over-month reading in Zillow data history, the one-month deceleration from July the sharpest since July 2020. Taken together, the figures illustrate that the housing market remains very competitive, but that it is also actively cooling from its white-hot state. Leading indicators of home price growth reinforce this dynamic. Of the for-sale listings that went pending last week, 78% of them did so after being on the market for fewer than 30 days. That’s down from a high of more than 85% earlier in the year, but still more than 25 percentage points higher than the shares in the same weeks in 2018 and 2019.
- The softening home price pressure is due in part to increasing levels of for-sale inventory. After consistently plumbing new lows for almost a year, the number of for-sale homes on the market has risen for four consecutive months. While inventory levels are still down significantly (22.7%) from a year ago, the recent uptick in listings has afforded eager home shoppers more options and appears to have assisted in boosting their confidence. The share of people who believe it is a good time to buy a home – as measured by Fannie Mae – ticked up four percentage points in August from July, the first monthly improvement since March. The measure remains near all-time lows, but the monthly improvement was an encouraging sign for the market. And this increased optimism is also showing signs of materializing into home purchases. The Mortgage Bankers’ Association’s index of home purchase mortgage applications increased by 7.6% last week from the week prior. The measure – a leading indicator of home sales in the coming months – has improved in six of the last eight weeks and now sits at its highest level since April.
- One trend that could threaten this budding momentum in home sales activity are recent increases in mortgage rates. Rates had stayed relatively flat for the last few weeks, but they ended the week by making some sharp upward moves and now sit at their highest level since July. The upward momentum came even as a key reading on inflation showed price growth slowed last month, indicating that sky high inflation may finally be starting to cool (though other measures of inflation suggest that price growth may be accelerating and broadening beyond a few select industries). Inflation is a key factor for mortgage rate movements, as rising prices weaken the value of bonds, causing yields to rise and, usually, mortgage rates to follow suit. Whether or not mortgage rates will continue this upward momentum or revert to recent lows will depend more heavily on a key policy announcement next week from the Federal Reserve. The Fed has hinted they may announce a planned shift toward tighter monetary policy this month, but recent weaker-than-expected reports on the labor market and other key sectors, as well as the ongoing surge in COVID cases across the country, may have weakened their case. For now, mortgage rates remain very low and will likely continue to offer attractive financial conditions for housing market shoppers looking to buy their home.
Glen Bell – (510) 333-4460 jazzlines@sbcglobal.net
Glen’s SF East Bay Real Estate Market Update April 30, 2020
SF East Bay Real Estate Market Update
April 30, 2020
By Glen Bell (510) 333-4460
Everyone seems to be asking the question of how will the COVID-19 “shelter in place” mandate effect the real estate market and how will we come out of it later in the year. There’s been so much speculation with a number of different opinions coming from a number of sources. Keep in mind that this is “unchartered territory” and we won’t have definitive answers for quite some time. So much has changed. We as agents are very limited in what we can do during this period. A lot will be riding on how long it takes before we’re able to really go back to work, how long it takes for the COVID-19 fears to subside, how will the economy fair and what will the jobs situation looks like by then.
As agents, the market has paused as our lives have. Preparing a home for market has been delayed, and fewer new listings are coming on, due to the many challenges of being able to properly market them. Brokerages temporarily closed their doors with agents primarily working remotely from their homes. There are no open house showings while physical individual showings are discouraged and have come to a crawl. COVID-19 has disrupted all of our lives. The uncertainty and concern for our health and well-being for not only ourselves, but our family and friends, is foremost in all of our minds.
That being said, let’s take a look at how the market stands at the end of April. We haven’t seen dramatic changes just yet. What we have seen is a “mixed” bag. However, I say that only by looking at the numbers up until April 30th. Everyone asks me to pull out your crystal ball and tell us what’s going to happen.
For me, I’ve always been a firm believer in supply and demand concepts. For example, in real estate, the number of houses for sale always represented our supply, while the number of homes that have gone into contract, or pendings, represented our demand. What kind of a market, a buyers’ or a sellers’, is determined based on the relationship of these two numbers at any given time. During the REO days, there was a huge inventory, with few buyers, thus a buyers’ market. For most of the past 6 years, markets experienced a strong sellers’ market with very few listings and lots of buyers. For most of last year, we had moved back towards a more neutral or balanced market. When inventory “fell off the cliff” in November 2019, a month earlier than normal, it set up for a strong sellers’ market again early spring and that’s exactly what happened. Very little to look at with lots buyers trying to take advantage of extremely low interest rates. We saw more competition and increased prices early on. Then COVID-19 hit.
What we’ve seen since COVID-19, is that if sellers did not already have their home listed for sale, many decided to delay or postpone coming onto the market until some of the uncertainty subsides. Many buyers have jumped back on the fence and are holding off. The uncertainty of their job being in jeopardy, a loss in income, health fears, or seeing a “big hit” in their stock portfolio has taken its toll.
The lack of inventory early this year had “flipped” our markets back into a sellers’ market temporarily. However, it seems to be setting up for another big change to come by as early as this summer. There’s a large number of sellers who took a wait and see attitude over COVID-19 who may come back onto the market then. This could come in waves with some wanting to see first how the market is doing before they put their home up for sale. There may even be more who took financial hits and feel that they now “must sell.” So, we’ll probably see a fairly large supply of homes come onto the market over the summer. Many buyers on the other hand have backed off and may not be in a financial position to purchase by then. So perhaps the strong demand that we’re used to seeing in the Bay Area will begin to decrease. This will probably pull us back into a more neutral or balanced market, or possibly even into a buyers’ market for the first time in years.
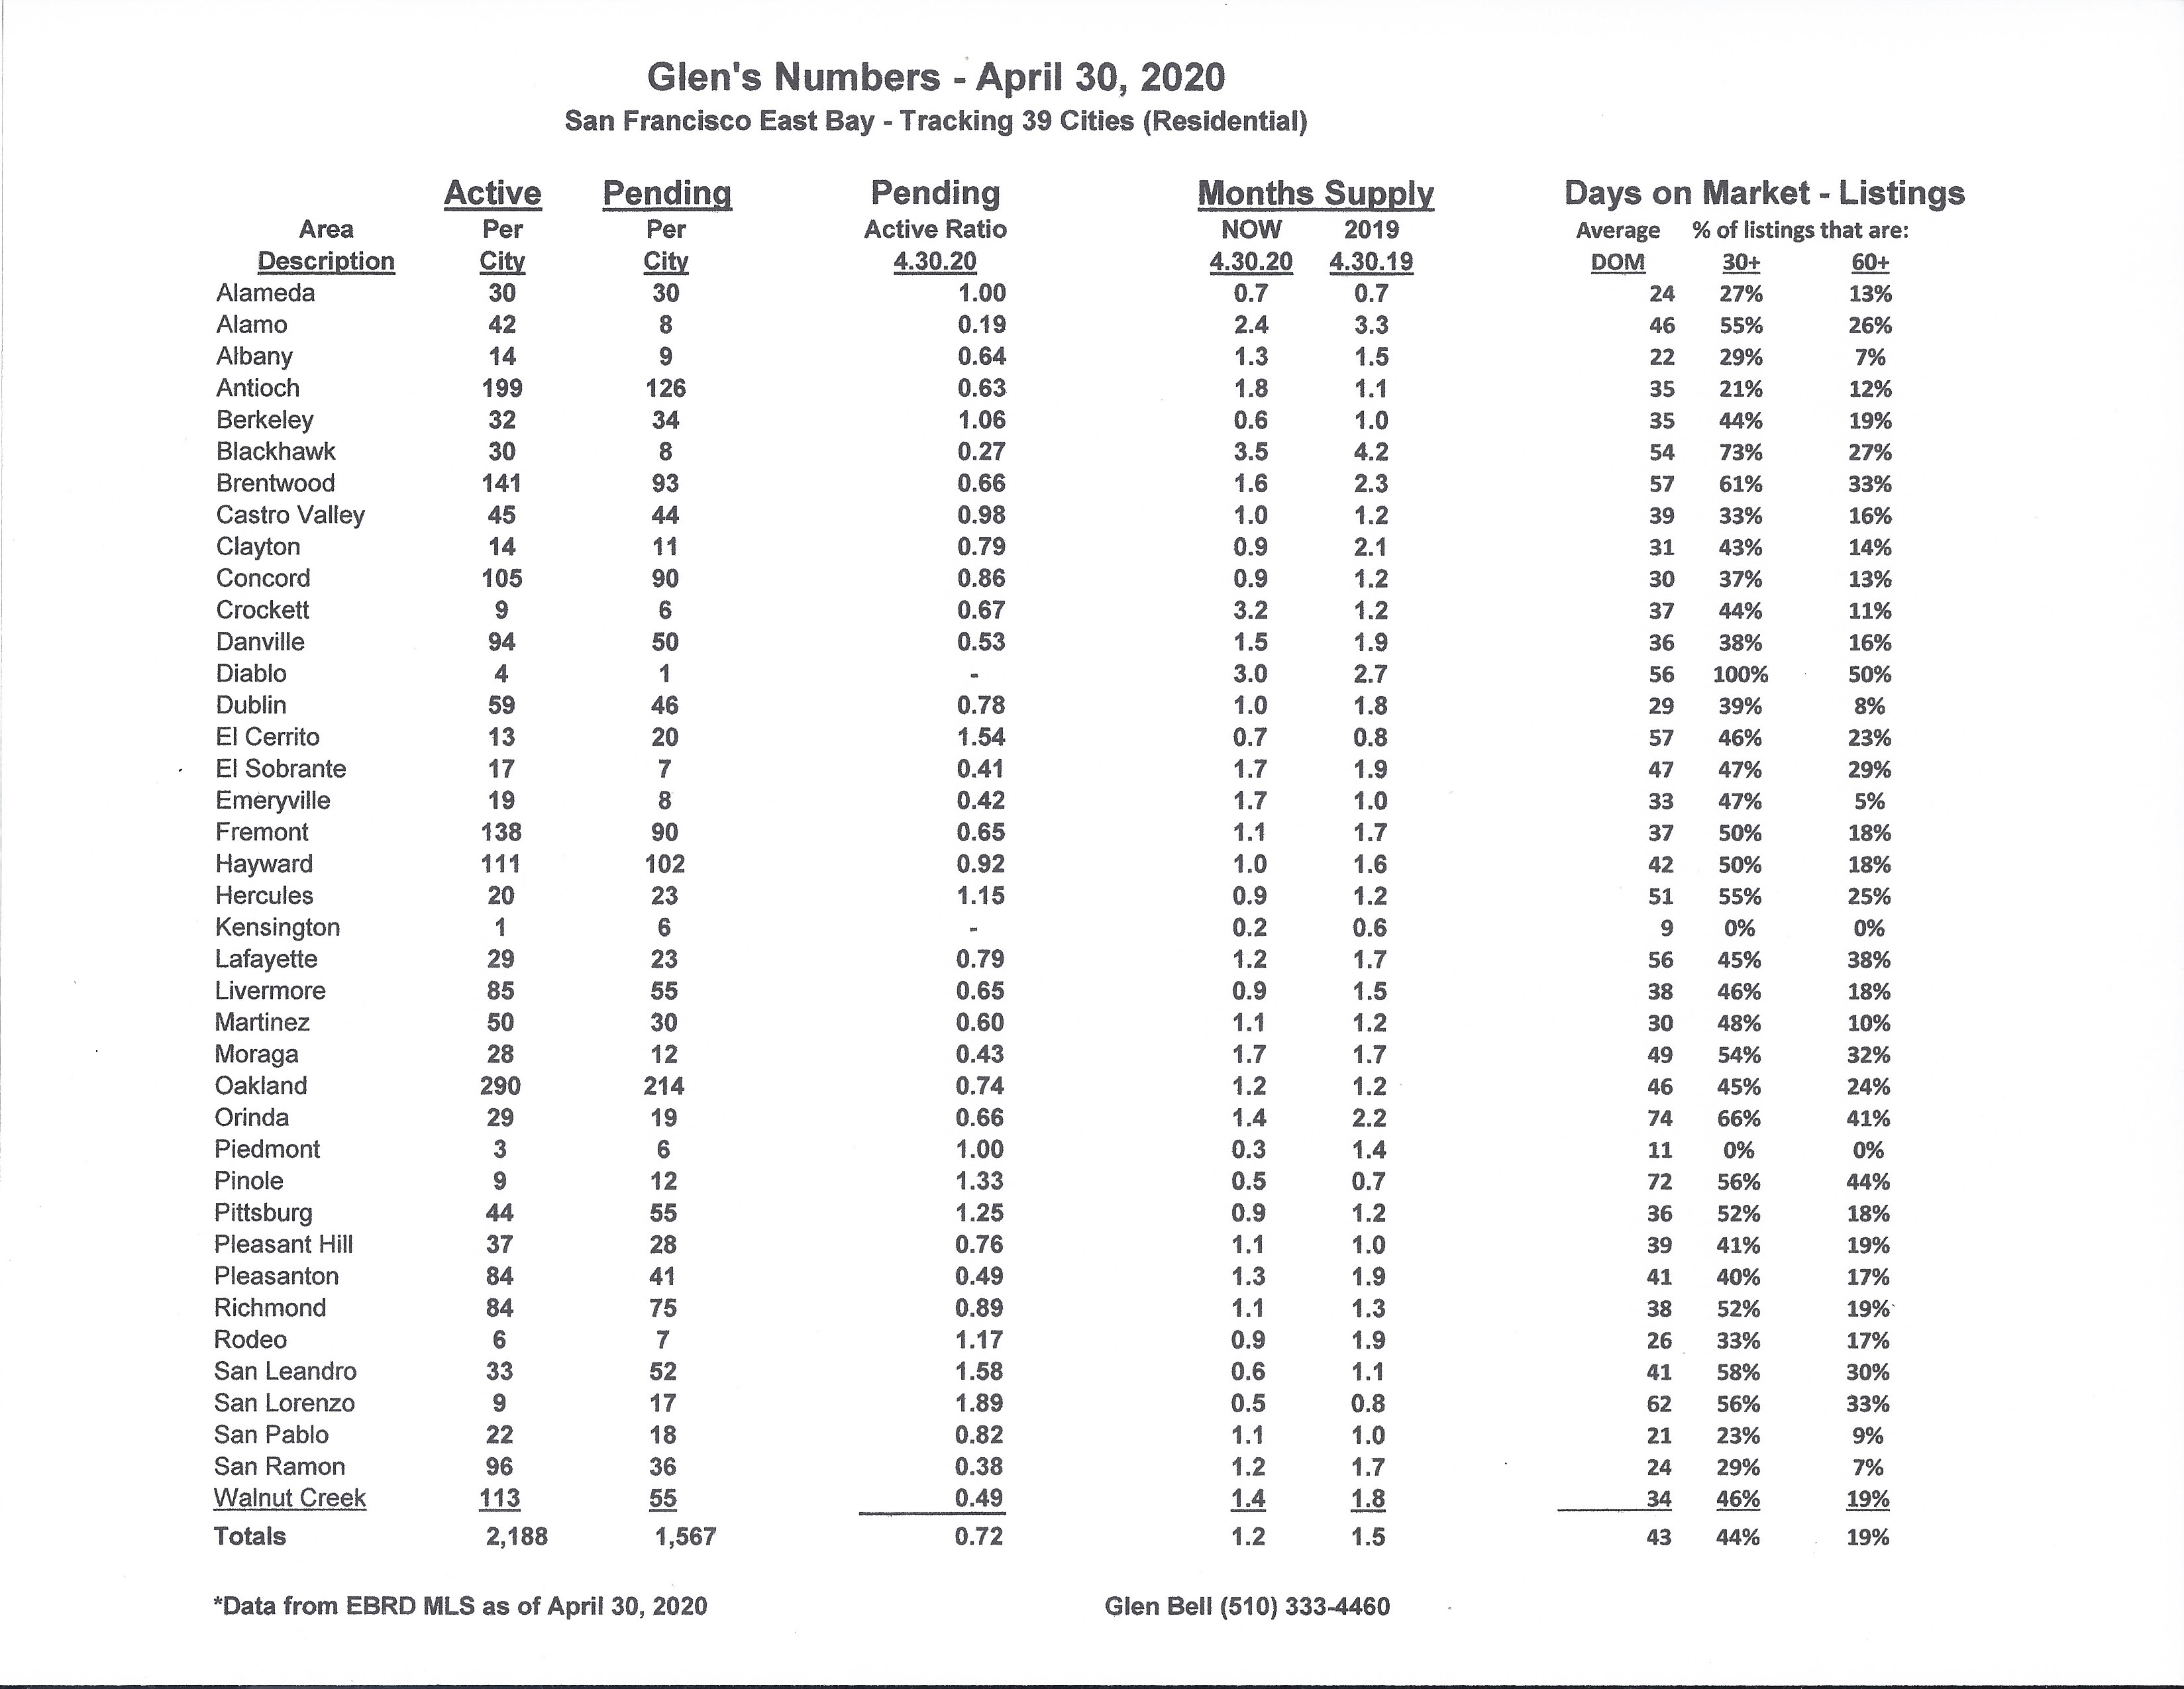
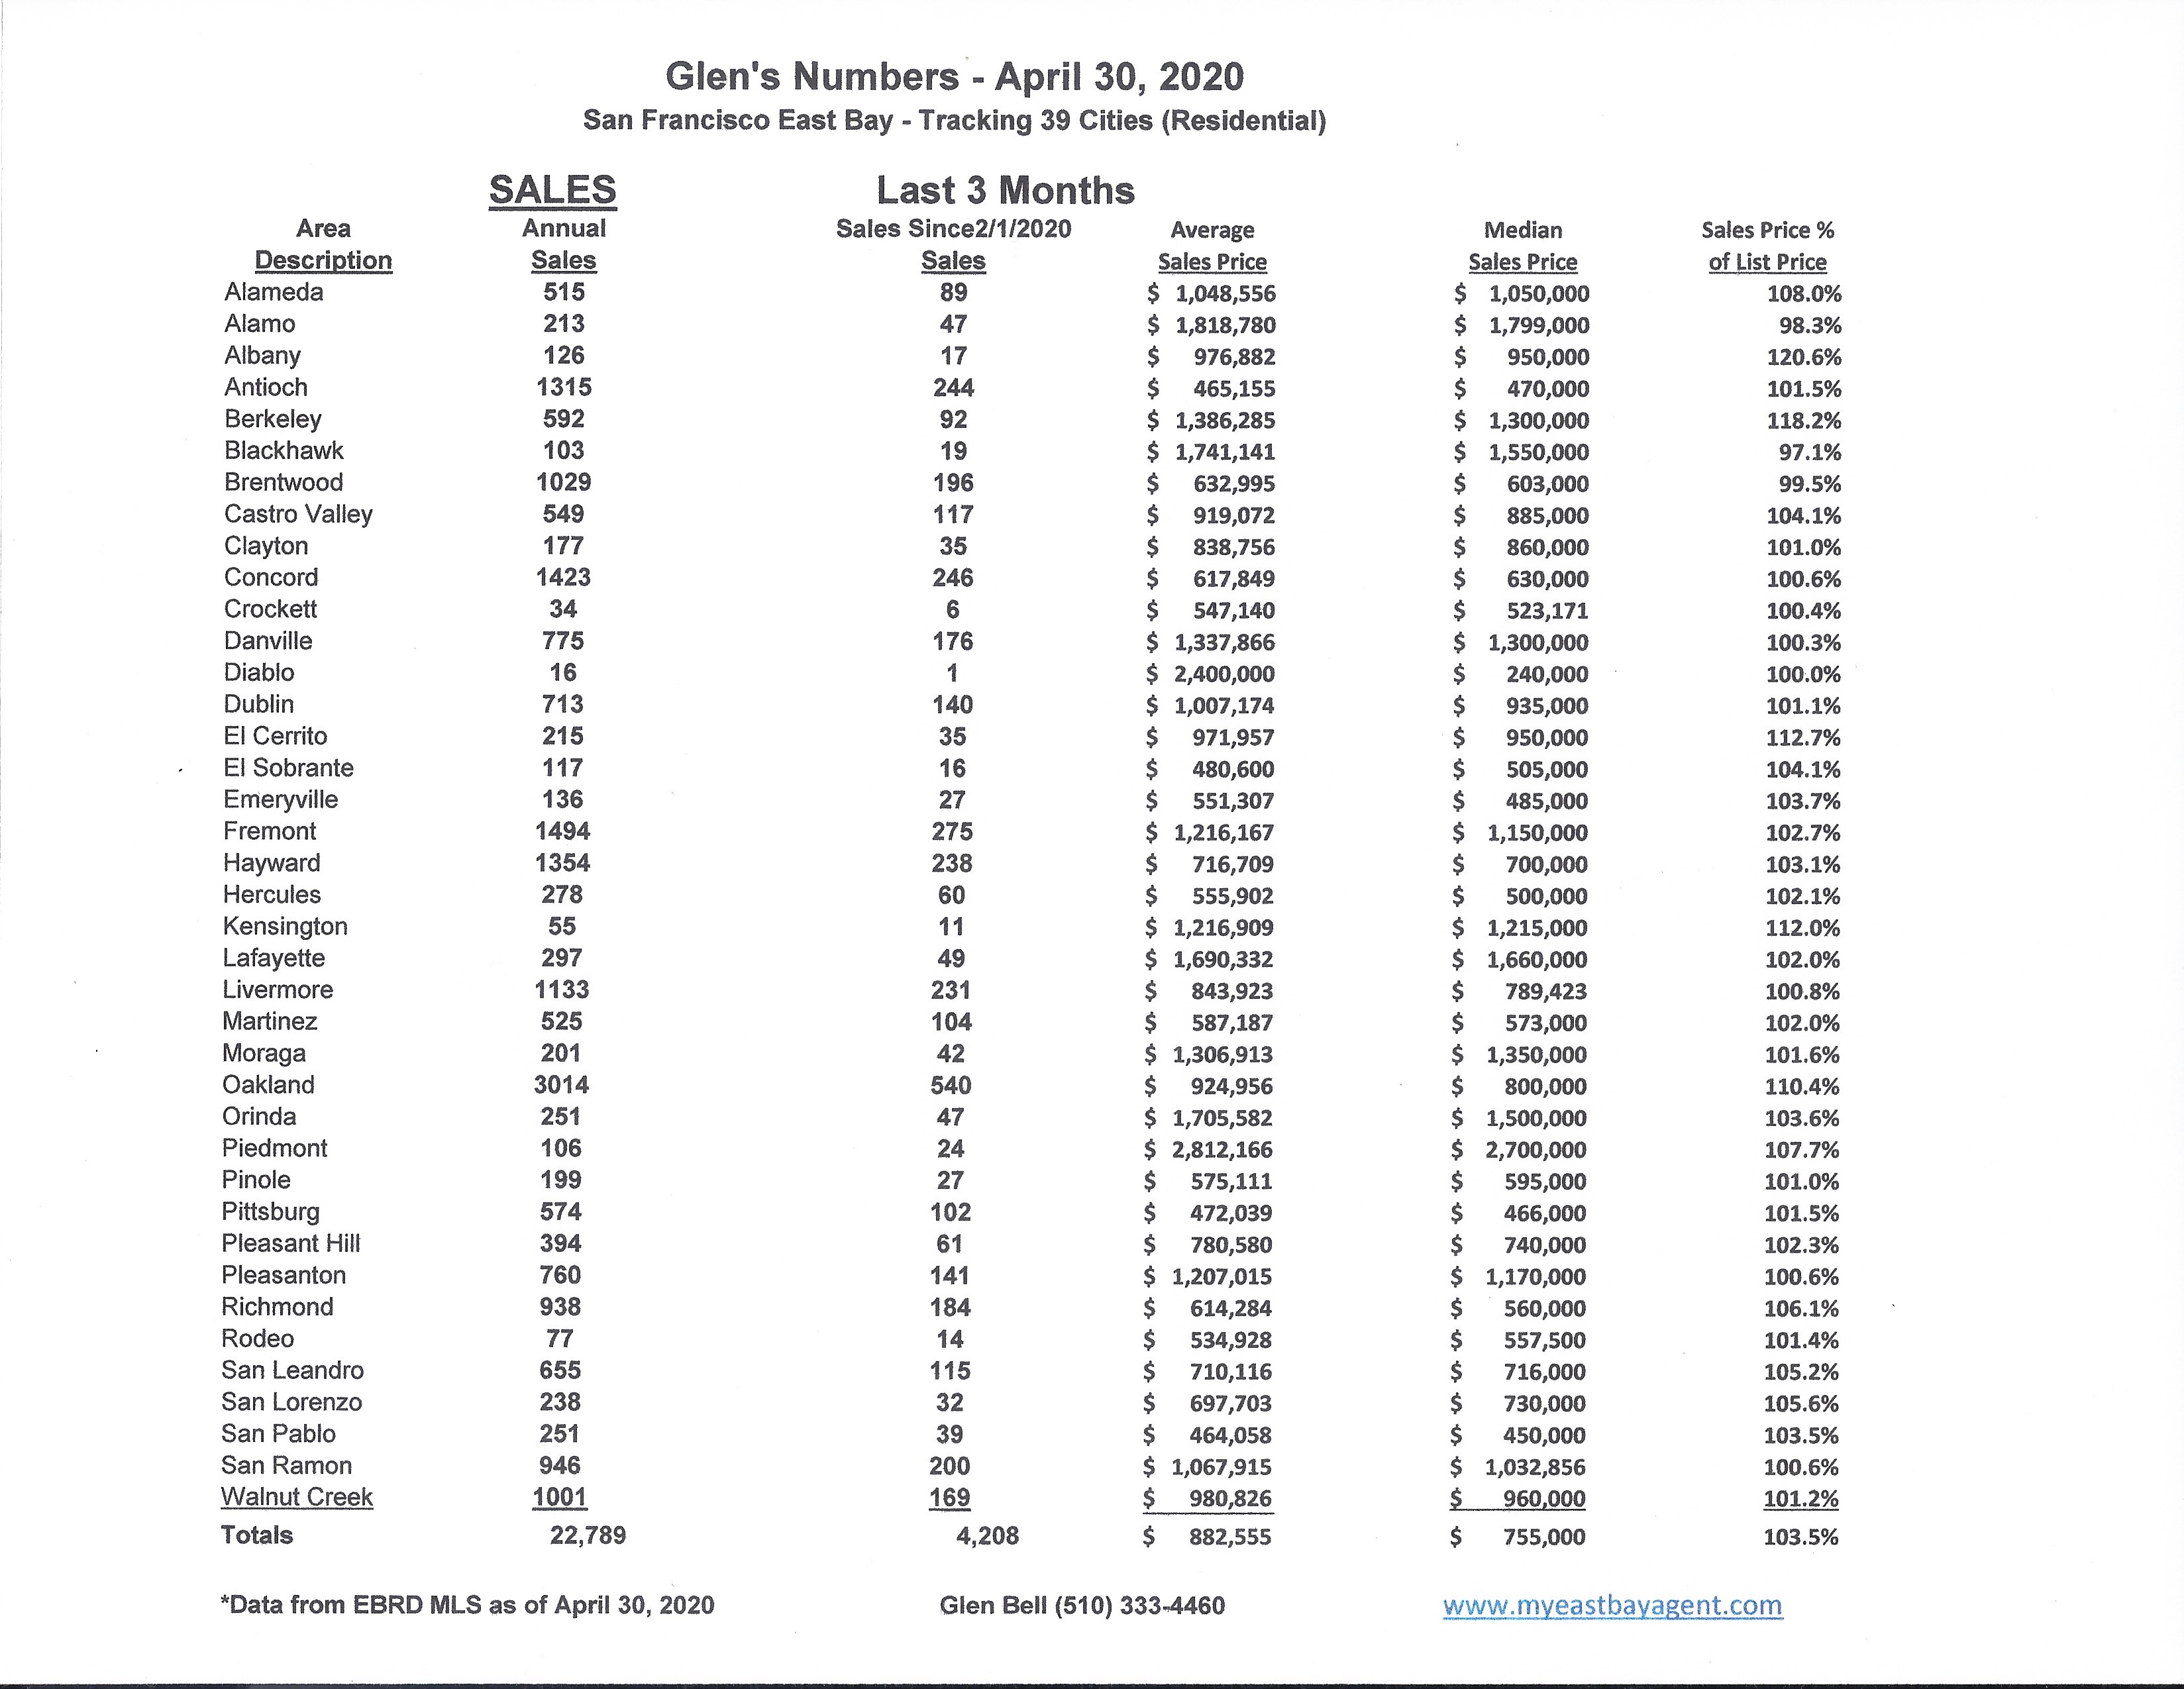
Here are some highlights for the 39 East Bay Cities that I track:
Sales are up slightly, but still 18.5% lower than last year’s numbers. Prices are up slightly as well. However, that looks to be more of a result of our earlier spring influence. This looks to be changing. Now, more homes are “sitting,” taking longer to sell, and we’re seeing more transactions fall out. Fewer buyers are going into contract.
The seasonal drop in inventory followed our normal pattern during the holidays. We watched the number of homes decrease by nearly 60% over November and December. Last year was somewhat unusual because we saw a late season start and early season end. Inventory at the end of December was at its’ 2nd lowest level since I began tracking these 39 cities in 2006, with only 1163 homes for sale at the end of December. Our expectations normally are that new home listings begin to appear on the market as early as mid-January with a steady increase of inventory every month through to September, traditionally our high point.
Inventory increased in April by 41%, however, that’s still 25% lower than what we saw last year at this time. This represents a 36 day supply of homes, compared to a 45 day supply last year at the end of April. The trend with pendings continued to slide, dropping by 21% in April. This is the second decrease in a row during a period of time when we normally see an increase. This is the lowest number I’ve seen since January 2008. This is primarily due to low inventories as well as the influence of the COVID-19 and the “shelter in place” mandate during the last month and a half.
The pending/active ratio saw a huge decrease to .72. This is lower when compared to last years’ number of .92. We were at 1.28 just last month. I can’t remember ever seeing such a large drop in just one month. The pending/active ratio has been a benchmark that we’ve used as a measure of supply and demand to determine whether we’re in a buyer’s or a seller’s market. Typically, a number well above 1, (less inventory with more pendings) favors sellers. A number below 1 favors buyers..
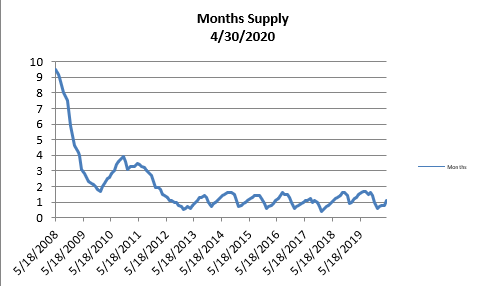
- The month’s supply for the combined 39 city area is 36 days. Historically, a 2 to 3 months’ supply is considered normal in the San Francisco East Bay Area. As you can see from the graph above, this is normally a repetitive pattern over the past four years. Supply is less when compared to last year at this time, of 45 days.
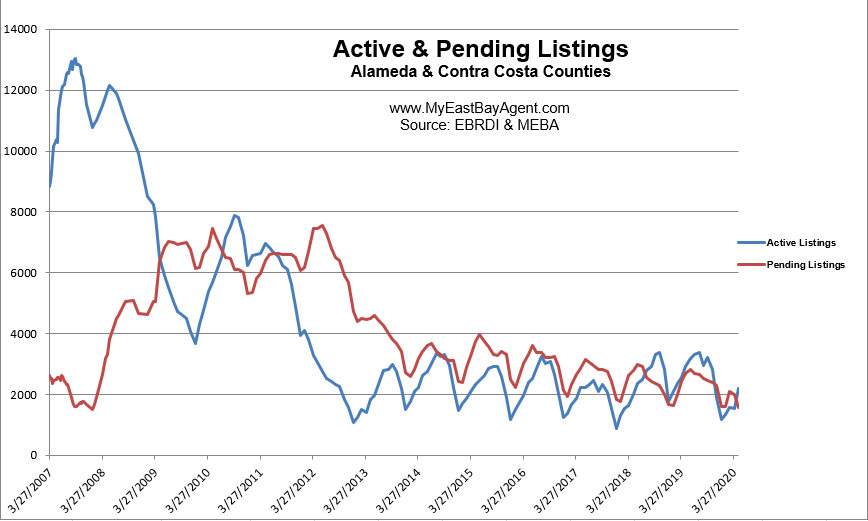
- Our inventory for the East Bay (the 39 cities tracked) is now at 2,188 homes actively for sale. This is fewer than what we saw last year at this time, of 2,915. We’re used to seeing between 3,000 and 6,000 homes in a “normal” market in the San Francisco East Bay Area. Pending sales decreased to 1,567, much lower than what we saw last year at this time of 2,695.
- Our Pending/Active Ratio is .72. Last year at this time it was .92.
- Sales over the last 3 months, on average, are 3.5% over the asking price for this area, slightly higher than what we saw last year at this time, of 2.8%.
Recent News
Zillow Forecasts a Dip in Home Prices, Rebounding By Next Year
By Claire Boeing-Reicher – Matthew Speakman on May. 4, 2020
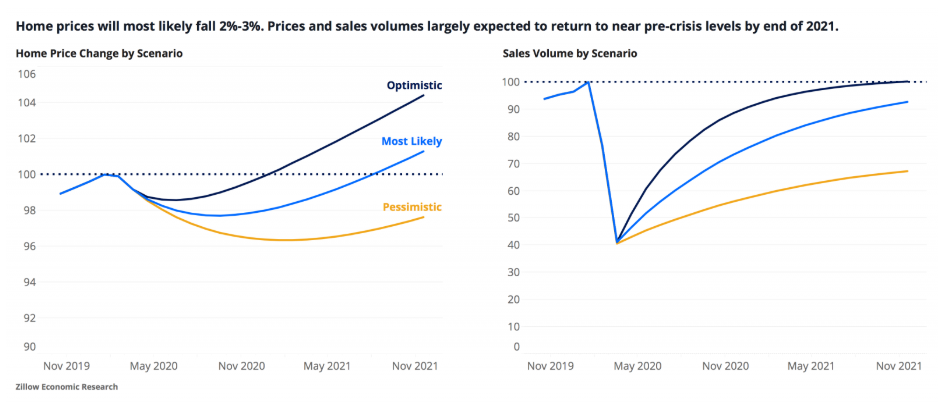
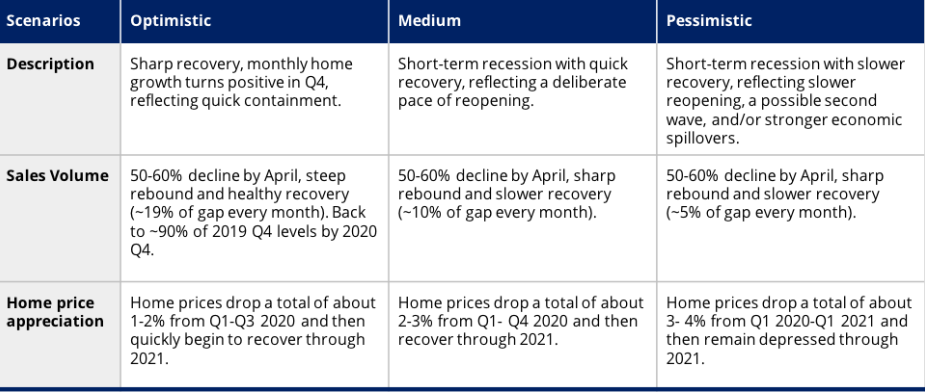
The continued economic fallout from the spread of COVID-19 has introduced immense uncertainty into the housing market as consumers step back from large purchases and social distancing puts a chill on necessary market services. As a result, Zillow expects home prices will most likely fall 2%-to-3% through the end of the year from pre-coronavirus levels, and home sales to fall as much as 60%, before both begin to slowly recover to baseline levels by the end of 2021.
The latest forecasts, based on published and proprietary macroeconomic and housing data, also include more pessimistic or optimistic projections based on the duration of the pandemic and the depth of its impact on the broader economy.
The forecasts center around a baseline prediction of a 4.9% decrease in United States GDP in 2020 and a subsequent 5.7% increase in 2021. Under the baseline scenario, we expect:
- A 2%-3% drop in prices through the end of 2020, followed by a slow recovery throughout 2021. Prices will return to Q4 2019 levels by Q3 2021.
- A 50% decline in home sales from their pre-coronavirus levels, as measured at the end of 2019. Home sales will bottom out in Q2 before beginning to improve near the end of Q2 2020.
- Sales volume will recover to about 97% of Q4 2019 levels by the end of 2021.
- The pace of recovery is what distinguishes our three scenarios from one another.
Each of our scenarios implies very different paths for home prices and sales volumes. Our optimistic scenario features a small dip in house prices in Q2-Q3 followed by a robust recovery. The baseline medium scenario features a U-shaped trough in Q4 followed by a slower recovery and our pessimistic scenario features continued weakness through all of 2021 (more of a “long U” shape). Under our more-optimistic assumptions, the market could experience a fast, V-shaped “snapback” similar to what happened in the Hong Kong real estate market after the 2003 SARS outbreak. The medium scenario features a “check-mark” shaped recovery and our pessimistic scenario features more of a “wide-U” recovery, with a longer bottom and more gradual pace of improvement.
Overview of Our Scenarios
At time of publication, we believe the medium scenario to be the most likely outcome, followed by the pessimistic scenario and then the optimistic scenario. These scenarios and our assessment of their likelihoods are open to revision and will be revisited periodically as more information regarding the timing, scale and success of relaxed social-distancing measures, among other factors, is released.
How Did We Get Here?
The housing market was beginning to heat up at the end of 2019 and into early 2020. Home price appreciation had begun to reaccelerate after a fairly tepid 2019. Sentiment across most market participants (buyers, sellers, lenders, homebuilders) were all at or near their survey highs. Sales volume and construction levels were both rising at an increased rate. Mortgage delinquency rates were near all-time lows, and record-low for-sale inventory was fueling competition for the few homes on the market.
In addition to a generally strong housing market, the broader U.S. economy was also showing signs of strength, despite some looming concerns. The labor market was riding high: The overall unemployment rate was 3.5%, tied for its lowest level in 50 years; an average of 224,000 jobs were created in the three months ending February 2020; and labor force participation was near a seven-year high. The manufacturing sector, which struggled through much of 2019, was beginning to recover as global tensions (trade war, Brexit etc.) eased and simplified. And consumer spending levels remained steady through February.
Of course, not everything was perfect. Corporate debt levels have risen markedly in recent years, and the quality of debt was beginning to be questioned even before the pandemic. Non-financial corporate debt securities and loans increased to almost 47% of GDP in the last quarter of 2019, up from a post-recession low of 40% in Q4 2010. As of January, only two U.S. companies (Microsoft and Johnson & Johnson) had AAA debt ratings — indicating the highest level of credit-worthiness. Businesses were also scaling back on investments in capital, suggesting they viewed their longer-term prospects as tenuous. Manufacturers’ spending on nondefense capital goods was lower in February 2020 ($68.8B) than it was in February 2012 ($69.7B), despite eight years of economic expansion. And ten years into a record-long economic expansion, the key Federal funds rate as set by the Federal Reserve was very low, leaving the Fed with less wiggle room than usual to stimulate the economy in the case of a downturn.
Even before the onset of the crisis, these factors combined to somewhat dampen our forward-looking outlook. But in general, macroeconomic conditions were sturdy heading into the spring. And this relatively strong economy, coupled with strong demand from home buyers and relatively friendly buying conditions thanks to low mortgage interest rates, meant the housing market was well-positioned for a strong spring selling season.
But over the course of just a few weeks, that all got turned on its head. More than 30 million (and counting) unemployment insurance claims have been filed since the middle of March, representing about one-in-six of all previously employed people counted in the March jobs report. Retail sales levels plummeted in March, falling 8.7% from February, the biggest one-month decline since the Commerce Department began tracking the data in 1992. Industrial production fell 5.4% over the same period, the largest one-month decline since the 1940s.
These and other disruptions have been shocking in both their speed and scale. But even so, we believe many of them to be transitory and will be addressed as the economy opens up again.
Scenario Specifics
In creating this forecast, we relied heavily on macroeconomic forecasts created by Goldman Sachs and the International Monetary Fund, both of which call for a 5%-to-6% decline in GDP in 2020, followed by a 4.5%-to-5.5%% increase in GDP in 2021. A number of high-frequency data points published by Goldman Sachs offering insight into many industries and sectors, including housing, also allowed our team to make frequent updates to our outlook based on hard, industry-specific data.
Our forecast follows a similar structure to Goldman’s, which estimates how much of the gap between actual and potential GDP disappears in the following month for different industries. Our baseline forecast for GDP assumes the same persistence in the gap between actual and potential GDP as Goldman Sachs does. To translate the GDP forecast into a forecast of home prices and transactions, we conducted two separate econometric analyses — relating both long-term home price growth and home sales to GDP — and applied the findings to our GDP scenarios. For home price movements over time we used data from the S&P CoreLogic Case-Shiller home price indices. For sales volume over time we used data from the National Association of Realtors. More information on the specifics of our econometric analysis can be found in the appendix below. We also overlaid scenario-specific factors based on the spread of COVID, the strength of social distancing measures and early signals of recovery in order to come to our conclusions. Specifically, our baseline predicts that about 10% of the gap between actual home transactions and baseline trend disappears in the following month. Differences in the persistence of this gap are what differentiates the three scenarios from one another. The optimistic scenarios for home prices and transactions suggest this gap will recede about twice as quickly as it would in the medium scenarios. The pessimistic scenarios, meanwhile, suggest the recovery rate will be half that of the medium scenarios.
To track the probabilities of these scenarios and to alert us to the need for potential changes (especially to the shape or speed of recovery paths), we are focusing mainly on forward-looking indicators, outside forecasts and empirical studies. On the forward-looking indicator side, we are most-closely tracking survey data and selected financial statistics. The survey data are currently telling us that we should expect much more short-term disruption than longer-term. For instance, the Philadelphia Fed Manufacturing Business Outlook Survey from April 2020 indicated that while most manufacturers view current conditions negatively (worse than 2008-09), they are much more optimistic about future conditions (unlike 2008-09). Similarly, the University of Michigan Surveys of Consumers for April 2020 show a large fall in consumer sentiment reflecting current conditions, while the fall in consumer expectations has been less extreme. Meanwhile, financial data (especially measures of implied volatility such as the VIX, policy uncertainty, mortgage rates and bond spreads) are indicating that financial risks during late March briefly approached the conditions of late 2008, but have since subsided somewhat. That said, we will closely monitor financial data to see if we need to revisit the possibility of creating an even more pessimistic scenario that includes a more fully fledged financial crisis.
Housing-specific data have also validated our assumption of a ~50% decline in sales, while also beginning to offer some clues as to what the next phase of this crisis is going to look like. For-purchase mortgage applications have fallen 31% from a year ago, but have recently shown some signs of stabilization. At their worst, home showings fell as much as 50% since the beginning of the year, but subsequently rose to a level “only” 27.5% below where they were to start the year. Internal measures of newly-pending home sales and new for-sale listings have also shown signs of turning the corner.
Downside Risks and Go-Forward Plan
While our internal and external data currently point to a bottom in real estate transactions at the beginning of April 2020, we are watching for signs of either a renewed contraction or other indicators of a slowing recovery. We are also monitoring the results of ongoing epidemiological studies showing the efficacy of efforts to help curb the spread of the coronavirus and early economic reopening efforts, to help inform us on the likely speed and shape of a recovery. We are also monitoring and commenting on macrofinancial data including corporate bond spreads, mortgage rates, implied volatility and delinquency rates for signs of unexpected weakening. Widespread deterioration in these and other key data risks the economy landing closer to a 2008-style financial crisis scenario, on top of the direct effects of the pandemic.
On top of the broader economic dangers, there are also a number of public health and/or policy risks that, if worsened, might warrant an adjustment of our probability weights and possibly the creation of a more pessimistic scenario to consider. These include:
- A relative lack of coordination between states in their plans to reopen their respective markets, risking the introduction of state-to-state disease transmission, false restarts, risks of new outbreaks and a deeper/longer downturn.
- A continued shortage of testing and personal protective equipment (PPE), limiting the ability to track and contain the virus’s spread and placing continued stress on the health care system.
- Ineffective or insufficient federal fiscal relief efforts, resulting in a larger-than-expected impact to labor and financial markets and threatening state balance sheets.
- As-yet-unquantified risks to the balance sheets of households (people’s ability to pay their debt obligations, willingness to resume normal spending activity) and businesses (how many businesses close and/or resume activity with lower employment?).
- Ineffective relief in the mortgage industry.
Charting the Trends in the Current Housing Market
By Alina Ptaszynski, Redfin, April 30,2010
In our weekly market update, Redfin reported home-buying demand continued to recover last week, as states began making plans to begin to reopen businesses. Here are five additional charts that illustrate the latest developments in the housing market as the world continues to grapple with the coronavirus pandemic. Additional charts and local data are available for download in the Redfin Data Center.
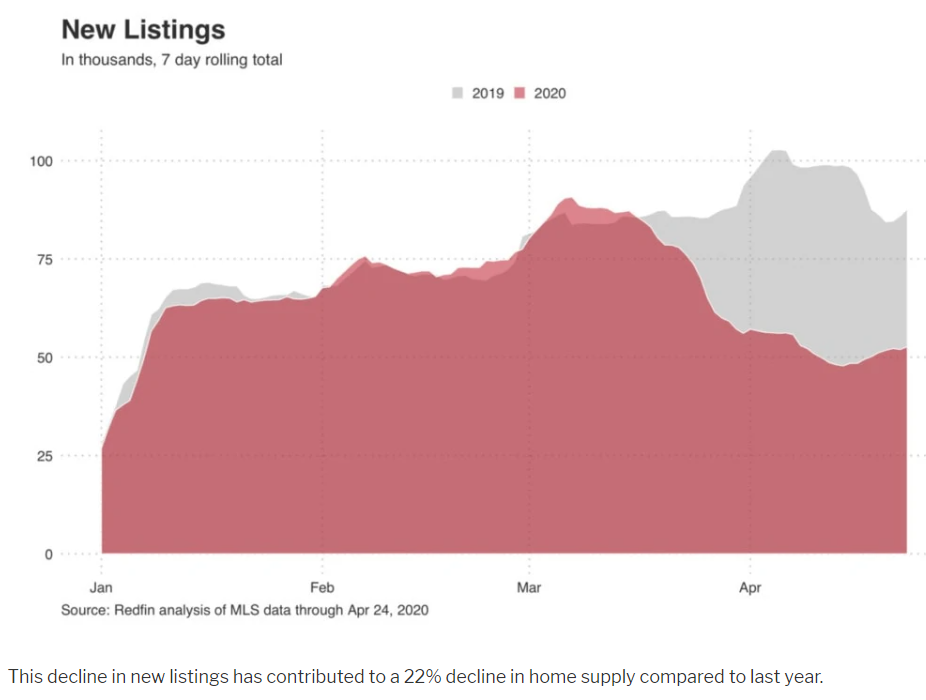
Sellers Continue to Hold Off on Listing
There were almost 53,000 new-home listings last week, down about 40% from a year ago. That’s an improvement from the 50% decline we reported last week. The improvement may be partly due to the Easter holiday falling around this time last year. Looking over the past four weeks, new listings are down 45%, with just 210,000 new homes put on the market. The five preceding years averaged 378,000 new listings during the same period.
Price Growth is Now Nearly Flat
Last week the median listing price was $308,000, up just 1% compared to the same period the prior year. The week prior, we reported that asking-price growth had stopped its rapid descent and reversed course, increasing 3% year over year. Redfin lead economist Taylor Marr says, “Asking prices may be settling into a flat trend line for now. The primary reason for the shift over the past month though hasn’t been an increase in sellers listing below their Redfin estimate, but instead fewer higher-end properties coming to the market—bringing down the average.”
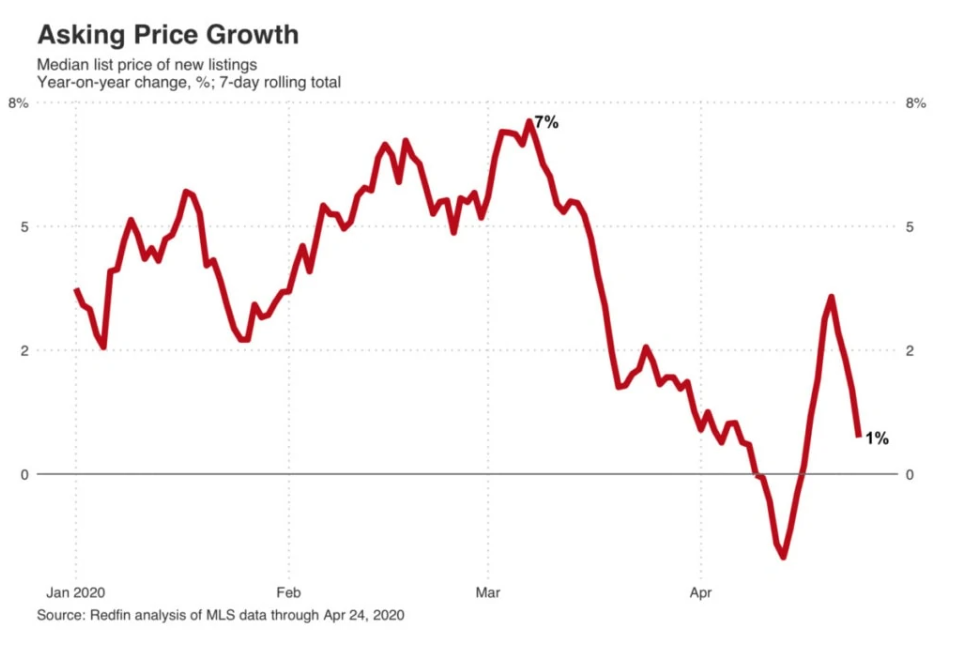
While Redfin agents are still seeing bidding wars, competition has slowed, giving some buyers a chance to negotiate a better price. In the previously red-hot sellers’ market of Seattle, Redfin agent David Palmer says buyers are now able to be a little more aggressive. “There’s fear on both sides. We have a bunch of buyers who want $40,000 price reductions or credit that really should have been $15,000 to $20,000. We’re calling it the ‘coronavirus credit’. I’d say it is getting a little closer to a level playing field, but sellers know that inventory is low and they’re trying to stick to their guns.”
Sellers Aren’t Dropping Prices
While sellers may be more willing to negotiate, they aren’t dropping their prices. Just 3% of homes on the market had a price drop last week, which is the same as last year and below the average in January and February of 4%.
“Sellers are opting to delist and wait for a more favorable market rather than take a haircut on the price,” says Marr. Sellers who do reduce the price are dropping it by an average of just 1.6% compared to 3.3% last year. “This may be a sign that sellers are using a price drop as a strategy to drum up new interest in the home. They worry buyers overlooked their home in the early coronavirus panic and know that a price drop triggers a notification to be sent to buyers who have a saved search.”
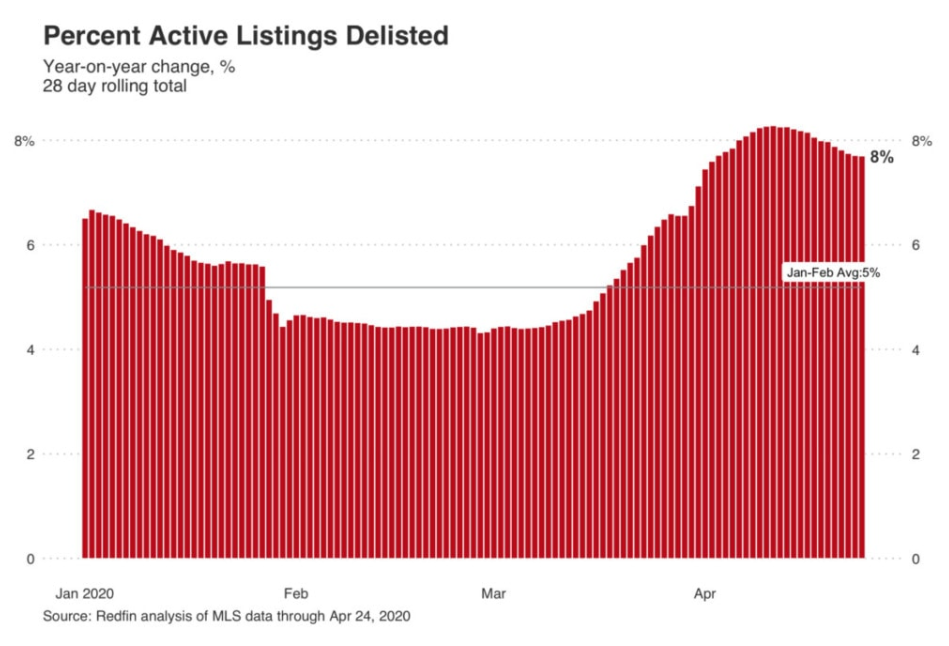
Sellers Continue to Pull Homes Off the Market
In the four weeks ended April 24, 8% of active listings were pulled from the market. While we appear to be past the peak of delistings, sellers are still removing their homes from the market at a significantly higher rate than they were at this time last year. During the week ended April 24, delistings rose 56% year over year to 15,900 homes, down from the peak of over 100% during the final week of March.
Pending Home Sales Drop to Lowest Level Since 2011 as Coronavirus Takes Its Toll
By Jacob Passy, Realtor.com, Apr 29, 2020
The numbers: The index of pending home sales dropped 20.8% in March as the coronavirus pandemic took a significant bite out of real-estate activity, the National Association of Realtors reported Wednesday.
This represented the lowest level of pending sales since 2011.
The index measures real-estate transactions where a contract was signed but the sale had not yet closed, benchmarked to contract-signing activity in 2001. It serves as an indicator for existing-home sales reports in the coming months.
What happened: Compared with March 2019, signings were down 16.3% nationally.
On a monthly basis, pending sales dropped in every region with the West seeing the largest decline at 26.8%, followed by the Midwest (down 22%) and the South (19.5%). In the Northeast, contract signings only decreased 14.5%.
The big picture: While the coronavirus outbreak has not caused real-estate activity to stop entirely, it has put a major damper on what economists had anticipated would be a strong spring home-buying season thanks to low mortgage rates and pent-up demand among buyers. Without the spring home-buying season, home sales are expected to drop 14% in 2020.
“As consumers become more accustomed to social distancing protocols, and with the economy slowly and safely reopening, listings and buying activity will resume, especially given the record low mortgage rates,” said Lawrence Yun, chief economist at the National Association of Realtors. “The usual spring buying season will be missed, however, so a bounce-back later in the year will be insufficient to make up for the loss of sales in the second quarter.”
With stay-at-home orders and social-distancing guidelines in effect for most of the country, the process of buying a home (and then moving) has become more complicated. Nearly one-fifth of Realtors said that stay-at-home orders made it nearly impossible to finish deals, according to a recent poll by the National Association of Realtors. (Another 40% of Realtors meanwhile said some aspects of the home-buying process still required in-person interaction, but that wearing masks and gloves could make it safer.)
Amid these orders, open houses have gone virtual, and documents are now being signed in parking lots rather than the offices of title insurers and attorneys. In some parts of the country, the closure of government offices means that sales cannot be recorded as quickly as usual.
Some would-be sellers have held off on listing their homes, worried about a potential dip in prices or demand. Between the first and last weeks of March, the number of new listing was down 30%, according to data from Realtor.com. Comparatively, the number of listings grew by 15% during that same stretch of time last year.
What they’re saying: “New listings continued to fall in April, as COVID-19 concerns prompted sellers to wait, which means additional declines in pending and closed home sales are likely ahead,” said Danielle Hale, chief economist at Realtor.com. “Although fewer buyers signed contracts to buy as they stayed home to prevent the spread of COVID-19, surveys suggest that most home buyers expect just a few months delay in their journey.”
“How infection rates respond in states reopening will be a telling sign as we move forward on how long we can expect a slump in sales to persist,” said Ruben Gonzalez, chief economist, Keller Williams. “If we see no resurgence in infections, we could see sales begin to stabilize in early June; however, if there is a resurgence in infection rates, a substantial backslide across all sectors of the economy is likely.”
Market reaction: The Dow Jones Industrial Average and the S&P 500 were both up in Wednesday morning trading in spite of the downturns in pending home sales and GDP. The yield on the 10-year Treasury note was down slightly.
Coronavirus eviction ban: What Bay Area renters and landlords need to know
By J.K. Dineen, SF Chronicle, April 9, 2020
With many Californians facing economic distress because of the coronavirus, state officials have taken steps to block evictions and protect renters. Here’s what Bay Area tenants and landlords need to know.
Answers for renters
Q: Can my landlord evict me while the health emergency is in place?
A: No. On April 6, state judicial leaders barred courts from enforcing eviction orders against renters. In ruling that eviction orders “threaten to remove people from the very homes they have been instructed to remain in,” the state Judicial Council went a step further than a March 27 executive order by Gov. Gavin Newsom, which required a statewide, two-month halt on evictions of tenants who could not afford to pay rent because of the coronavirus pandemic. The action halts legal procedures used by property owners to initiate and enforce evictions.
Q: What sort of evictions does the ruling cover?
A: The ruling applied to all evictions, regardless of cause.
Q: How long with the ruling be in effect?
A: The order will remain in effect until 90 days after Newsom declares an end to the current state of emergency. That’s likely at least through July.
Q: What if I was served an eviction notice before the Judicial Council order went into effect?
A: Tenants who were served with a eviction court summons prior to the new order cannot be penalized for failing to respond, unless they pose a public danger. For tenants who have already responded, trials are postponed for at least 60 days.
Q: What happens when the order is lifted? How soon will my rent be due?
A: It’s unclear. While these emergency rules effectively put evictions on hold at least through the summer, they do not “establish any new tenant rights or defenses to an eviction, address requirements for notifying landlords or providing documentation when tenants are unable to pay rent due to loss of income or other coronavirus-related reasons, or address how repayment will be handled,” according to the San Francisco Tenants Union. It is likely the state Legislature will address those issues when it returns in May.
Q: Can my landlord raise my rent during the health emergency?
A: It depends on the city. San Francisco Supervisor Aaron Peskin introduced legislation on April 7 that would freeze rent increases and pass-throughs. That legislation passed. The San Francisco Apartment Association has already asked its members not to raise rents during the health emergency. Some cities have also enacted rent freezes. Concord has enacted a rent freeze for most people. Oakland has has capped rent increases at 3.5% in most cases and landlords can’t charge late fees.
What Your Real Estate Agent Wants You To Know About the Housing Market Right Now
By Ana Durrani, Realtor.com, Apr 29, 2020
Spring is typically a busy time for buying and selling homes, but the coronavirus pandemic has pushed homeowners and shoppers into new, uncharted territory. Shelter-in-place orders and concerns about contagion have forced many real estate agents to cancel open houses, while unemployment is at a historically high level.
But even in the midst of a deadly pandemic that is devastating the economy, many Americans still want or even need to buy a home in the near future.
“I definitely have clients that are still interested in viewing homes but have been honest that they won’t put pen to paper and write an offer until they know the health crisis has passed and they can assess the impact on real estate and the economy,” says Noah Grassi, a Realtor® for Compass in San Diego.
So, what does the current state of the housing market mean for buyers? With so much uncertainty these days, buying—or planning to buy—a home during a pandemic requires extra careful consideration. That’s why we reached out to real estate agents to get their honest takes on what’s really happening in the housing market in the time of COVID-19, how buyers can prepare, and what we can likely expect when the pandemic subsides.
There may be some reductions in home prices
The federal government has provided relief through cash payments, and lenders are also offering mortgage forbearance options. But with unemployment numbers rising, more people could be forced to sell their homes or enter foreclosure, potentially leading to reductions in home prices.
“Due to millions of job losses per week, and the long-term impact of COVID, I expect housing prices to shift into a downward trend,” says Justin Brennan with Brennan Real Estate Group, Pacific Sotheby’s International Realty. “To what extent they go down will be determined by how many job losses become permanent versus temporary.”
If the price cuts materialize, that would be good news for buyers in locations where affordability was already stretched thin.
More homes will come onto the market
A bigger inventory of homes on the market may soon be on the horizon for buyers.
“There’s an inventory of sellers on the sidelines, and it is growing every day,” says Grassi. “These are owners that still reside in their property and don’t want strangers—agents and potential buyers—walking through their home at the moment due to the health crisis. Once it is clear the risk is minimal, I think we are going to see a big increase in the number of homes for sale.”
There’s a chance that buyers are also waiting in the wings for the coronavirus pandemic to end and the economy to get back on its feet. But the likely big inventory of homes for sale could put buyers in a good position.
Interest rates are likely to stay low
Over the past few months, mortgage interest rates have been lower than we’ve ever seen. And experts expect that trend to continue.
“The general consensus of the experts is that mortgage interest rates will remain attractive for many months to come,” says Grassi. “If buyers are hoping to try to find a deal on their mortgage during this health crisis, they should be writing offers now.”
If low mortgage rates and being stuck indoors have convinced you it’s time to find a new home, this may be a time to consider buying.
Keep in touch with your mortgage lender
Serious buyers should always have their mortgage lender on speed dial, but in these unprecedented times, this advice is more relevant than ever.
“Make sure you are constantly speaking with your lender on updates in the lending market,” says Brennan. “If you fall in love with a home, focus on the long term and getting a great interest rate and payment versus trying to time the market.”


